. 2014 May;155(5):1589-95.
doi: 10.1210/en.2013-1974. Epub 2014 Jan 17.

Bioenergetics during calvarial osteoblast differentiation reflect strain differences in bone mass

Affiliations

Bioenergetics during calvarial osteoblast differentiation reflect strain differences in bone mass

Anyonya R Guntur et al. Endocrinology. 2014 May.

Abstract

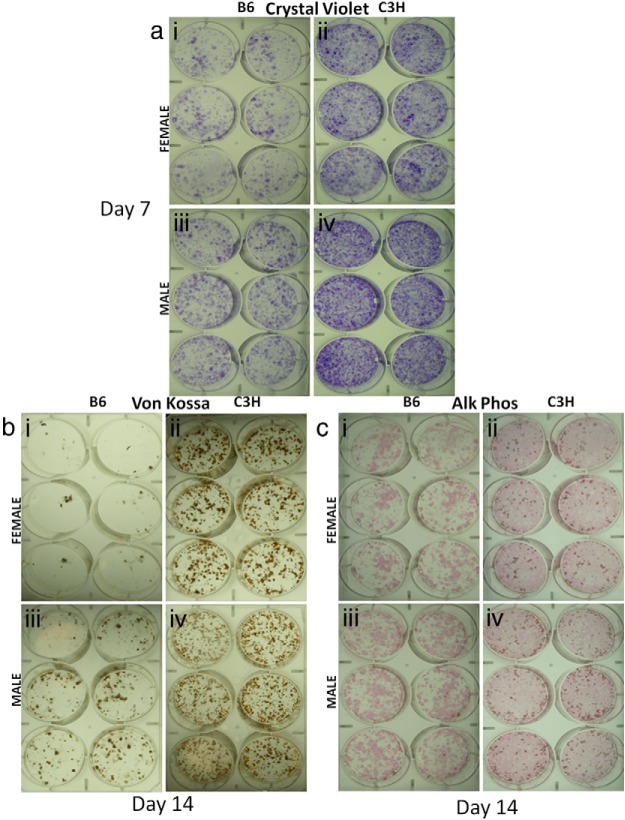
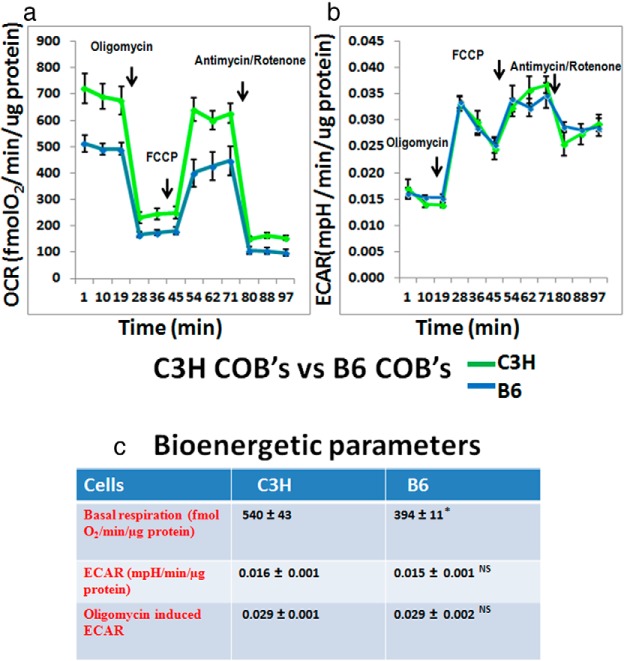
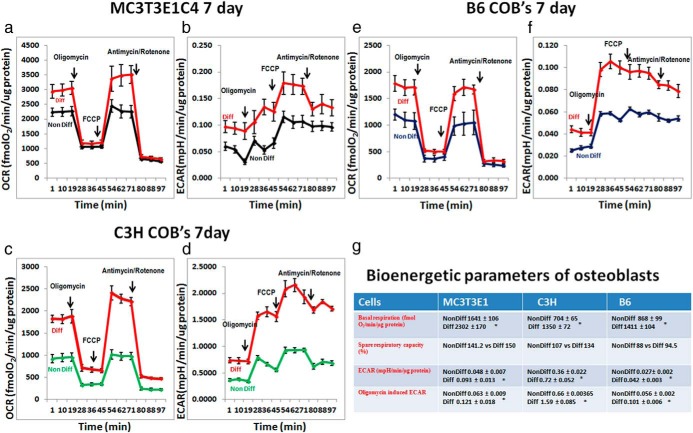
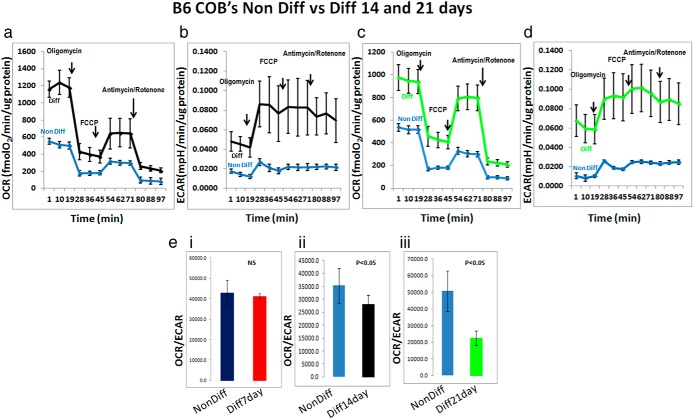
Osteoblastogenesis is the process by which mesenchymal stem cells differentiate into osteoblasts that synthesize collagen and mineralize matrix. The pace and magnitude of this process are determined by multiple genetic and environmental factors. Two inbred strains of mice, C3H/HeJ and C57BL/6J, exhibit differences in peak bone mass and bone formation. Although all the heritable factors that differ between these strains have not been elucidated, a recent F1 hybrid expression panel (C3H × B6) revealed major genotypic differences in osteoblastic genes related to cellular respiration and oxidative phosphorylation. Thus, we hypothesized that the metabolic rate of energy utilization by osteoblasts differed by strain and would ultimately contribute to differences in bone formation. In order to study the bioenergetic profile of osteoblasts, we measured oxygen consumption rates (OCR) and extracellular acidification rates (ECAR) first in a preosteoblastic cell line MC3T3-E1C4 and subsequently in primary calvarial osteoblasts from C3H and B6 mice at days 7, 14, and 21 of differentiation. During osteoblast differentiation in media containing ascorbic acid and β-glycerophosphate, all 3 cell types increased their oxygen consumption and extracellular acidification rates compared with the same cells grown in regular media. These increases are sustained throughout differentiation. Importantly, C3H calvarial osteoblasts had greater oxygen consumption rates than B6 consistent with their in vivo phenotype of higher bone formation. Interestingly, osteoblasts utilized both oxidative phosphorylation and glycolysis during the differentiation process although mature osteoblasts were more dependent on glycolysis at the 21-day time point than oxidative phosphorylation. Thus, determinants of oxygen consumption reflect strain differences in bone mass and provide the first evidence that during collagen synthesis osteoblasts use both glycolysis and oxidative phosphorylation to synthesize and mineralize matrix.


Figures

Figure 1.
Figure 1.
C3H have more bone-forming progenitors than B6. Crystal violet, 7 days (panel a) VonKossa, 14 days (panel b and c) alkaline phosphatase+Von Kossa 14 days (panel c), stained BMSC culture cells from B6 and C3H 8-week-old female (a, b, c, i, ii) and male (a, b, c, iii, iv) mice cultured in differentiation media. Alk Phos, alkaline phosphatase.
Figure 2.
Figure 2.
Comparison of C3H vs B6 calvarial osteoblasts OCR (panel a) and ECAR (panel b) profiles of C3H and B6 calvarial osteoblasts that have undergone the Mito Stress test; this is representative of 2 individual tissue culture experiments. Each data point represents 3 or more wells; arrows point to the injection of electron transport chain inhibitors. Oligomycin is injected after 3 basal OCR readings; next FCCP, an uncoupler, is injected, which leads to an increase in OCR; this is followed by injection with both antimycin A and rotenone, leading to inhibition of complex I and complex III of the electron transport chain. ECAR is shown as change in pH at the same time points when OCR readings are obtained. This is the basic set up for all the representative Mito Stress experiments that are shown in this paper. c, Metabolic parameters obtained from C3H and B6 cells cultured for 7 days in growth media, followed by Mito Stress test. All data are represented as ± SEM; P = 0.0008 for OCR; P = .6 for ECAR; and P = .9 for oligomycin-induced ECAR (not significant). COB, calvarial osteoblast.
Figure 3.
Figure 3.
Bioenergetics profile of MC3T3-E1C4, C3H, and B6 calvarial osteoblasts OCR (panel a) and ECAR (panel b) profile of MC3T3-E1C4 cells undergoing Mito Stress test comparing cells differentiated for 7 days in osteogenic media vs cells in regular media (50 000 cells per well). c and d, OCR and ECAR profiles of C3H calvarial osteoblasts that have undergone osteogenic differentiation compared with cells that were cultured in regular media. e and f, B6 calvarial osteoblasts undergoing Mito Stress test. g, Metabolic profile of each cell type from one individual; separate experiment the values obtained are an average of 3 individual time point, and each time point is an average of at least 3 individual wells. The data shown are representative of at least 2 individual differentiation assays on which the Seahorse Mito Stress experiments were performed. Assays for each cell line/strain were performed on separate plates; therefore statistical comparisons cannot be made between cell lines/strains. All data are represented as ± SEM and P < .05 compared with line/strain-matched nondifferentiated controls. COB, calvarial osteoblast.
Figure 4.
Figure 4.
B6 calvarial osteoblasts differentiated for 14 and 21days, OCR (a and c) and ECAR (b and d) profiles of B6 calvarial osteoblasts that have undergone differentiation for 14 days (a and b) and 21 days (c and d). The data shown are representative of 2 individual runs for the 14-day assay and an average of 2 independent runs for the 21-day assay. (e, i, ii, iii) Bar graphs for OCR:ECAR ratio for B6 calvarial osteoblasts that have been differentiated for 7, 14, and 21 days, respectively, in osteogenic differentiation media and compared with nondifferentiation media. Diff, differentiation; Non Diff, nondifferentiation.

References

    1. Karsenty G, Kronenberg HM, Settembre C. Genetic control of bone formation. Annu Rev Cell Dev Biol. 2009;25:629–648 - PubMed
    1. Beamer WG, Donahue LR, Rosen CJ, Baylink DJ. Genetic variability in adult bone density among inbred strains of mice. Bone. 1996;18(5):397–403 - PubMed
    1. Zoidis E, Ghirlanda-Keller C, Schmid C. Stimulation of glucose transport in osteoblastic cells by parathyroid hormone and insulin-like growth factor I. Mol Cell Biochem. 2011;348(1–2):33–42 - PubMed
    1. Thomas DM, Maher F, Rogers SD, Best JD. Expression and regulation by insulin of Glut 3 in UMR 106–01, a clonal rat osteosarcoma cell line. Biochem Biophys Res Commun. 1996;218(3):789–793 - PubMed
    1. Shyh-Chang N, Daley GQ, Cantley LC. Stem cell metabolism in tissue development and aging. Development. 2013;140(12):2535–2547 - PMC - PubMed

Publication types

MeSH terms