

doi: 10.1021/ci400568c.
Epub 2014 Jan 28.
Quality matters: extension of clusters of residues with good hydrophobic contacts stabilize (hyper)thermophilic proteins
Affiliations
- PMID: 24437522
- PMCID: PMC3985445
- DOI: 10.1021/ci400568c
Item in Clipboard
Quality matters: extension of clusters of residues with good hydrophobic contacts stabilize (hyper)thermophilic proteins
J Chem Inf Model.
.
Abstract
Identifying determinant(s) of protein thermostability is key for rational and data-driven protein engineering. By analyzing more than 130 pairs of mesophilic/(hyper)thermophilic proteins, we identified the quality (residue-wise energy) of hydrophobic interactions as a key factor for protein thermostability. This distinguishes our study from previous ones that investigated predominantly structural determinants. Considering this key factor, we successfully discriminated between pairs of mesophilic/(hyper)thermophilic proteins (discrimination accuracy: ∼80%) and searched for structural weak spots in E. coli dihydrofolate reductase (classification accuracy: 70%).
Figures
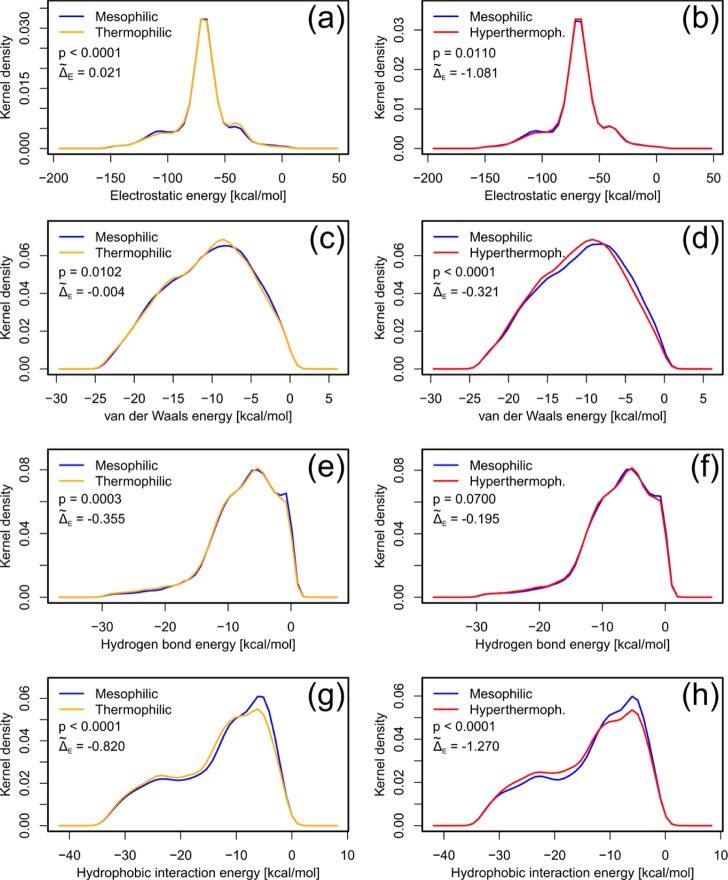
PDFs obtained
by kernel density estimation of residue-wise energy
components: electrostatic energy (a and b), van der Waals energy (c
and d), hydrogen bond energy (e and f), and hydrophobic interaction
energy (g and h) for pairs of mesophilic/thermophilic (a, c, e, g),
as well as mesophilic/hyperthermophilic (b, d, f, h) protomers. A
normal kernel function with an optimal smoothing parameter at each data point was used for calculating
the PDFs. The residue-wise energy values were trimmed to exclude values
<1 percentile and >99 percentile. The statistical significance
of the difference of two PDFs was calculated by a bootstrap hypothesis
test of equality generating 10000 bootstrap samples as implemented
in the “sm” package of
the R program (http://www.r-project.org ). Δ̃E indicates the difference between median
residue-wise energies for (hyper)thermophilic and mesophilic protomers
calculated from the kernel estimates.
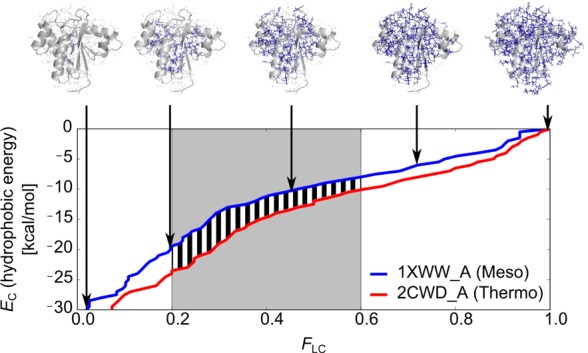
Discriminating
mesophilic and (hyper)thermophilic proteins based
on clusters of residues with good residue-wise energy components.
Residues are clustered together if they are neighbors and if their
values of the residue-wise energy components are below a cutoff EC (largest clusters for selected EC values are shown in the structures on the top as blue
sticks). Residues are considered neighbors if the distance between
the closest pair of atoms is less than or equal to 4 Å. EC is increased in a stepwise manner, and the
clustering is repeated. As a result, a hierarchical clustering is
obtained where clusters become larger as EC increases. For each EC value, the fraction
of residues that is part of the largest cluster with respect to all
protein residues (FLC) is calculated.
As a descriptor for the discrimination, the area between the respective EC vs FLC curves
for the (hyper)thermophilic and mesophilic proteins (black stripes)
is then determined for the range of FLC ∈ [0.2, 0.6] (gray shading). If this value is negative, clusters
of equal relative size have better residue-wise energy components
in the case of the (hyper)thermophilic protein than in the case of
the mesophilic protein. Preliminary tests showed that using other
ranges of FLC values for determining the
area between the EC vs FLC curves does not result in significantly different discrimination
accuracies than the best discrimination accuracies obtained with FLC ∈ [0.2, 0.6].
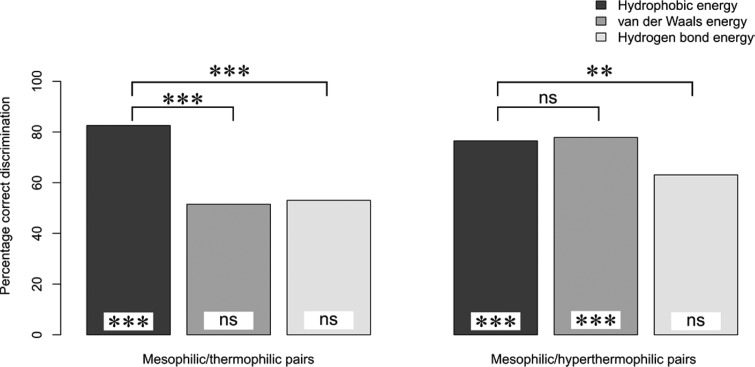
Discrimination accuracy between mesophilic and (hyper)thermophilic
protomers based on clusters of residues with good residue-wise energy
components. Lines connecting two bars indicate if the difference in
discrimination accuracies for the two respective energy components
is statistically significant. Marks at the bottom of a column indicate
if the discrimination accuracy is significantly different from a random
discrimination (50%). The statistical significance of the difference
in discrimination accuracies is computed in both cases by a bootstrap
hypothesis test of equality generating 10000 bootstrap samples. The
significance levels are marked by ***: p < 0.001;
**: p < 0.01; and ns: p >
0.05.
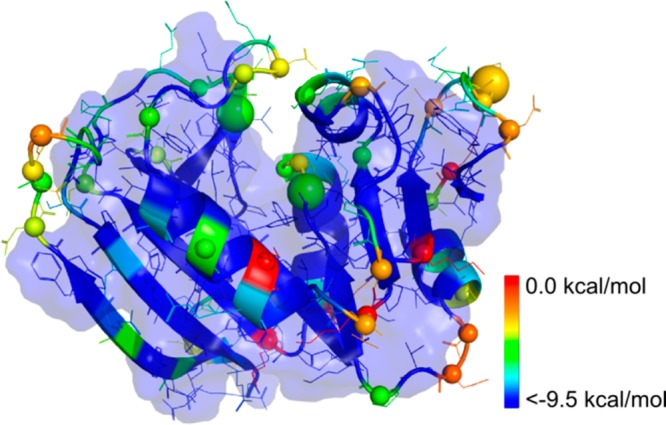
Predicted weak spots
mapped onto the structure of E. coli DHFR. Residues are colored by a rainbow color
ramp according to their hydrophobic interaction energies. The largest
cluster with FLC = 0.5 observed at a cutoff of the hydrophobic interaction energy EC = −9.5 kcal
mol–1 is enclosed by a transparent surface. Cα atoms of weak spot residues are represented as spheres.
Weak spots that have been validated in the literature are marked by
a large sphere.
References
-
- Demirjian D. C.; Moris-Varas F.; Cassidy C. S. Enzymes from extremophiles. Curr. Opin. Chem. Biol. 2001, 5, 144–151. - PubMed
-
- Van den Burg B. Extremophiles as a source for novel enzymes. Curr. Opin. Microbiol. 2003, 6, 213–218. - PubMed
-
- Egorova K.; Antranikian G. Industrial relevance of thermophilic Archaea. Curr. Opin. Microbiol. 2005, 8, 649–655. - PubMed
-
- Niehaus F.; Bertoldo C.; Kahler M.; Antranikian G. Extremophiles as a source of novel enzymes for industrial application. Appl. Microbiol. Biotechnol. 1999, 51, 711–729. - PubMed
Publication types
MeSH terms
Substances
LinkOut - more resources
Full Text Sources
Other Literature Sources
Molecular Biology Databases
