Review
. 2014 Mar 17;27(3):356-66.
doi: 10.1021/tx4004352. Epub 2014 Feb 25.

DNA adductomics

Affiliations
Review

DNA adductomics

Silvia Balbo et al. Chem Res Toxicol. .

Abstract

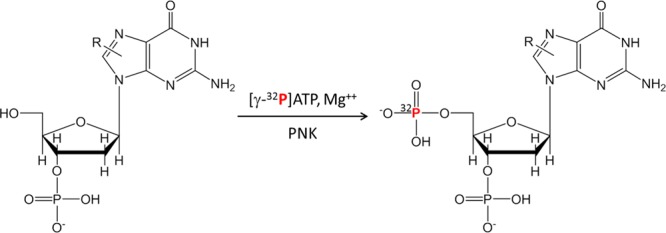
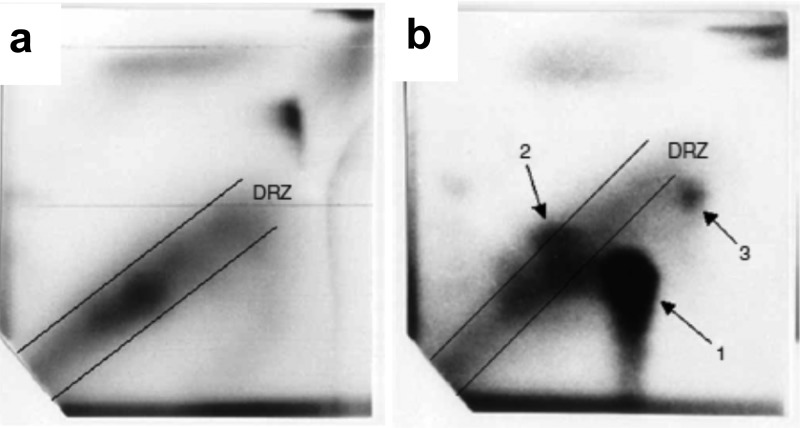
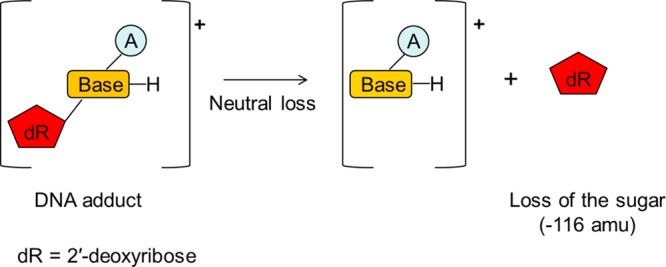
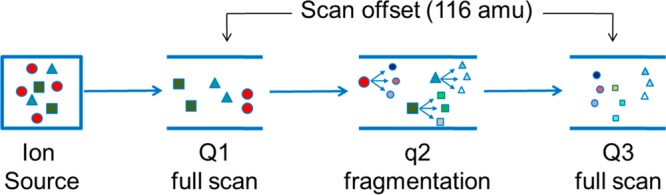
Systems toxicology is a broad-based approach to describe many of the toxicological features that occur within a living system under stress or subjected to exogenous or endogenous exposures. The ultimate goal is to capture an overview of all exposures and the ensuing biological responses of the body. The term exposome has been employed to refer to the totality of all exposures, and systems toxicology investigates how the exposome influences health effects and consequences of exposures over a lifetime. The tools to advance systems toxicology include high-throughput transcriptomics, proteomics, metabolomics, and adductomics, which is still in its infancy. A well-established methodology for the comprehensive measurement of DNA damage resulting from every day exposures is not fully developed. During the past several decades, the (32)P-postlabeling technique has been employed to screen the damage to DNA induced by multiple classes of genotoxicants; however, more robust, specific, and quantitative methods have been sought to identify and quantify DNA adducts. Although triple quadrupole and ion trap mass spectrometry, particularly when using multistage scanning (LC-MS(n)), have shown promise in the field of DNA adductomics, it is anticipated that high-resolution and accurate-mass LC-MS(n) instrumentation will play a major role in assessing global DNA damage. Targeted adductomics should also benefit greatly from improved triple quadrupole technology. Once the analytical MS methods are fully mature, DNA adductomics along with other -omics tools will contribute greatly to the field of systems toxicology.


Figures

Figure 1
Figure 1
DNA is enzymatically digested to 3′ mononucleotides, and the postlabeling is then achieved by transfer of 32P-orthophosphate from [γ-32P]ATP to the 5′-OH position of the deoxyribonucleotide adduct. This reaction is mediated by polynucleotide kinase (PNK).
Figure 2
Figure 2
(a) Specimen obtained from a smoker in which a diagonal radioactive zone (DRZ) is present (the typical pattern of smoking-related DNA adducts). This analysis is from an autoradiogram of DNA adducts in lymphocytes from a smoker. (b) Autoradiogram of DNA adducts in renal tissue from a patient with aristolochic acid nephropathy using the 32P-postlabeling method. In spot 1, the adduct was identified by cochromatography with a synthesized standard as 7-(deoxyadenosine-N6-yl)-aristolactam I, in spot 2 as 7 (deoxyguanosine-N2-yl)-aristolactam I, and in spot 3 as 7-(deoxyadenosine-N6-yl)-aristolactam II. Adapted with permission from ref (63), copyright 2007, Macmillan Publishers Ltd.
Figure 3
Figure 3
2′-Deoxyribose is the sugar moiety present in all DNA adducts. Low-energy CAD spectra of structurally modified DNA nucleosides (A–B–dR, where B = nucleobase, A = modification, and dR = 2′-deoxyribose sugar) are dominated by the cleavage of the glycosidic bond and a neutral loss of dR (116 amu), leading to protonated nucleobase ions ([B–A] + H)+. Monitoring the neutral loss can be used for DNA adduct screening via LC–MSn methodologies.
Figure 4
Figure 4
Constant neutral loss scanning method using triple quadrupole instrumentation. Quadrupoles Q1 and Q3 scan in sync offset from each other by the user-defined mass difference (m/z = 116 amu). Voltage is applied to the collision cell (q2) filled with argon to induce fragmentation. Only ions that fragment with the specific neutral loss will pass through Q1, q2, and Q3 and be recorded as signal.
Figure 5
Figure 5
Data-dependent (DD) scanning method. Schematic representation of a DD–MS3 analysis. Repeated full-scan analysis is followed by fragmentation of the most abundant ions determined by the mass spectrometer software in real time throughout the entire chromatographic run based on the initial programming of the data-dependent method. The ions showing neutral loss of 116 amu (green) undergo additional fragmentation (MS3). The ion masses not showing neutral loss of 116 amu (red and blue) are put into an exclusion list so that they are no longer eligible for fragmentation for a predetermined length of time. To avoid repeated fragmentation of the most abundant ions, the method can be programmed such that masses of ions selected for fragmentation are also added to the exclusion list for a predetermined length of time. Adapted from ref (91). Copyright 2014 American Chemical Society.
Figure 6
Figure 6
Two adductome maps of putative DNA adducts detected in central (A) and peripheral (B) human lung tissue DNA from the same individual. The neutral loss of 2′-deoxyribose from positively ionized 2′-deoxynucleoside putative adducts was analyzed by LC/ESI-MS/MS in MRM mode transmitting the [M + H]+ → [M + H – 116]+ transition over a total of 374 transitions in the mass range from m/z 228.8 to 602.8. The graph plots the m/z of the observed putative adducts versus the retention time (tR). The adducts whose size is proportional to the signal intensity are represented with a circle. An active zone in which most of the putative adducts are observed is indicated by the box on the map. Attention is drawn to the presence of four putative adducts that were detected with relatively similar area response values in the active zone of the two lung DNA samples. These four unidentified putative adducts are designated in the adductome maps by letters a–d. The four putative adducts, (a) m/z 307.8, tR 11.46–11.48; (b) m/z 285.8, tR 11.48; (c) m/z 265.8, tR 13.36–13.40; and (d) m/z 283.8, tR 11.44–11.48, all possessed relatively similar area response values in lung tissue. Adapted from ref (74), copyright 2007, used with permission from Elsevier.
Figure 7
Figure 7
Example of a method used to screen for DNA adducts in human hepatocytes using data-dependent constant neutral loss–triple stage mass spectrometry performed on a linear quadrupole ion trap mass spectrometer. (A) Chromatograms obtained upon analysis of an untreated sample. (B) Chromatograms obtained upon analysis of a 4-ABP-treated sample; the [M + H – 116]+ ion, within the top 10 most abundant fragment ions in the MS/MS spectrum, triggers the acquisition of the MS3 spectrum, providing structural information on the detected DNA modifications. The full scan and MS/MS chromatograms are complex and show many features; however, the chromatogram displaying the ions that underwent a loss of 116 amu and the CNL-MS3 chromatogram are greatly simplified. Adapted from ref (71). Copyright 2009 American Chemical Society.

References

    1. Waters M. D.; Fostel J. M. (2004) Toxicogenomics and systems toxicology: Aims and prospects. Nat. Rev. Genet. 5, 936–948. - PubMed
    1. Heijne W. H.; Kienhuis A. S.; van Ommen B.; Stierum R. H.; Groten J. P. (2005) Systems toxicology: Applications of toxicogenomics, transcriptomics, proteomics and metabolomics in toxicology. Expert Rev. Proteomics 2, 767–780. - PubMed
    1. Craig A.; Sidaway J.; Holmes E.; Orton T.; Jackson D.; Rowlinson R.; Nickson J.; Tonge R.; Wilson I.; Nicholson J. (2006) Systems toxicology: integrated genomic, proteomic and metabonomic analysis of methapyrilene induced hepatotoxicity in the rat. J. Proteome Res. 5, 1586–1601. - PubMed
    1. Patti G. J.; Yanes O.; Siuzdak G. (2012) Innovation: Metabolomics: The apogee of the omics trilogy. Nat. Rev. Mol. Cell Biol. 13, 263–269. - PMC - PubMed
    1. Jones D. P.; Park Y.; Ziegler T. R. (2012) Nutritional metabolomics: Progress in addressing complexity in diet and health. Annu. Rev. Nutr. 32, 183–202. - PMC - PubMed

Publication types

LinkOut - more resources