

Economic evaluation of access to musculoskeletal care: the case of waiting for total knee arthroplasty
- PMID: 24438051
- PMCID: PMC3897923
- DOI: 10.1186/1471-2474-15-22
Economic evaluation of access to musculoskeletal care: the case of waiting for total knee arthroplasty
Abstract
Background: The projected demand for total knee arthroplasty is staggering. At its root, the solution involves increasing supply or decreasing demand. Other developed nations have used rationing and wait times to distribute this service. However, economic impact and cost-effectiveness of waiting for TKA is unknown.
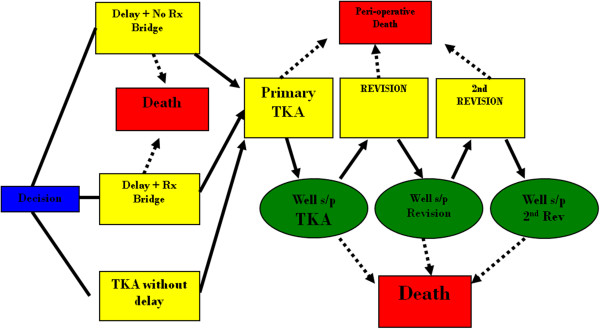
Methods: A Markov decision model was constructed for a cost-utility analysis of three treatment strategies for end-stage knee osteoarthritis: 1) TKA without delay, 2) a waiting period with no non-operative treatment and 3) a non-operative treatment bridge during that waiting period in a cohort of 60 year-old patients. Outcome probabilities and effectiveness were derived from the literature. Costs were estimated from the societal perspective with national average Medicare reimbursement. Effectiveness was expressed in quality-adjusted life years (QALYs) gained. Principal outcome measures were average incremental costs, effectiveness, and quality-adjusted life years; and net health benefits.
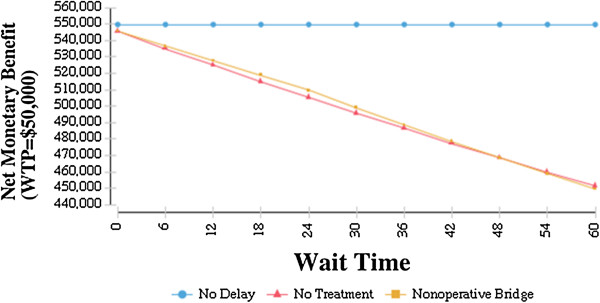
Results: In the base case, a 2-year wait-time both with and without a non-operative treatment bridge resulted in a lower number of average QALYs gained (11.57 (no bridge) and 11.95 (bridge) vs. 12.14 (no delay). The average cost was $1,660 higher for TKA without delay than wait-time with no bridge, but $1,810 less than wait-time with non-operative bridge. The incremental cost-effectiveness ratio comparing wait-time with no bridge to TKA without delay was $2,901/QALY. When comparing TKA without delay to waiting with non-operative bridge, TKA without delay produced greater utility at a lower cost to society.
Conclusions: TKA without delay is the preferred cost-effective treatment strategy when compared to a waiting for TKA without non-operative bridge. TKA without delay is cost saving when a non-operative bridge is used during the waiting period. As it is unlikely that patients waiting for TKA would not receive non-operative treatment, TKA without delay may be an overall cost-saving health care delivery strategy. Policies aimed at increasing the supply of TKA should be considered as savings exist that could indirectly fund those strategies.
Figures

Similar articles
-
Cost-Effectiveness of Total Knee Arthroplasty vs Nonoperative Management in Normal, Overweight, Obese, Severely Obese, Morbidly Obese, and Super-Obese Patients: A Markov Model.J Arthroplasty. 2018 Jul;33(7S):S32-S38. doi: 10.1016/j.arth.2018.02.031. Epub 2018 Feb 14. J Arthroplasty. 2018. PMID: 29550168
-
The Cost-Effectiveness of Platelet-Rich Plasma Injections for Knee Osteoarthritis: A Markov Decision Analysis.J Bone Joint Surg Am. 2020 Sep 16;102(18):e104. doi: 10.2106/JBJS.19.01446. J Bone Joint Surg Am. 2020. PMID: 32453118
-
The Cost-Effectiveness of Computer-Assisted Compared with Conventional Total Knee Arthroplasty: A Payer's Perspective.J Bone Joint Surg Am. 2024 Sep 18;106(18):1680-1687. doi: 10.2106/JBJS.23.00555. Epub 2024 Apr 25. J Bone Joint Surg Am. 2024. PMID: 38662805
-
Cost-effectiveness of total knee arthroplasty in the United States: patient risk and hospital volume.Arch Intern Med. 2009 Jun 22;169(12):1113-21; discussion 1121-2. doi: 10.1001/archinternmed.2009.136. Arch Intern Med. 2009. PMID: 19546411 Free PMC article. Review.
-
Cost-effectiveness of unicondylar versus total knee arthroplasty: a Markov model analysis.Knee. 2014;21 Suppl 1:S37-42. doi: 10.1016/S0968-0160(14)50008-7. Knee. 2014. PMID: 25382367 Review.
Cited by
-
The impact of delaying surgery during the COVID-19 pandemic in Alberta: a qualitative study.CMAJ Open. 2023 Jan 31;11(1):E90-E100. doi: 10.9778/cmajo.20210330. Print 2023 Jan-Feb. CMAJ Open. 2023. PMID: 36720492 Free PMC article.
-
How are we addressing ligament balance in TKA? A literature review of revision etiology and technological advancement.J Clin Orthop Trauma. 2016 Oct-Dec;7(4):248-255. doi: 10.1016/j.jcot.2016.04.001. Epub 2016 Aug 3. J Clin Orthop Trauma. 2016. PMID: 27857498 Free PMC article.
-
Improving pain, function and quality of life in end-stage knee osteoarthritis: a patient-preference cohort study on whole-body vibration and exercise as bridging therapies for total knee replacement.Arthroplasty. 2025 Mar 10;7(1):16. doi: 10.1186/s42836-025-00301-6. Arthroplasty. 2025. PMID: 40059198 Free PMC article.
-
Cost-effectiveness of surgical interventions for the management of osteoarthritis: a systematic review of the literature.BMC Musculoskelet Disord. 2017 May 10;18(1):183. doi: 10.1186/s12891-017-1540-2. BMC Musculoskelet Disord. 2017. PMID: 28486957 Free PMC article.
-
Chronic knee pain while awaiting arthroplasty is associated with worsening joint-specific function, health-related quality of life and personal wellbeing, and increased use of opioid analgesia.Bone Jt Open. 2025 Mar 1;6(3):237-245. doi: 10.1302/2633-1462.63.BJO-2024-0210.R1. Bone Jt Open. 2025. PMID: 40020709 Free PMC article.
References
-
- NIH Consensus Panel. NIH Consensus Statement on total knee replacement December 8-10, 2003. J Bone Joint Surg Am. 2004;86:1328–1335. - PubMed
-
- Farley FA, Weinstein JN, Aamoth GM, Shapiro MS, Jacobs J, McCarthy JC, Kramer J. Orthopaedic Workforce Taskforce to Board of Directors, American Academy of Orthopaedic Surgeons, 2005-2006. Workforce analysis in orthopaedic surgery: how can we improve the accuracy of our predictions? J Am Acad Orthop Surg. 2007;15:268–273. - PubMed
-
- Williams TE Jr, Satiani B, Thomas A, Ellison EC. The impending shortage and the estimated cost of training the future surgical workforce. Ann Surg. 2009;250:590–597. - PubMed
Publication types
MeSH terms
LinkOut - more resources
Full Text Sources
Other Literature Sources
Medical
Research Materials
