The transcriptome landscape of Prochlorococcus MED4 and the factors for stabilizing the core genome
- PMID: 24438106
- PMCID: PMC3898218
- DOI: 10.1186/1471-2180-14-11
The transcriptome landscape of Prochlorococcus MED4 and the factors for stabilizing the core genome
Abstract
Background: Gene gain and loss frequently occurs in the cyanobacterium Prochlorococcus, a phototroph that numerically dominates tropical and subtropical open oceans. However, little is known about the stabilization of its core genome, which contains approximately 1250 genes, in the context of genome streamlining. Using Prochlorococcus MED4 as a model organism, we investigated the constraints on core genome stabilization using transcriptome profiling.
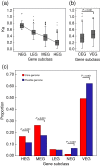
Results: RNA-Seq technique was used to obtain the transcriptome map of Prochlorococcus MED4, including operons, untranslated regions, non-coding RNAs, and novel genes. Genome-wide expression profiles revealed that three factors contribute to core genome stabilization. First, a negative correlation between gene expression levels and protein evolutionary rates was observed. Highly expressed genes were overrepresented in the core genome but not in the flexible genome. Gene necessity was determined as a second powerful constraint on genome evolution through functional enrichment analysis. Third, quick mRNA turnover may increase corresponding proteins' fidelity among genes that were abundantly expressed. Together, these factors influence core genome stabilization during MED4 genome evolution.
Conclusions: Gene expression, gene necessity, and mRNA turnover contribute to core genome maintenance during cyanobacterium Prochlorococcus genus evolution.
Figures


Similar articles
-
Patterns and implications of gene gain and loss in the evolution of Prochlorococcus.PLoS Genet. 2007 Dec;3(12):e231. doi: 10.1371/journal.pgen.0030231. PLoS Genet. 2007. PMID: 18159947 Free PMC article.
-
Accelerated evolution associated with genome reduction in a free-living prokaryote.Genome Biol. 2005;6(2):R14. doi: 10.1186/gb-2005-6-2-r14. Epub 2005 Jan 14. Genome Biol. 2005. PMID: 15693943 Free PMC article.
-
Sequence analysis of a complete 1.66 Mb Prochlorococcus marinus MED4 genome cloned in yeast.Nucleic Acids Res. 2012 Nov 1;40(20):10375-83. doi: 10.1093/nar/gks823. Epub 2012 Aug 31. Nucleic Acids Res. 2012. PMID: 22941652 Free PMC article.
-
A minimum set of regulators to thrive in the ocean.FEMS Microbiol Rev. 2020 Mar 1;44(2):232-252. doi: 10.1093/femsre/fuaa005. FEMS Microbiol Rev. 2020. PMID: 32077939 Review.
-
Prochlorococcus: advantages and limits of minimalism.Ann Rev Mar Sci. 2010;2:305-31. doi: 10.1146/annurev-marine-120308-081034. Ann Rev Mar Sci. 2010. PMID: 21141667 Review.
Cited by
-
Adaptive Evolution of Phosphorus Metabolism in Prochlorococcus.mSystems. 2016 Nov 15;1(6):e00065-16. doi: 10.1128/mSystems.00065-16. eCollection 2016 Nov-Dec. mSystems. 2016. PMID: 27868089 Free PMC article.
-
The Chthonomonas calidirosea Genome Is Highly Conserved across Geographic Locations and Distinct Chemical and Microbial Environments in New Zealand's Taupō Volcanic Zone.Appl Environ Microbiol. 2016 May 31;82(12):3572-81. doi: 10.1128/AEM.00139-16. Print 2016 Jun 15. Appl Environ Microbiol. 2016. PMID: 27060125 Free PMC article.
-
Adaptation of an abundant Roseobacter RCA organism to pelagic systems revealed by genomic and transcriptomic analyses.ISME J. 2015 Feb;9(2):371-84. doi: 10.1038/ismej.2014.134. Epub 2014 Aug 1. ISME J. 2015. PMID: 25083934 Free PMC article.
References
-
- Chisholm SW, Olson RJ, Zettler ER, Goericke R, Waterbury JB, Welschmeyer NA. A novel free-living prochlorophyte abundant in the oceanic euphotic zone. Nature. 1988;334:340–343. doi: 10.1038/334340a0. - DOI
Publication types
MeSH terms
LinkOut - more resources
Full Text Sources
Other Literature Sources
Molecular Biology Databases

