

Steroid receptor coactivator 1 is an integrator of glucose and NAD+/NADH homeostasis
- PMID: 24438340
- PMCID: PMC3938540
- DOI: 10.1210/me.2013-1404
Steroid receptor coactivator 1 is an integrator of glucose and NAD+/NADH homeostasis
Abstract
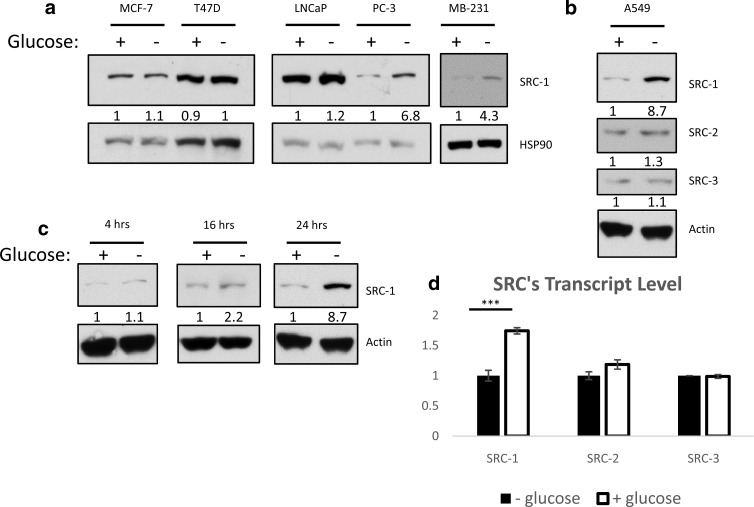
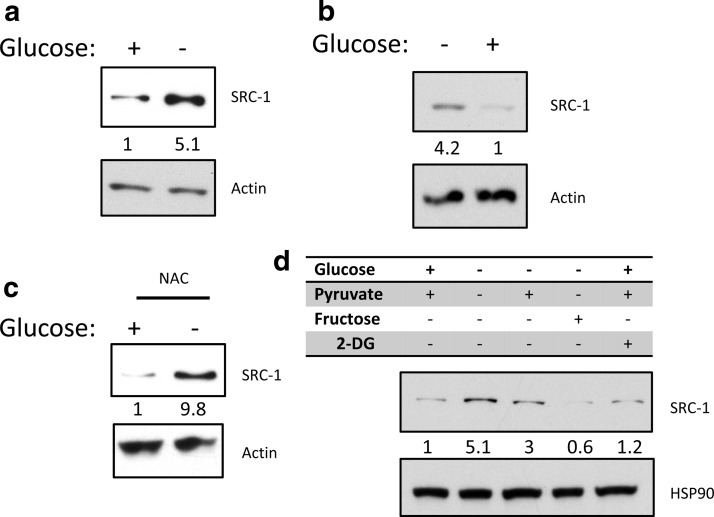
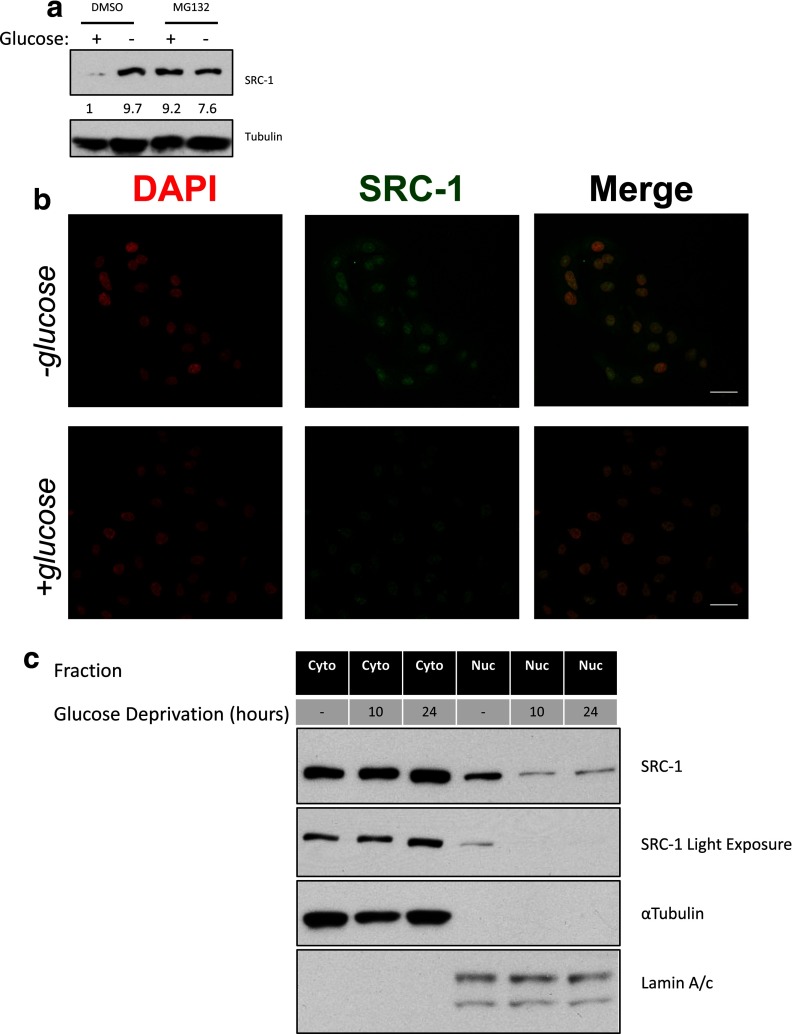
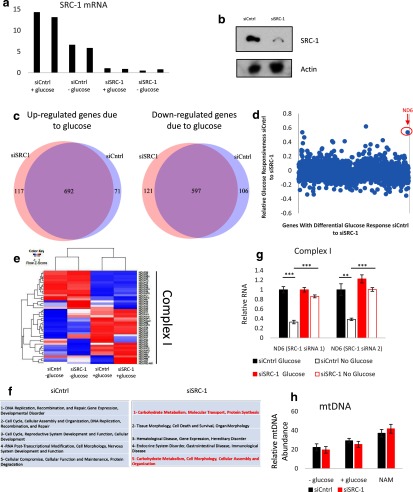
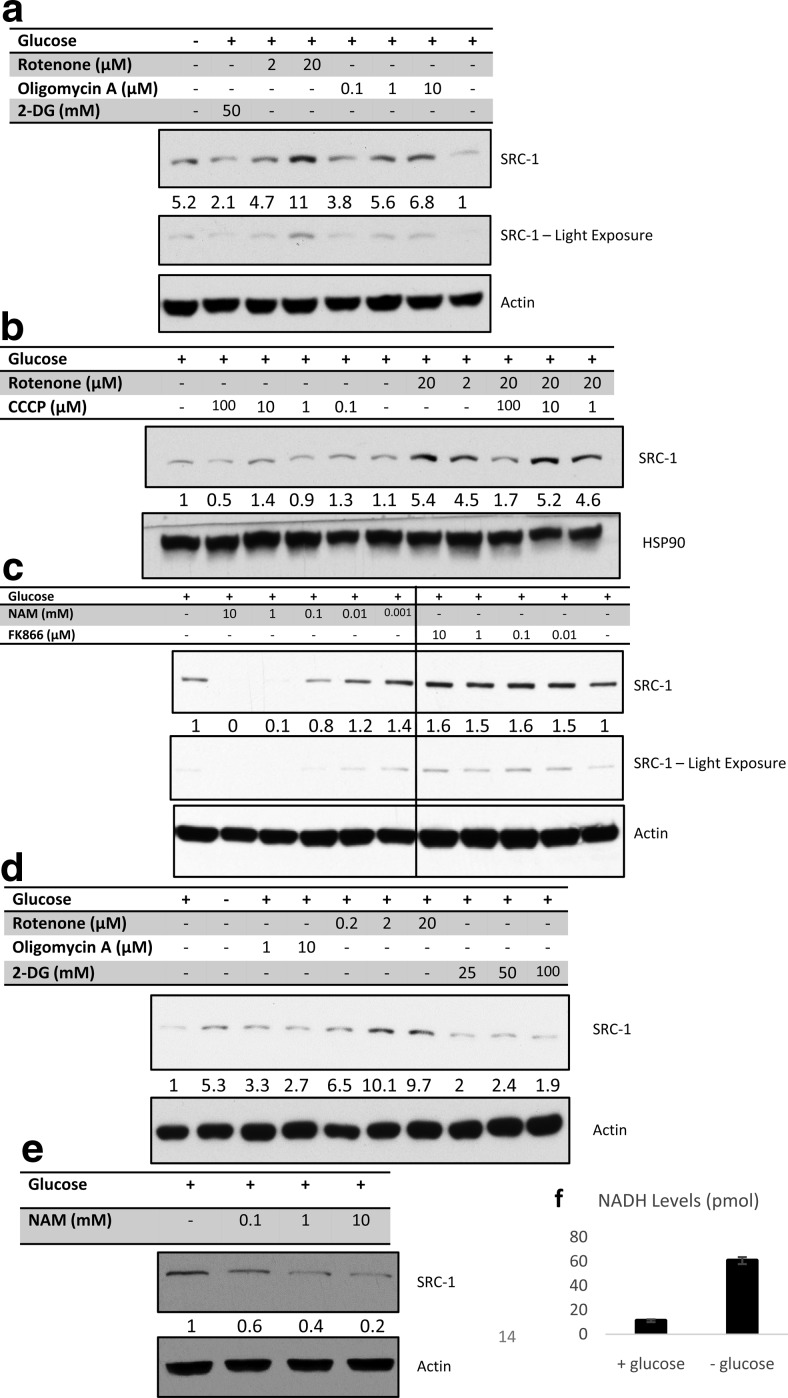
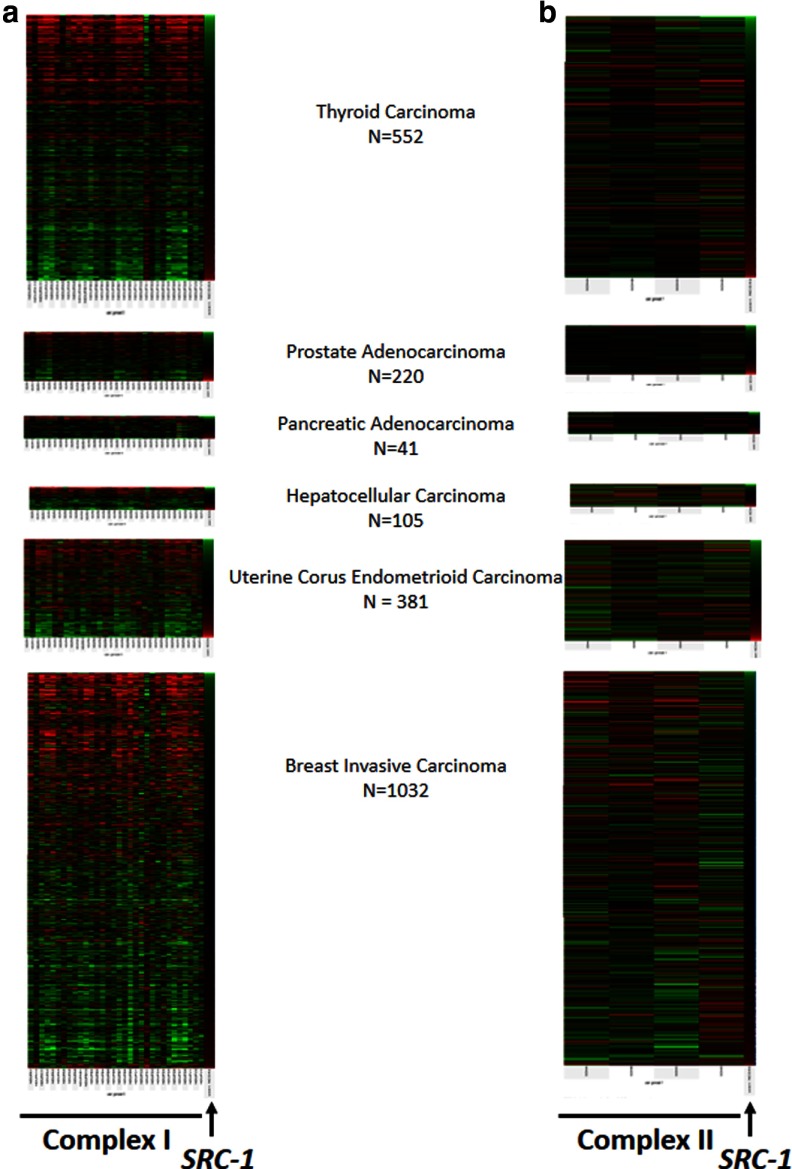
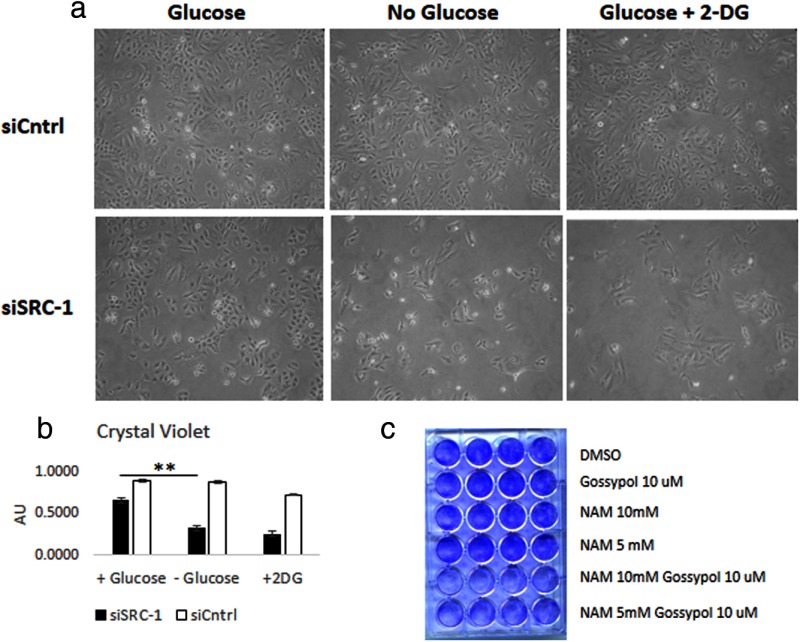
Steroid receptor coactivator 1 (SRC-1) drives diverse gene expression programs necessary for the dynamic regulation of cancer metastasis, inflammation and gluconeogenesis, pointing to its overlapping roles as an oncoprotein and integrator of cell metabolic programs. Nutrient utilization has been intensely studied with regard to cellular adaptation in both cancer and noncancerous cells. Nonproliferating cells consume glucose through the citric acid cycle to generate NADH to fuel ATP generation via mitochondrial oxidative phosphorylation. In contrast, cancer cells undergo metabolic reprogramming to support rapid proliferation. To generate lipids, nucleotides, and proteins necessary for cell division, most tumors switch from oxidative phosphorylation to glycolysis, a phenomenon known as the Warburg Effect. Because SRC-1 is a key coactivator responsible for driving a hepatic gluconeogenic program under fasting conditions, we asked whether SRC-1 responds to alterations in nutrient availability to allow for adaptive metabolism. Here we show SRC-1 is stabilized by the 26S proteasome in the absence of glucose. RNA profiling was used to examine the effects of SRC-1 perturbation on gene expression in the absence or presence of glucose, revealing that SRC-1 affects the expression of complex I of the mitochondrial electron transport chain, a set of enzymes responsible for the conversion of NADH to NAD(+). NAD(+) and NADH were subsequently identified as metabolites that underlie SRC-1's response to glucose deprivation. Knockdown of SRC-1 in glycolytic cancer cells abrogated their ability to grow in the absence of glucose consistent with SRC-1's role in promoting cellular adaptation to reduced glucose availability.
Figures
Similar articles
-
Banting Lecture 1995. A lesson in metabolic regulation inspired by the glucokinase glucose sensor paradigm.Diabetes. 1996 Feb;45(2):223-41. doi: 10.2337/diab.45.2.223. Diabetes. 1996. PMID: 8549869 Review.
-
Inhibition of mitochondrial complex I improves glucose metabolism independently of AMPK activation.J Cell Mol Med. 2018 Feb;22(2):1316-1328. doi: 10.1111/jcmm.13432. Epub 2017 Nov 6. J Cell Mol Med. 2018. PMID: 29106036 Free PMC article.
-
Steroid receptor coactivator-3 regulates glucose metabolism in bladder cancer cells through coactivation of hypoxia inducible factor 1α.J Biol Chem. 2014 Apr 18;289(16):11219-11229. doi: 10.1074/jbc.M113.535989. Epub 2014 Feb 28. J Biol Chem. 2014. PMID: 24584933 Free PMC article. Clinical Trial.
-
Hydrophobic Tagging-Mediated Degradation of Transcription Coactivator SRC-1.Int J Mol Sci. 2021 Jun 15;22(12):6407. doi: 10.3390/ijms22126407. Int J Mol Sci. 2021. PMID: 34203850 Free PMC article.
-
Follow the ATP: tumor energy production: a perspective.Anticancer Agents Med Chem. 2014;14(9):1187-98. doi: 10.2174/1871520614666140804224637. Anticancer Agents Med Chem. 2014. PMID: 25102360 Review.
Cited by
-
miR-137 Targets p160 Steroid Receptor Coactivators SRC1, SRC2, and SRC3 and Inhibits Cell Proliferation.Mol Endocrinol. 2015 Aug;29(8):1170-83. doi: 10.1210/me.2015-1080. Epub 2015 Jun 12. Mol Endocrinol. 2015. PMID: 26066330 Free PMC article.
-
Steroid receptor coactivators: servants and masters for control of systems metabolism.Trends Endocrinol Metab. 2014 Jul;25(7):337-47. doi: 10.1016/j.tem.2014.05.004. Epub 2014 Jun 19. Trends Endocrinol Metab. 2014. PMID: 24953190 Free PMC article. Review.
-
Tubulin mRNA stability is sensitive to change in microtubule dynamics caused by multiple physiological and toxic cues.PLoS Biol. 2019 Apr 9;17(4):e3000225. doi: 10.1371/journal.pbio.3000225. eCollection 2019 Apr. PLoS Biol. 2019. PMID: 30964857 Free PMC article.
-
NCOA1 promotes angiogenesis in breast tumors by simultaneously enhancing both HIF1α- and AP-1-mediated VEGFa transcription.Oncotarget. 2015 Sep 15;6(27):23890-904. doi: 10.18632/oncotarget.4341. Oncotarget. 2015. PMID: 26287601 Free PMC article.
-
Function of Steroid Receptor Coactivators in T Cells and Cancers: Implications for Cancer Immunotherapy.Crit Rev Immunol. 2024;44(6):111-126. doi: 10.1615/CritRevImmunol.2024051613. Crit Rev Immunol. 2024. PMID: 38848298 Free PMC article. Review.
References
-
- Cairns RA, Harris IS, Mak TW. Regulation of cancer cell metabolism. Nat Rev Cancer. 2011;11(2):85–95 - PubMed
-
- Cairns RA, Harris I, McCracken S, Mak TW. Cancer cell metabolism. Cold Spring Harb Symp Quant Biol. 2011;76:299–311 - PubMed
-
- O'Malley BW. Masters of the genome. Nat Rev Mol Cell Biol. 2010;11(5):311. - PubMed
Publication types
MeSH terms
Substances
Grants and funding
- HD07857/HD/NICHD NIH HHS/United States
- P30-DK079638/DK/NIDDK NIH HHS/United States
- P01 DK059820/DK/NIDDK NIH HHS/United States
- R01 HD008188/HD/NICHD NIH HHS/United States
- P30 CA125123/CA/NCI NIH HHS/United States
- P30 DK079638/DK/NIDDK NIH HHS/United States
- K01 DK096093/DK/NIDDK NIH HHS/United States
- 1K01DK096093/DK/NIDDK NIH HHS/United States
- HD08188/HD/NICHD NIH HHS/United States
- R01 HD007857/HD/NICHD NIH HHS/United States
- P30CA125123/CA/NCI NIH HHS/United States
- DK59820/DK/NIDDK NIH HHS/United States
- F32 HD008188/HD/NICHD NIH HHS/United States
LinkOut - more resources
Full Text Sources
Other Literature Sources
Molecular Biology Databases
Miscellaneous
