

Faster evolving Drosophila paralogs lose expression rate and ubiquity and accumulate more non-synonymous SNPs
- PMID: 24438455
- PMCID: PMC3906896
- DOI: 10.1186/1745-6150-9-2
Faster evolving Drosophila paralogs lose expression rate and ubiquity and accumulate more non-synonymous SNPs
Abstract
Background: Duplicated genes can indefinately persist in genomes if either both copies retain the original function due to dosage benefit (gene conservation), or one of the copies assumes a novel function (neofunctionalization), or both copies become required to perform the function previously accomplished by a single copy (subfunctionalization), or through a combination of these mechanisms. Different models of duplication retention imply different predictions about substitution rates in the coding portion of paralogs and about asymmetry of these rates.
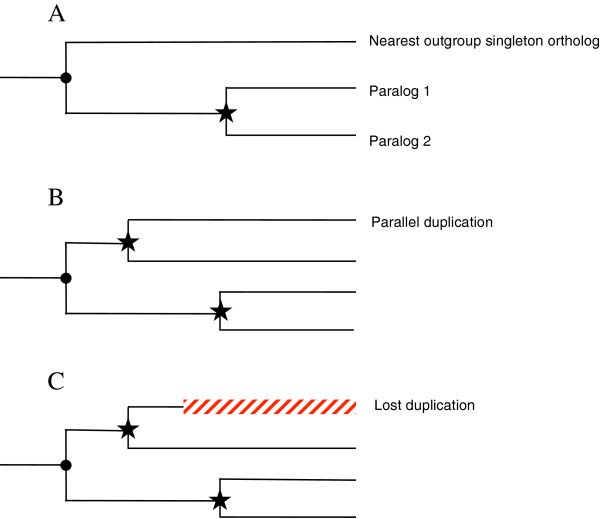
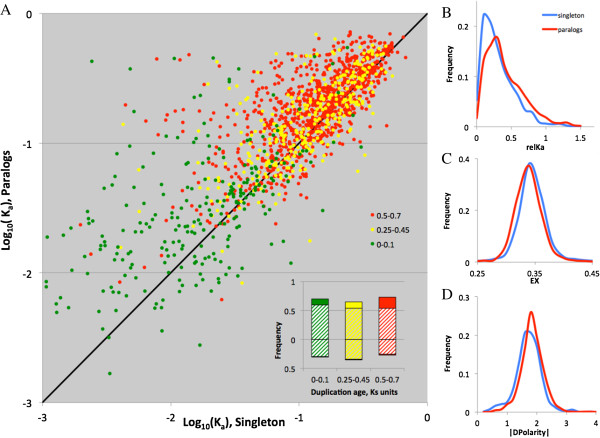
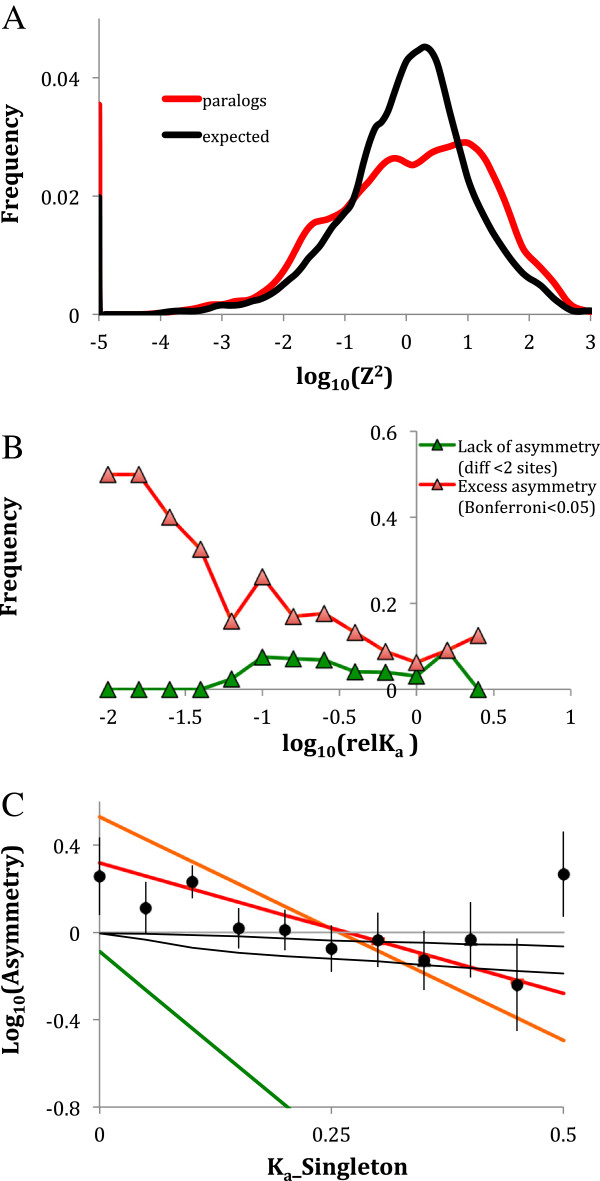
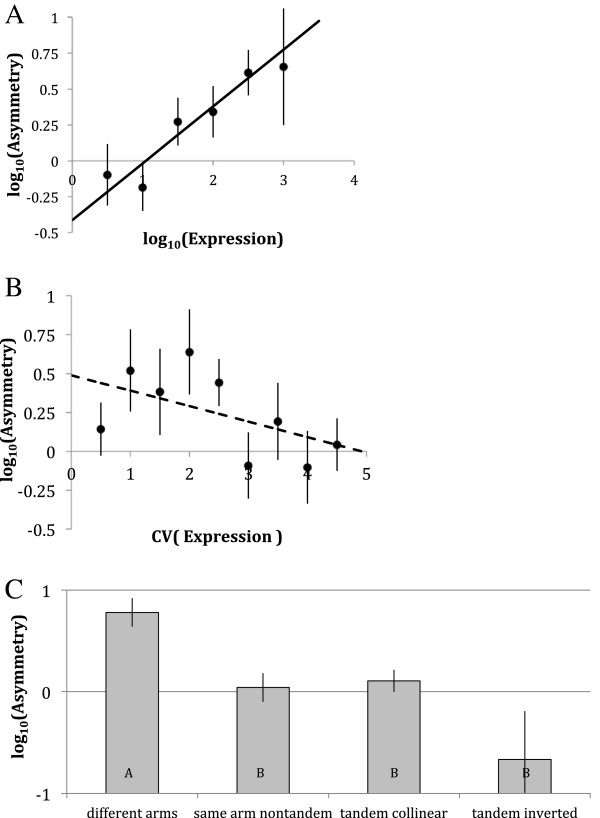
Results: We analyse sequence evolution asymmetry in paralogs present in 12 Drosophila genomes using the nearest non-duplicated orthologous outgroup as a reference. Those paralogs present in D. melanogaster are analysed in conjunction with the asymmetry of expression rate and ubiquity and of segregating non-synonymous polymorphisms in the same paralogs. Paralogs accumulate substitutions, on average, faster than their nearest singleton orthologs. The distribution of paralogs' substitution rate asymmetry is overdispersed relative to that of orthologous clades, containing disproportionally more unusually symmetric and unusually asymmetric clades. We show that paralogs are more asymmetric in: a) clades orthologous to highly constrained singleton genes; b) genes with high expression level; c) genes with ubiquitous expression and d) non-tandem duplications. We further demonstrate that, in each asymmetrically evolving pair of paralogs, the faster evolving member of the pair tends to have lower average expression rate, lower expression uniformity and higher frequency of non-synonymous SNPs than its slower evolving counterpart.
Conclusions: Our findings are consistent with the hypothesis that many duplications in Drosophila are retained despite stabilising selection being more relaxed in one of the paralogs than in the other, suggesting a widespread unfinished pseudogenization. This phenomenon is likely to make detection of neo- and subfunctionalization signatures difficult, as these models of duplication retention also predict asymmetries in substitution rates and expression profiles.
Figures

Similar articles
-
Evolutionary patterns of amino acid substitutions in 12 Drosophila genomes.BMC Genomics. 2010 Dec 2;11 Suppl 4(Suppl 4):S10. doi: 10.1186/1471-2164-11-S4-S10. BMC Genomics. 2010. PMID: 21143793 Free PMC article.
-
Multiple mechanisms promote the retained expression of gene duplicates in the tetraploid frog Xenopus laevis.PLoS Genet. 2006 Apr;2(4):e56. doi: 10.1371/journal.pgen.0020056. Epub 2006 Apr 28. PLoS Genet. 2006. PMID: 16683033 Free PMC article.
-
Molecular evolution of duplicated ray finned fish HoxA clusters: increased synonymous substitution rate and asymmetrical co-divergence of coding and non-coding sequences.J Mol Evol. 2005 May;60(5):665-76. doi: 10.1007/s00239-004-0252-z. J Mol Evol. 2005. PMID: 15983874
-
Rapidly evolving Rab GTPase paralogs and reproductive isolation in Drosophila.Adv Genet. 2007;58:1-23. doi: 10.1016/S0065-2660(06)58001-0. Adv Genet. 2007. PMID: 17452244 Review.
-
Problems with Paralogs: The Promise and Challenges of Gene Duplicates in Evo-Devo Research.Integr Comp Biol. 2024 Sep 17;64(2):556-564. doi: 10.1093/icb/icae009. Integr Comp Biol. 2024. PMID: 38565319 Free PMC article. Review.
Cited by
-
Long-term asymmetrical acceleration of protein evolution after gene duplication.Genome Biol Evol. 2014 Jul 28;6(8):1949-55. doi: 10.1093/gbe/evu159. Genome Biol Evol. 2014. PMID: 25070510 Free PMC article.
-
Small Segmental Duplications in Drosophila-High Rate of Emergence and Elimination.Genome Biol Evol. 2019 Feb 1;11(2):486-496. doi: 10.1093/gbe/evz011. Genome Biol Evol. 2019. PMID: 30689862 Free PMC article.
-
Net Evolutionary Loss of Residue Polarity in Drosophilid Protein Cores Indicates Ongoing Optimization of Amino Acid Composition.Genome Biol Evol. 2017 Oct 1;9(10):2879-2892. doi: 10.1093/gbe/evx191. Genome Biol Evol. 2017. PMID: 28985302 Free PMC article.
-
Evolutionary Comparison of Two Combinatorial Regulators of SBP-Box Genes, MiR156 and MiR529, in Plants.PLoS One. 2015 Apr 24;10(4):e0124621. doi: 10.1371/journal.pone.0124621. eCollection 2015. PLoS One. 2015. PMID: 25909360 Free PMC article.
-
Pax3/7 duplicated and diverged independently in amphioxus, the basal chordate lineage.Sci Rep. 2018 Jun 20;8(1):9414. doi: 10.1038/s41598-018-27700-x. Sci Rep. 2018. PMID: 29925900 Free PMC article.
References
-
- Ohno S. Evolution by gene duplication. New York: Springer-Verlag; 1970.
-
- Hughes AL. Adaptive Evolution of Genes and Genomes. New York, Oxford: Oxford University Press; 1999.
-
- Zhang J. Evolution by gene duplication: an update. Trends Ecol Evol. 2003;9(6):292–298. doi: 10.1016/S0169-5347(03)00033-8. - DOI
-
- Thornton J. In: Evolutionary Genetics. Fox CW, Wolf JB, editor. Oxford, New York: Oxford Univ. Press; 2006. New genes, new functions: gene family evolution and phylogenetics; pp. 157–172.
Publication types
MeSH terms
LinkOut - more resources
Full Text Sources
Other Literature Sources
Molecular Biology Databases
