

Increased vocal intensity due to the Lombard effect in speakers with Parkinson's disease: simultaneous laryngeal and respiratory strategies
- PMID: 24438910
- PMCID: PMC4300854
- DOI: 10.1016/j.jcomdis.2013.12.001
Increased vocal intensity due to the Lombard effect in speakers with Parkinson's disease: simultaneous laryngeal and respiratory strategies
Abstract
Purpose: The objective of the present study was to investigate whether speakers with hypophonia, secondary to Parkinson's disease (PD), would increases their vocal intensity when speaking in a noisy environment (Lombard effect). The other objective was to examine the underlying laryngeal and respiratory strategies used to increase vocal intensity.
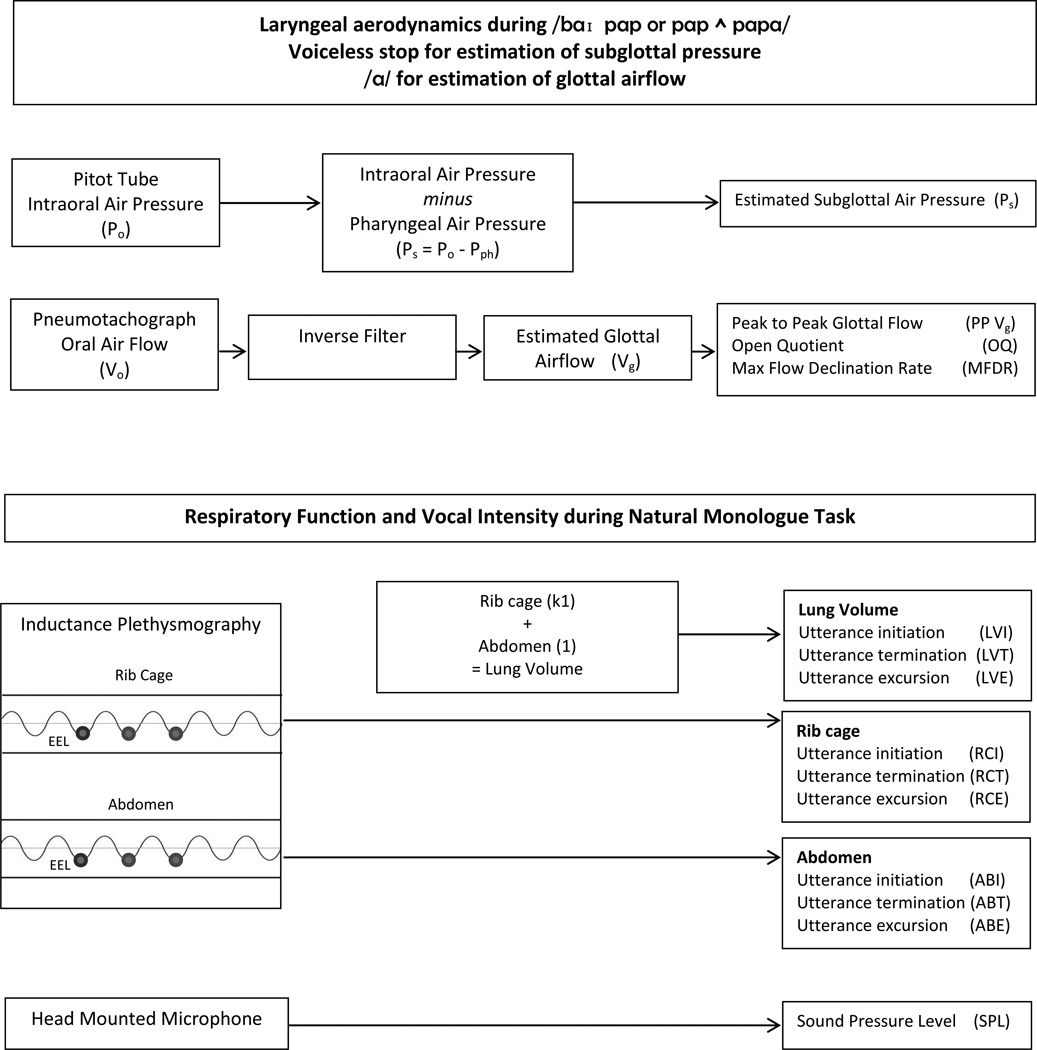
Methods: Thirty-three participants with PD were included for study. Each participant was fitted with the SpeechVive™ device that played multi-talker babble noise into one ear during speech. Using acoustic, aerodynamic and respiratory kinematic techniques, the simultaneous laryngeal and respiratory mechanisms used to regulate vocal intensity were examined.
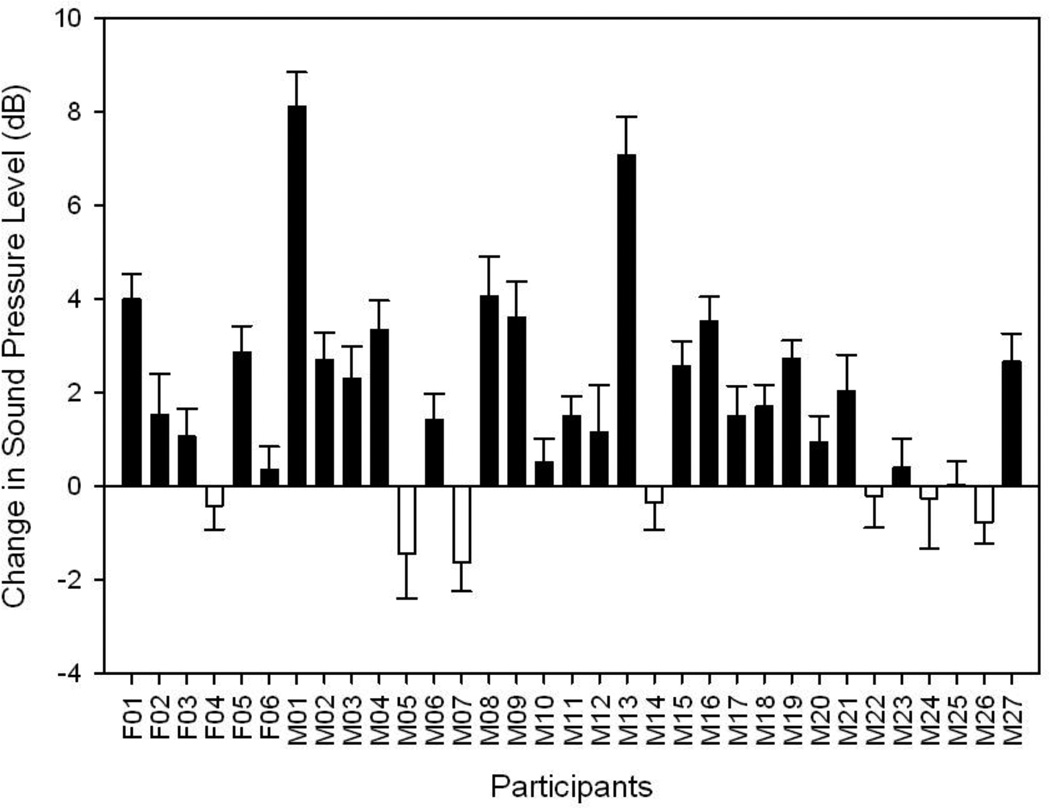
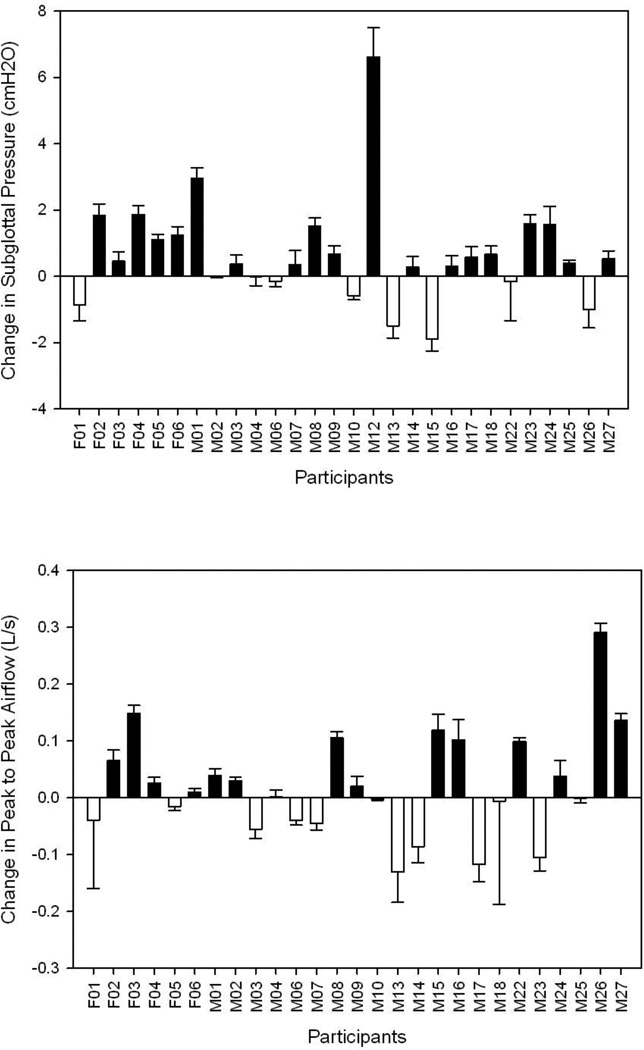
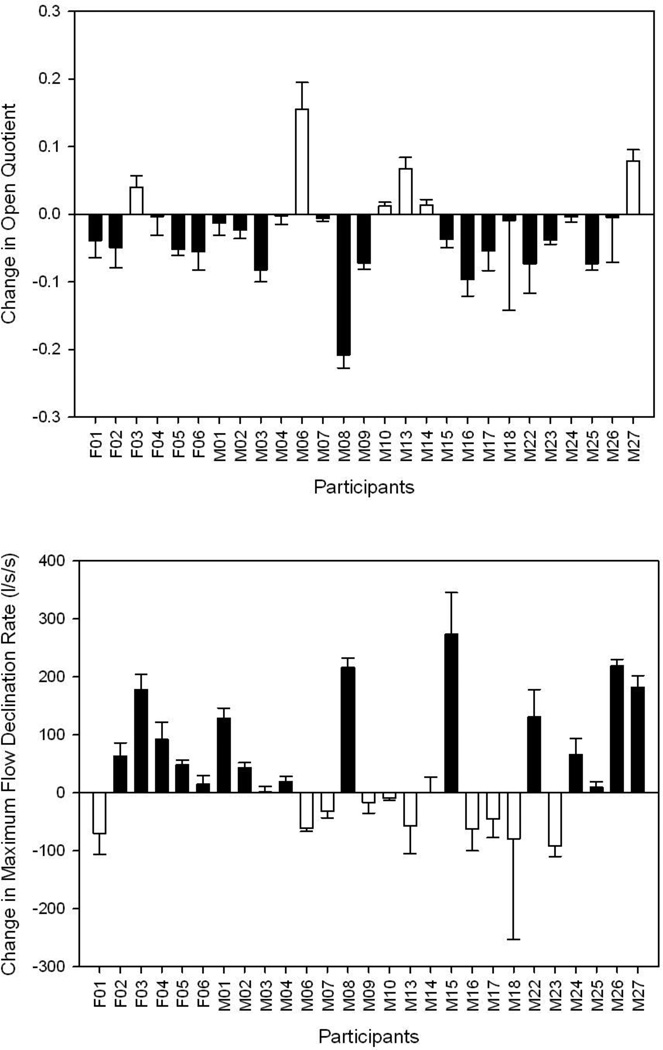
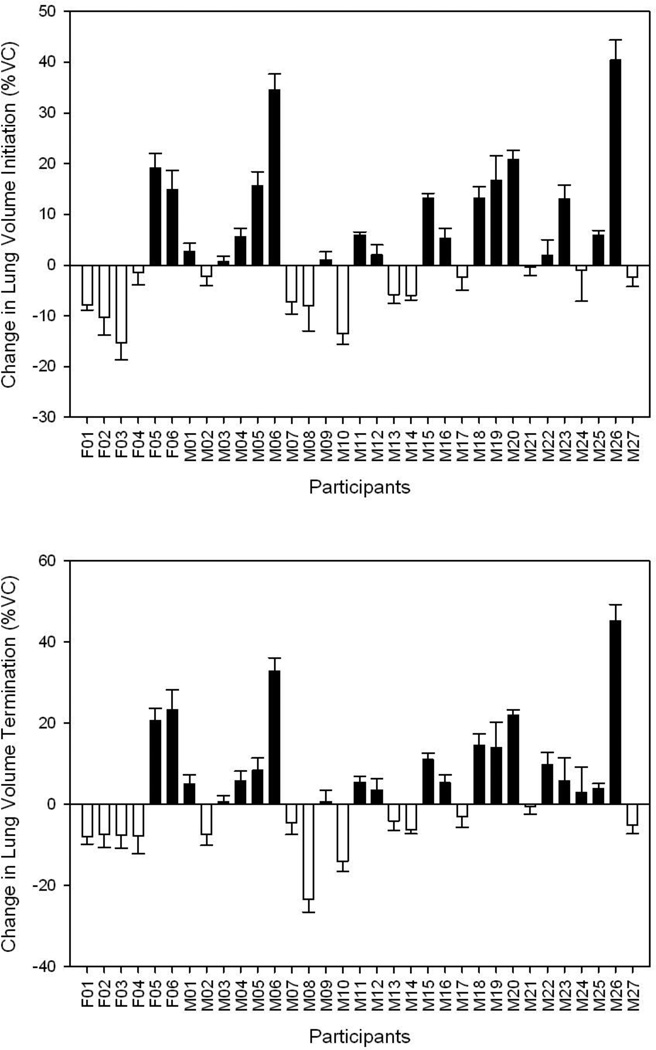
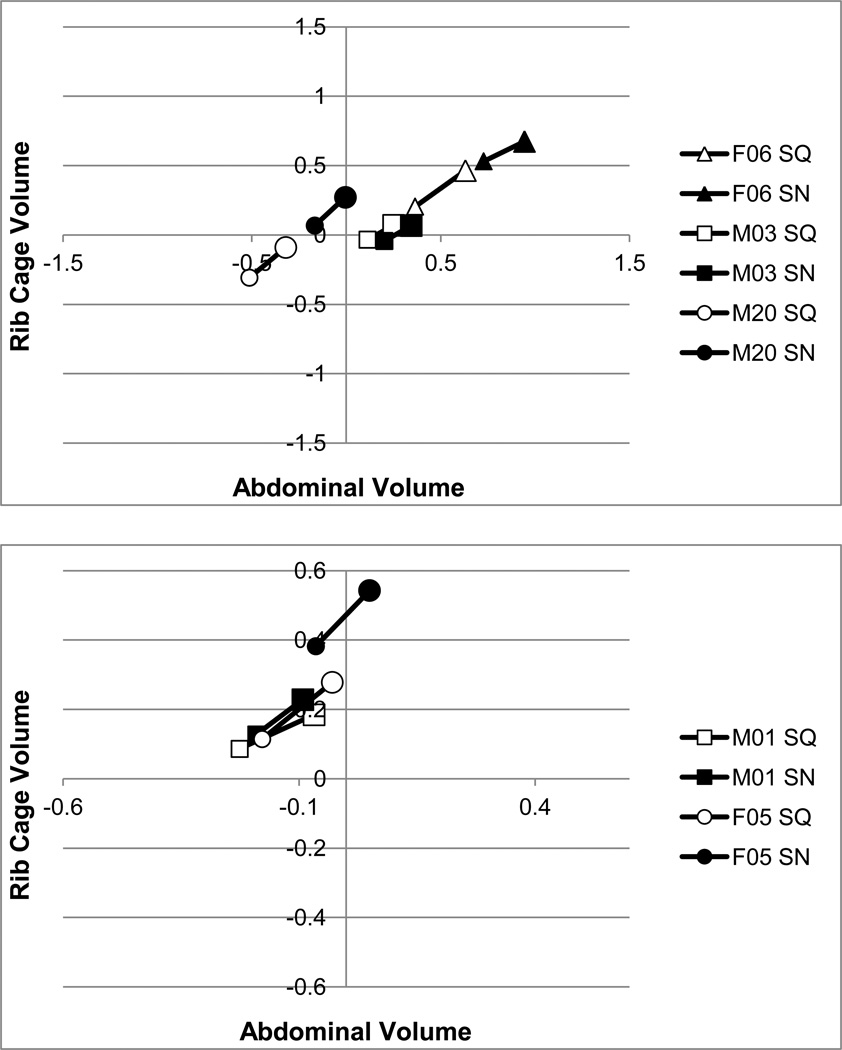
Results: Significant group results showed that most speakers with PD (26/33) were successful at increasing their vocal intensity when speaking in the condition of multi-talker babble noise. They were able to support their increased vocal intensity and subglottal pressure with combined strategies from both the laryngeal and respiratory mechanisms. Individual speaker analysis indicated that the particular laryngeal and respiratory interactions differed among speakers.
Conclusions: The SpeechVive™ device elicited higher vocal intensities from patients with PD. Speakers used different combinations of laryngeal and respiratory physiologic mechanisms to increase vocal intensity, thus suggesting that disease process does not uniformly affect the speech subsystems.
Learning outcomes: Readers will be able to: (1) identify speech characteristics of people with Parkinson's disease (PD), (2) identify typical respiratory strategies for increasing sound pressure level (SPL), (3) identify typical laryngeal strategies for increasing SPL, (4) define the Lombard effect.
Keywords: Laryngeal; Lombard effect; Parkinson's disease; Respiratory; Vocal intensity.
Copyright © 2014 Elsevier Inc. All rights reserved.
Figures
Similar articles
-
Laryngeal Aerodynamics in Healthy Older Adults and Adults With Parkinson's Disease.J Speech Lang Hear Res. 2017 Mar 1;60(3):507-524. doi: 10.1044/2016_JSLHR-S-14-0314. J Speech Lang Hear Res. 2017. PMID: 28241225 Free PMC article.
-
The effect of increased vocal intensity on interarticulator timing in speakers with Parkinson’s disease: a preliminary analysis.J Commun Disord. 2014 Nov-Dec;52:44-64. doi: 10.1016/j.jcomdis.2014.09.004. J Commun Disord. 2014. PMID: 25459460 Free PMC article.
-
The effects of a simulated fMRI environment on voice intensity in individuals with Parkinson's disease hypophonia and older healthy adults.J Commun Disord. 2021 Nov-Dec;94:106149. doi: 10.1016/j.jcomdis.2021.106149. Epub 2021 Aug 31. J Commun Disord. 2021. PMID: 34543846 Free PMC article.
-
Vocal tract characteristics in Parkinson's disease.Curr Opin Otolaryngol Head Neck Surg. 2016 Jun;24(3):175-82. doi: 10.1097/MOO.0000000000000252. Curr Opin Otolaryngol Head Neck Surg. 2016. PMID: 26900819 Review.
-
Speech treatment for Parkinson's disease.Expert Rev Neurother. 2008 Feb;8(2):297-309. doi: 10.1586/14737175.8.2.297. Expert Rev Neurother. 2008. PMID: 18271714 Review.
Cited by
-
Respiratory Responses to Two Voice Interventions for Parkinson's Disease.J Speech Lang Hear Res. 2022 Oct 17;65(10):3730-3748. doi: 10.1044/2022_JSLHR-22-00262. Epub 2022 Sep 27. J Speech Lang Hear Res. 2022. PMID: 36167066 Free PMC article.
-
Voice Therapy According to the Rehabilitation Treatment Specification System: Expert Consensus Ingredients and Targets.Am J Speech Lang Pathol. 2021 Sep 23;30(5):2169-2201. doi: 10.1044/2021_AJSLP-21-00076. Epub 2021 Aug 31. Am J Speech Lang Pathol. 2021. PMID: 34464550 Free PMC article.
-
Laryngeal Aerodynamics in Healthy Older Adults and Adults With Parkinson's Disease.J Speech Lang Hear Res. 2017 Mar 1;60(3):507-524. doi: 10.1044/2016_JSLHR-S-14-0314. J Speech Lang Hear Res. 2017. PMID: 28241225 Free PMC article.
-
Frameworks for Parkinson's Disease Rehabilitation Addressing When, What, and How.Curr Neurol Neurosci Rep. 2021 Feb 22;21(3):12. doi: 10.1007/s11910-021-01096-0. Curr Neurol Neurosci Rep. 2021. PMID: 33615420 Free PMC article. Review.
-
Listener Perception of Monopitch, Naturalness, and Intelligibility for Speakers With Parkinson's Disease.J Speech Lang Hear Res. 2015 Aug;58(4):1134-44. doi: 10.1044/2015_JSLHR-S-14-0243. J Speech Lang Hear Res. 2015. PMID: 26102242 Free PMC article.
References
-
- Adams SG, Lang AE. Can the Lombard effect be used to improve low voice intensity in Parkinson’s disease. European Journal of Disorders of Communication. 1992;27:121–127. - PubMed
-
- Baumgartner CA, Sapir S, Ramig LO. Voice quality changes following phonatory-respiratory effort treatment (LSVT) versus respiratory effort treatment for individuals with Parkinson disease. Journal of Voice. 2001;15(1):105–114. - PubMed
-
- Bogaard JM, Hovestadt A, Meerwaldt J, Meche FGA, Stigt J. Maximal expiratory and inspiratory flow-volume curves in Parkinson's disease. American Review of Respiratory Disease. 1989;139:610–614. - PubMed
-
- Bunton K. Patterns of lung volume use during an extemporaneous speech task in persons with Parkinson's disease. Journal of Communication Disorders. 2005;38:331–348. - PubMed
-
- Chadha TS, Watson H, Birch S, Jenouri GA, Schneider AW, Cohn MA, Sackner MA. Validation of respiratory inductive plethsmography using different calibration procedures. American Review of Respiratory Disease. 1982;125:644–649. - PubMed
Publication types
MeSH terms
Grants and funding
LinkOut - more resources
Full Text Sources
Other Literature Sources
Medical
