

Resting state electroencephalogram oscillatory abnormalities in schizophrenia and psychotic bipolar patients and their relatives from the bipolar and schizophrenia network on intermediate phenotypes study
- PMID: 24439302
- PMCID: PMC5045030
- DOI: 10.1016/j.biopsych.2013.12.008
Resting state electroencephalogram oscillatory abnormalities in schizophrenia and psychotic bipolar patients and their relatives from the bipolar and schizophrenia network on intermediate phenotypes study
Abstract
Background: Abnormal resting state electroencephalogram (EEG) oscillations are reported in schizophrenia (SZ) and bipolar disorder, illnesses with overlapping symptoms and genetic risk. However, less evidence exists on whether similar EEG spectral abnormalities are present in individuals with both disorders or whether these abnormalities are present in first-degree relatives, possibly representing genetic predisposition for these disorders.
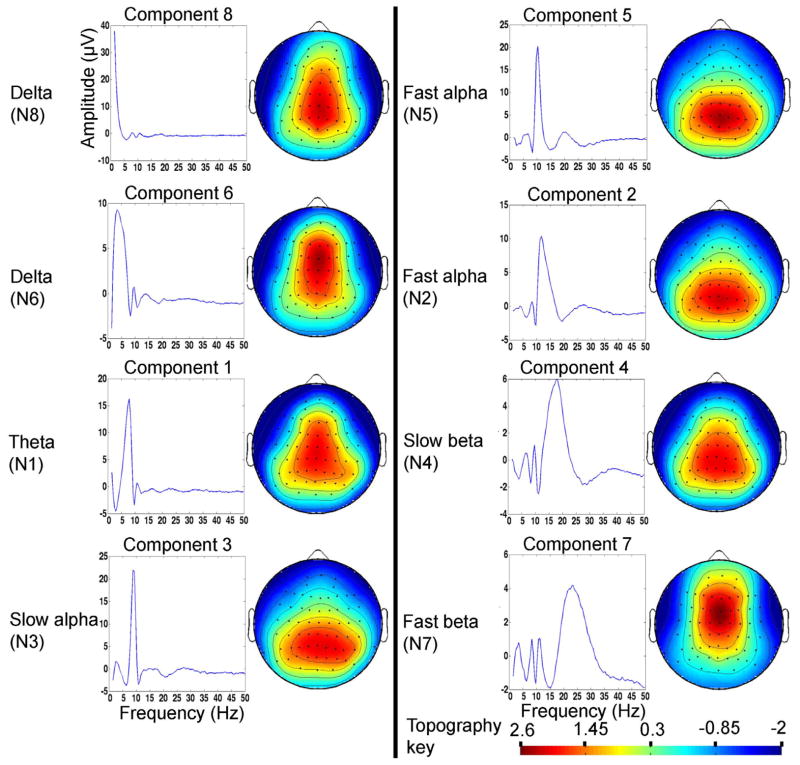
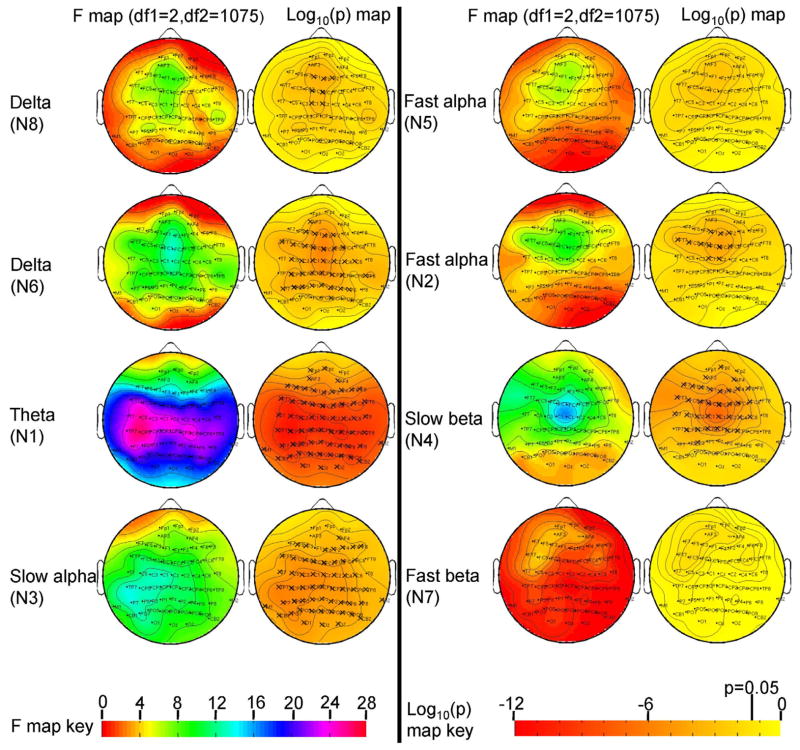
Methods: Investigators examined 64-channel resting state EEGs of 225 SZ probands and 201 first-degree relatives (SZR), 234 psychotic bipolar (PBP) probands and 231 first-degree relatives (PBPR), and 200 healthy control subjects. Eight independent resting state EEG spectral components and associated spatial weights were derived using group independent component analysis. Analysis of covariance was conducted on spatial weights to evaluate group differences. Relative risk estimates and familiality were evaluated on abnormal spectral profiles in probands and relatives.
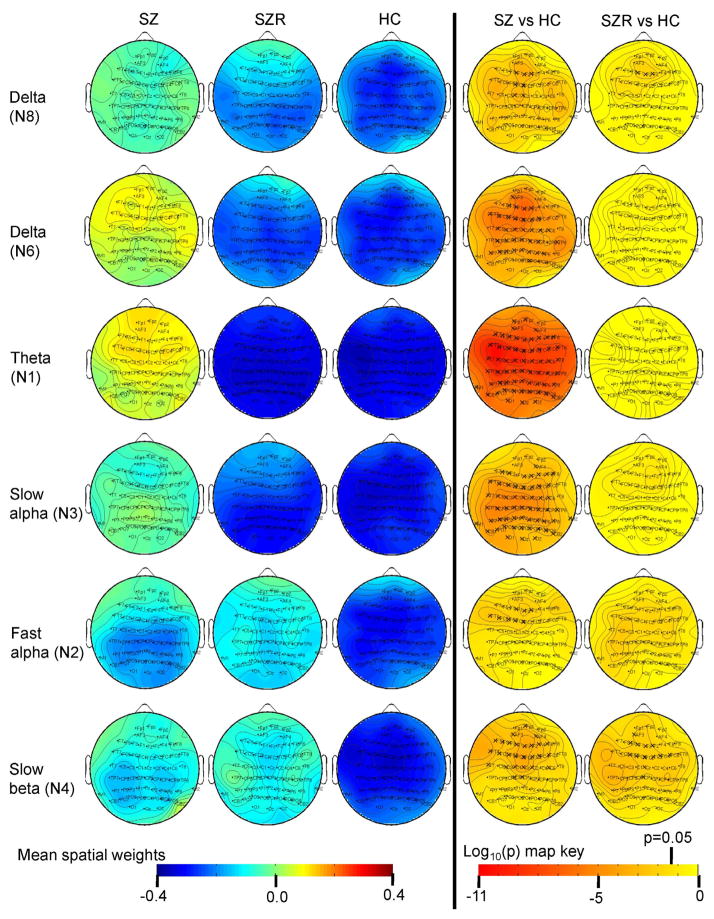
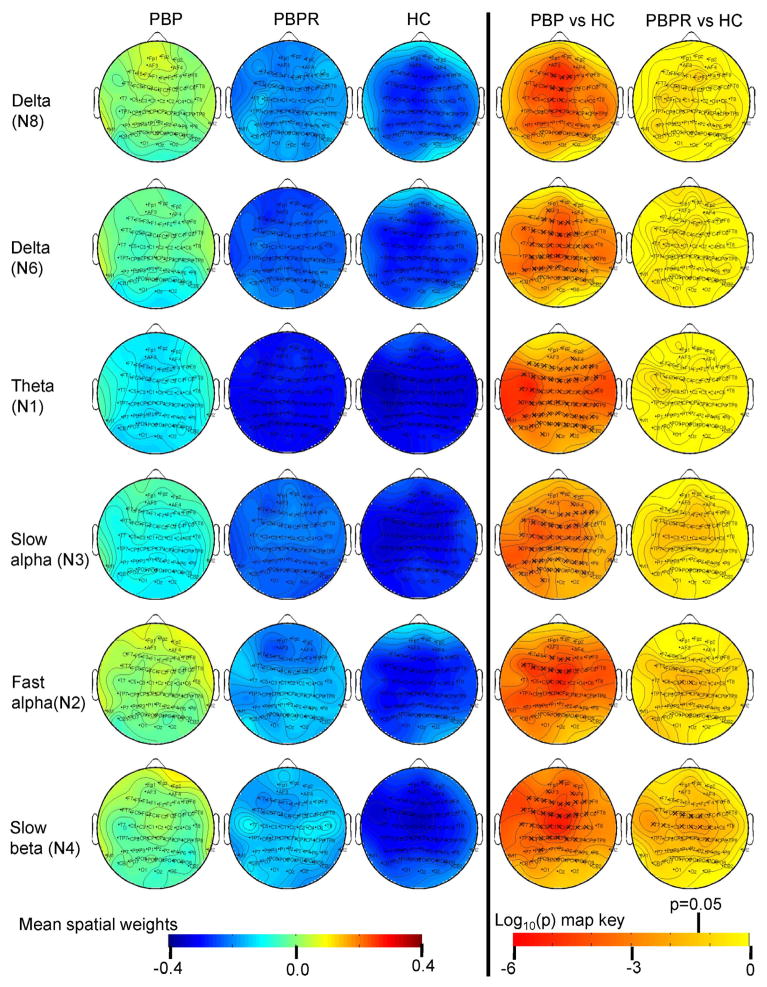
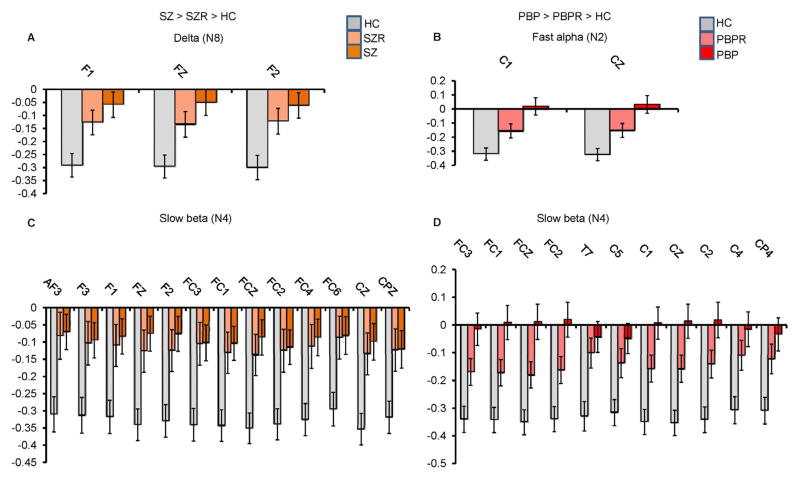
Results: Both SZ and PBP probands exhibited increased delta, theta, and slow and fast alpha activity. Post-hoc pair-wise comparison revealed increased frontocentral slow beta activity in SZ and PBP probands as well as SZR and PBPR. Augmented frontal delta activity was exhibited by SZ probands and SZR, whereas PBP probands and PBPR showed augmented fast alpha activity.
Conclusions: Both SZ and PBP probands demonstrated aberrant low-frequency activity. Slow beta activity was abnormal in SZ and PBP probands as well as SZR and PBPR perhaps indicating a common endophenotype for both disorders. Delta and fast alpha activity were unique endophenotypes for SZ and PBP probands, respectively. The EEG spectral activity exhibited moderate relative risk and heritability estimates, serving as intermediate phenotypes in future genetic studies for examining biological mechanisms underlying the pathogenesis of the two disorders.
Keywords: Bipolar disorder; EEG; intermediate phenotypes; psychosis; resting state; schizophrenia.
Copyright © 2014 Society of Biological Psychiatry. Published by Elsevier Inc. All rights reserved.
Conflict of interest statement
All other authors report no biomedical financial interests or potential conflicts of interest.
Figures
Comment in
-
Time to be spontaneous: a renaissance of intrinsic brain activity in psychosis research?Biol Psychiatry. 2014 Sep 15;76(6):434-5. doi: 10.1016/j.biopsych.2014.07.009. Biol Psychiatry. 2014. PMID: 25149349 No abstract available.
Similar articles
-
Multivariate genetic determinants of EEG oscillations in schizophrenia and psychotic bipolar disorder from the BSNIP study.Transl Psychiatry. 2015 Jun 23;5(6):e588. doi: 10.1038/tp.2015.76. Transl Psychiatry. 2015. PMID: 26101851 Free PMC article.
-
Frequency-Specific Neural Signatures of Spontaneous Low-Frequency Resting State Fluctuations in Psychosis: Evidence From Bipolar-Schizophrenia Network on Intermediate Phenotypes (B-SNIP) Consortium.Schizophr Bull. 2015 Nov;41(6):1336-48. doi: 10.1093/schbul/sbv064. Epub 2015 May 26. Schizophr Bull. 2015. PMID: 26012519 Free PMC article.
-
Joint Coupling of Awake EEG Frequency Activity and MRI Gray Matter Volumes in the Psychosis Dimension: A BSNIP Study.Front Psychiatry. 2015 Nov 9;6:162. doi: 10.3389/fpsyt.2015.00162. eCollection 2015. Front Psychiatry. 2015. PMID: 26617533 Free PMC article.
-
Neurophysiological endophenotypes across bipolar and schizophrenia psychosis.Schizophr Bull. 2008 Jul;34(4):760-73. doi: 10.1093/schbul/sbn049. Epub 2008 May 22. Schizophr Bull. 2008. PMID: 18502737 Free PMC article. Review.
-
Electroencephalographic delta/alpha frequency activity differentiates psychotic disorders: a study of schizophrenia, bipolar disorder and methamphetamine-induced psychotic disorder.Transl Psychiatry. 2018 Apr 12;8(1):75. doi: 10.1038/s41398-018-0105-y. Transl Psychiatry. 2018. PMID: 29643331 Free PMC article. Review.
Cited by
-
Effects of Ketamine on Resting-State EEG Activity and Their Relationship to Perceptual/Dissociative Symptoms in Healthy Humans.Front Pharmacol. 2016 Sep 27;7:348. doi: 10.3389/fphar.2016.00348. eCollection 2016. Front Pharmacol. 2016. PMID: 27729865 Free PMC article.
-
Emotion recognition deficits in schizophrenia-spectrum disorders and psychotic bipolar disorder: Findings from the Bipolar-Schizophrenia Network on Intermediate Phenotypes (B-SNIP) study.Schizophr Res. 2014 Sep;158(1-3):105-12. doi: 10.1016/j.schres.2014.07.001. Epub 2014 Jul 19. Schizophr Res. 2014. PMID: 25052782 Free PMC article.
-
Using multivariate endophenotypes to identify psychophysiological mechanisms associated with polygenic scores for substance use, schizophrenia, and education attainment.Psychol Med. 2021 Mar 18;52(16):1-11. doi: 10.1017/S0033291721000763. Online ahead of print. Psychol Med. 2021. PMID: 33731234 Free PMC article.
-
Alterations in hippocampal connectivity across the psychosis dimension.Psychiatry Res. 2015 Aug 30;233(2):148-57. doi: 10.1016/j.pscychresns.2015.06.004. Epub 2015 Jun 16. Psychiatry Res. 2015. PMID: 26123450 Free PMC article.
-
Anti-NMDA Receptor Encephalitis in a Patient with Previous Psychosis and Neurological Abnormalities: A Diagnostic Challenge.Case Rep Psychiatry. 2015;2015:253891. doi: 10.1155/2015/253891. Epub 2015 Jun 14. Case Rep Psychiatry. 2015. PMID: 26199781 Free PMC article.
References
-
- Bramon E, Sham PC. The common genetic liability between schizophrenia and bipolar disorder: a review. Curr Psychiatry Rep. 2001;3:332–337. - PubMed
-
- Carpenter WT, Bustillo JR, Thaker GK, van Os J, Krueger RF, Green MJ. The psychoses: cluster 3 of the proposed meta-structure for DSM-V and ICD-11. Psychol Med. 2009;39:2025–2042. - PubMed
Publication types
MeSH terms
Grants and funding
- P20 GM103472/GM/NIGMS NIH HHS/United States
- MH077862/MH/NIMH NIH HHS/United States
- MH077852/MH/NIMH NIH HHS/United States
- R01 MH077862/MH/NIMH NIH HHS/United States
- R01 EB005846/EB/NIBIB NIH HHS/United States
- MH078113/MH/NIMH NIH HHS/United States
- R01 EB006841/EB/NIBIB NIH HHS/United States
- MH077945/MH/NIMH NIH HHS/United States
- R01 MH077851/MH/NIMH NIH HHS/United States
- R01 MH078113/MH/NIMH NIH HHS/United States
- R01 MH096913/MH/NIMH NIH HHS/United States
- R01 MH077945/MH/NIMH NIH HHS/United States
- R01 EB020407/EB/NIBIB NIH HHS/United States
- R01 MH077852/MH/NIMH NIH HHS/United States
LinkOut - more resources
Full Text Sources
Other Literature Sources
Medical
Research Materials
Miscellaneous
