. 2014 Feb;21(2):151-61.
doi: 10.1016/j.acra.2013.10.009.

Blood flow reduction in breast tissue due to mammographic compression

Affiliations

Blood flow reduction in breast tissue due to mammographic compression

David R Busch et al. Acad Radiol. 2014 Feb.

Abstract

Rationale and objectives: This study measures hemodynamic properties such as blood flow and hemoglobin concentration and oxygenation in the healthy human breast under a wide range of compressive loads. Because many breast-imaging technologies derive contrast from the deformed breast, these load-dependent vascular responses affect contrast agent-enhanced and hemoglobin-based breast imaging.

Methods: Diffuse optical and diffuse correlation spectroscopies were used to measure the concentrations of oxygenated and deoxygenated hemoglobin, lipid, water, and microvascular blood flow during axial breast compression in the parallel-plate transmission geometry.

Results: Significant reductions (P < .01) in total hemoglobin concentration (∼30%), blood oxygenation (∼20%), and blood flow (∼87%) were observed under applied pressures (forces) of up to 30 kPa (120 N) in 15 subjects. Lipid and water concentrations changed <10%.

Conclusions: Imaging protocols based on injected contrast agents should account for variation in tissue blood flow due to mammographic compression. Similarly, imaging techniques that depend on endogenous blood contrasts will be affected by breast compression during imaging.

Keywords: Mammographic compression; blood flow; breast cancer; breast imaging; diffuse optics.


Figures

Figure 1
Figure 1
(a) Schematic overview. The subject is seated on a height-adjustable chair with the breast placed between two compression plates. Optical fibers couple light into and out of the tissue and are also coupled to the optoelectronics of the combined diffuse optical/diffuse correlation spectroscopy (DOS/DCS) instrument module. Skin pressure (P), applied force (F), and plate separation (d) are measured throughout the study. (b) Schematic view of compression plates, load sensor, pressure sensor, and optodes. To improve data quality, eight DCS detectors were colocated and data from these detectors were obtained in parallel and averaged. Twenty-six pressure sensors were located on the upper and lower plates. (c) Schematic view of pressure sensor distribution. The red star indicates the optode location. The size of the blue circles denotes the size of the sensor (15- or 25-mm diameter; size is proportional to sensitivity). (d) Experimental timeline. The initial compression was set to a nominal force of 60 N, and the subsequent compressions were set to ~120 N. In practice, both of these force levels were limited by subject compliance. (e) Photograph of compression plate system. For interpretation of the references to color in this figure legend, the reader is referred to the web version of this article.
Figure 2
Figure 2
Example data from a 28-year-old subject (body mass index = 19.6 kg/m2), showing time traces of distance, force, and pressure. (a) Plate separation (d). (b) Applied force (F, blue, left axis) and surface pressure (P, red, right axis). The plate separation d is inversely related to force (F) and pressure (P). Hemodynamic measurements for this subject are shown in Figure 3. For interpretation of the references to color in this figure legend, the reader is referred to the web version of this article.
Figure 3
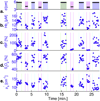
Figure 3
Example data from a 28-year-old subject (body mass index = 19.6 kg/m2), showing time traces of distance and hemodynamic properties. Mechanical measurements for this subject are shown in Figure 2. (a) Plate separation (d). (b) Total hemoglobin concentration (Hbt). (c) Relative blood flow (rBF). (d) Blood oxygen saturation (StO2) and (e) reduced tissue scattering coefficient μs versus experiment time. As expected, Hbt (b), rBF (c), and StO2 (d) are reduced during compression. For interpretation of the references to color in this figure legend, the reader is referred to the web version of this article.
Figure 4
Figure 4
Two examples of stress–strain response during a single compression from baseline load in a pair of subjects. To remove the baseline pressure (e.g., due to the weight of the breast tissue resting on the compression plate), stress is defined as the measured change in surface pressure from the baseline (ΔP = PP0, kPa). An effective strain is defined as the measured change in plate separation divided by the initial plate separation (Δd/d0, %). Both the quantities were measured continuously; error bars represent the standard deviation of measurements inside a ~4-second averaging time-window. As expected, the stress response in the low strain regimen was approximately linear, and it transitioned to an exponential response at high strain. Note that the linear range differed significantly between subjects. (Color version of the figure is available online.)
Figure 5
Figure 5
Mechanical properties of breast tissue. Each point corresponds to the average parameter during a baseline or compressed period (e.g., as in Fig 2a); error bars are the standard deviation of the parameter. Red dots denote postmenopausal, and blue dots, premenopausal subjects. (a) Change in surface pressure (ΔP = PP0) versus applied force (ΔF = FF0) from baseline. (b)ΔP (≃stress) versus fractional change in plate separation (Δd/d0 ≃ strain). Note that, we performed linear fits over two ranges of stress: 0%–20%(green) and 0%–50% (black, all data). Although the latter range includes some data points, which may be outside of the linear stress–strain regimen, we use a simple linear model for the present analysis. Approximate systolic and diastolic blood pressures for healthy persons are shown for reference. For interpretation of the references to color in this figure legend, the reader is referred to the web version of this article.
Figure 6
Figure 6
Population-averaged hemodynamic changes under compression versus applied pressure. Percentage change from baseline in (a) total hemoglobin concentration, rHbt = Hbt/(Hbt)0; (b) blood oxygen saturation, ΔStO2 = StO2 − (StO2)0; (c) lipid concentration, Δlipid = lipid − lipid0; (d) water concentration ΔH2O = H2O − (H2O)0; (e, f) blood flow, rBF = BF/BF0; and (g) tissue reduced scattering coefficient at 785 nm, rμs=μs/(μs)0; under compression versus change in surface pressure ΔP = PP0 (a–e, g) or applied force ΔF = FF0 (f). Data were binned by ΔP = baseline (0 kPa), 5 kPa (0–10), 15 kPa (10–20), and 25 kPa (20–30) or ΔF = baseline (0 N), 15 N (0–30), 45 N (30–60), 75 N (60–90), and 105 N (90–120). Note: data from both compression time windows on both breasts for each subject are included in these figures. Error bars are standard error for each bin; the number of data points included in each bin is noted in the figures. Data marked with “*” (“**”) are statistically different than baseline (zero change) using a two-tailed t test with P< .05 (.01). (Color version of the figure is available online.)

References

    1. Saslow D, Boetes C, Burke W, et al. A. C. S. B. C. A. Group. American Cancer Society guidelines for breast screening with MRI as an adjunct to mammography. CA-Cancer J Clin. 2007;57:75–89. - PubMed
    1. Niklason LT, Christian BT, Niklason LE, et al. Digital tomosynthesis in breast imaging. Radiology. 1997;205:399–406. - PubMed
    1. Chen SC, Carton A-K, Albert M, et al. Initial clinical experience with contrast-enhanced digital breast tomosynthesis. Acad Radiol. 2007;14:229–238. - PMC - PubMed
    1. O’Hagan JJ, Samani A. Measurement of the hyperelastic properties of 44 pathological ex vivo breast tissue samples. Phys Med Biol. 2009;54:2557. - PubMed
    1. O’Hagan JJ, Samani A. Measurement of the hyperelastic properties of tissue slices with tumour inclusion. Phys Med Biol. 2008;53:7087. - PubMed

Publication types