

Practical steps for applying a new dynamic model to near-infrared spectroscopy measurements of hemodynamic oscillations and transient changes: implications for cerebrovascular and functional brain studies
- PMID: 24439332
- PMCID: PMC4439110
- DOI: 10.1016/j.acra.2013.10.012
Practical steps for applying a new dynamic model to near-infrared spectroscopy measurements of hemodynamic oscillations and transient changes: implications for cerebrovascular and functional brain studies
Abstract
Rationale and objectives: Perturbations in cerebral blood volume (CBV), blood flow (CBF), and metabolic rate of oxygen (CMRO2) lead to associated changes in tissue concentrations of oxy- and deoxy-hemoglobin (ΔO and ΔD), which can be measured by near-infrared spectroscopy (NIRS). A novel hemodynamic model has been introduced to relate physiological perturbations and measured quantities. We seek to use this model to determine functional traces of cbv(t) and cbf(t) - cmro2(t) from time-varying NIRS data, and cerebrovascular physiological parameters from oscillatory NIRS data (lowercase letters denote the relative changes in CBV, CBF, and CMRO2 with respect to baseline). Such a practical implementation of a quantitative hemodynamic model is an important step toward the clinical translation of NIRS.
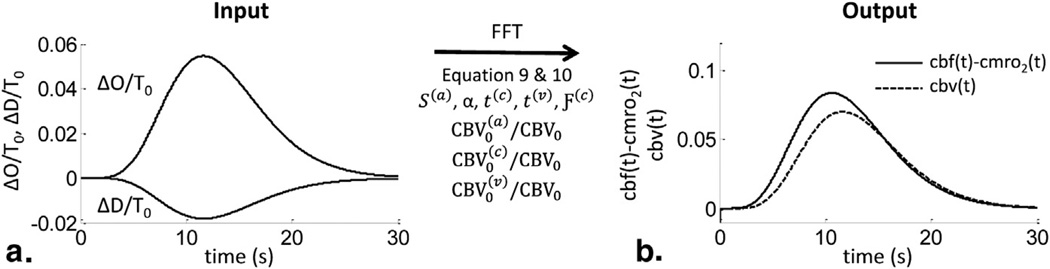
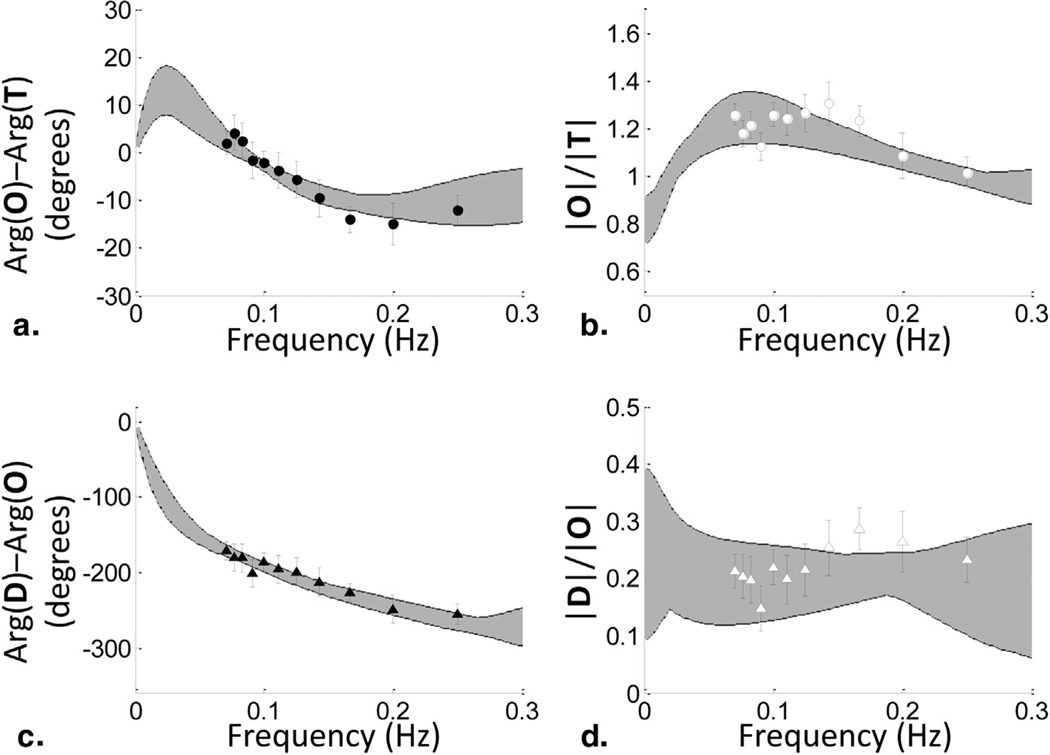
Materials and methods: In the time domain, we have simulated O(t) and D(t) traces induced by cerebral activation. In the frequency domain, we have performed a new analysis of frequency-resolved measurements of cerebral hemodynamic oscillations during a paced breathing paradigm.
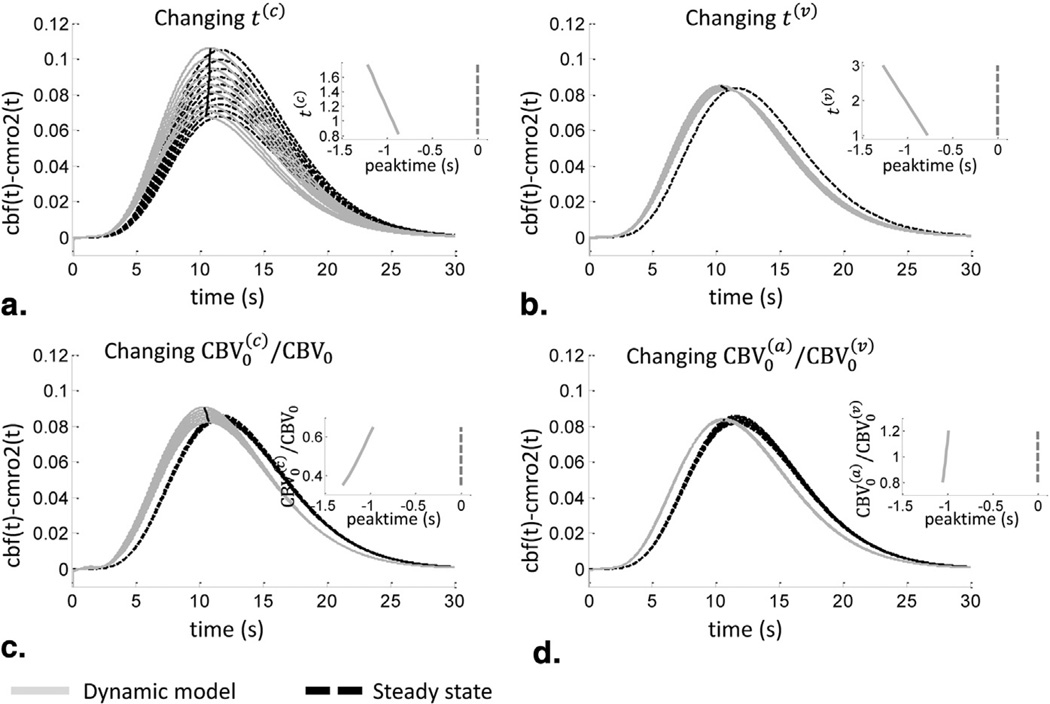
Results: We have demonstrated that cbv(t) and cbf(t) - cmro2(t) can be reliably obtained from O(t) and D(t) using the model, and that the functional NIRS signals are delayed with respect to cbf(t) - cmro2(t) as a result of the blood transit time in the microvasculature. In the frequency domain, we have identified physiological parameters (e.g., blood transit time, cutoff frequency of autoregulation) that can be measured by frequency-resolved measurements of hemodynamic oscillations.
Conclusions: The ability to perform noninvasive measurements of cerebrovascular parameters has far-reaching clinical implications. Functional brain studies rely on measurements of CBV, CBF, and CMRO2, whereas the diagnosis and assessment of neurovascular disorders, traumatic brain injury, and stroke would benefit from measurements of local cerebral hemodynamics and autoregulation.
Keywords: Hemodynamic model; cerebral autoregulation; cerebral blood flow; metabolic rate of oxygen; near-infrared spectroscopy.
Copyright © 2014 AUR. Published by Elsevier Inc. All rights reserved.
Figures
Similar articles
-
Dynamic model for the tissue concentration and oxygen saturation of hemoglobin in relation to blood volume, flow velocity, and oxygen consumption: Implications for functional neuroimaging and coherent hemodynamics spectroscopy (CHS).Neuroimage. 2014 Jan 15;85 Pt 1(0 1):202-21. doi: 10.1016/j.neuroimage.2013.03.065. Epub 2013 Apr 10. Neuroimage. 2014. PMID: 23583744 Free PMC article.
-
[Detection of changes in cerebral blood flow and cerebrovascular autoregulation by near-infrared spectroscopy in newborn piglets].Zhonghua Er Ke Za Zhi. 2007 May;45(5):349-53. Zhonghua Er Ke Za Zhi. 2007. PMID: 17697620 Chinese.
-
A new hemodynamic model shows that temporal perturbations of cerebral blood flow and metabolic rate of oxygen cannot be measured individually using functional near-infrared spectroscopy.Physiol Meas. 2014 Jan;35(1):N1-9. doi: 10.1088/0967-3334/35/1/N1. Epub 2013 Dec 17. Physiol Meas. 2014. PMID: 24346036
-
Measuring cerebrovascular autoregulation in preterm infants using near-infrared spectroscopy: an overview of the literature.Expert Rev Neurother. 2017 Aug;17(8):801-818. doi: 10.1080/14737175.2017.1346472. Epub 2017 Jun 29. Expert Rev Neurother. 2017. PMID: 28639837 Review.
-
Monitoring of cerebral blood flow autoregulation: physiologic basis, measurement, and clinical implications.Br J Anaesth. 2024 Jun;132(6):1260-1273. doi: 10.1016/j.bja.2024.01.043. Epub 2024 Mar 12. Br J Anaesth. 2024. PMID: 38471987 Review.
Cited by
-
Phase dual-slopes in frequency-domain near-infrared spectroscopy for enhanced sensitivity to brain tissue: First applications to human subjects.J Biophotonics. 2020 Jan;13(1):e201960018. doi: 10.1002/jbio.201960018. Epub 2019 Oct 2. J Biophotonics. 2020. PMID: 31479582 Free PMC article.
-
Basic Examination of Haemoglobin Phase of Oxygenation and Deoxygenation in Resting State and Task Periods in Adults Using fNIRS.Adv Exp Med Biol. 2022;1395:189-198. doi: 10.1007/978-3-031-14190-4_32. Adv Exp Med Biol. 2022. PMID: 36527636
-
Optical oximetry of volume-oscillating vascular compartments: contributions from oscillatory blood flow.J Biomed Opt. 2016 Oct;21(10):101408. doi: 10.1117/1.JBO.21.10.101408. J Biomed Opt. 2016. PMID: 26926870 Free PMC article.
-
Quantitative measurements of cerebral blood flow with near-infrared spectroscopy.Biomed Opt Express. 2019 Mar 28;10(4):2117-2134. doi: 10.1364/BOE.10.002117. eCollection 2019 Apr 1. Biomed Opt Express. 2019. PMID: 31061774 Free PMC article.
-
Evaluation of calibrated and uncalibrated optical imaging approaches for relative cerebral oxygen metabolism measurements in awake mice.Physiol Meas. 2024 Apr 24;45(4):045007. doi: 10.1088/1361-6579/ad3a2d. Physiol Meas. 2024. PMID: 38569522 Free PMC article.
References
-
- Ferrari M, Quaresima V. A brief review on the history of human functional near-infrared spectroscopy (fNIRS) development and fields of application. Neuroimage. 2012;63:921–935. - PubMed
-
- Leff DR, Oriheula-Espina F, Elwell CE, et al. Assessment of the cerebral cortex during motor task behaviours in adults: a systematic review of functional near infrared spectroscopy (fNIRS) studies. Neuroimage. 2011;54:2922–2936. - PubMed
MeSH terms
Substances
Grants and funding
LinkOut - more resources
Full Text Sources
Other Literature Sources
