

Patterns of birth cohort-specific smoking histories, 1965-2009
- PMID: 24439359
- PMCID: PMC3951759
- DOI: 10.1016/j.amepre.2013.10.022
Patterns of birth cohort-specific smoking histories, 1965-2009
Abstract
Background: Characterizing the smoking patterns for different birth cohorts is essential for evaluating the impact of tobacco control interventions and predicting smoking-related mortality, but the process of estimating birth cohort smoking histories has received limited attention.
Purpose: Smoking history summaries were estimated beginning with the 1890 birth cohort in order to provide fundamental parameters that can be used in studies of cigarette smoking intervention strategies.
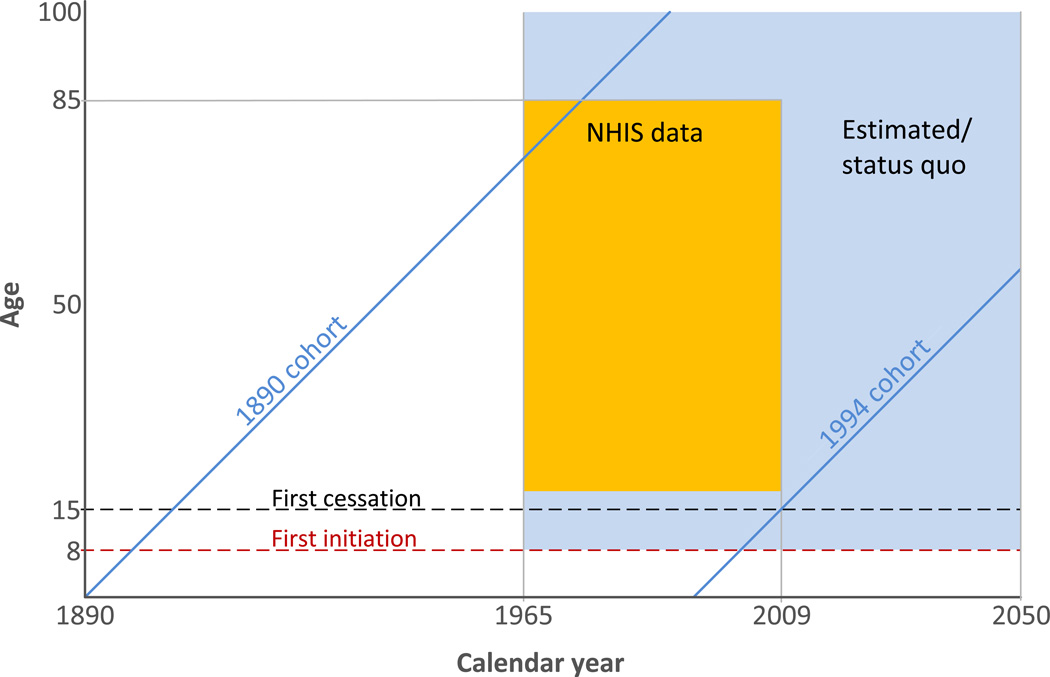
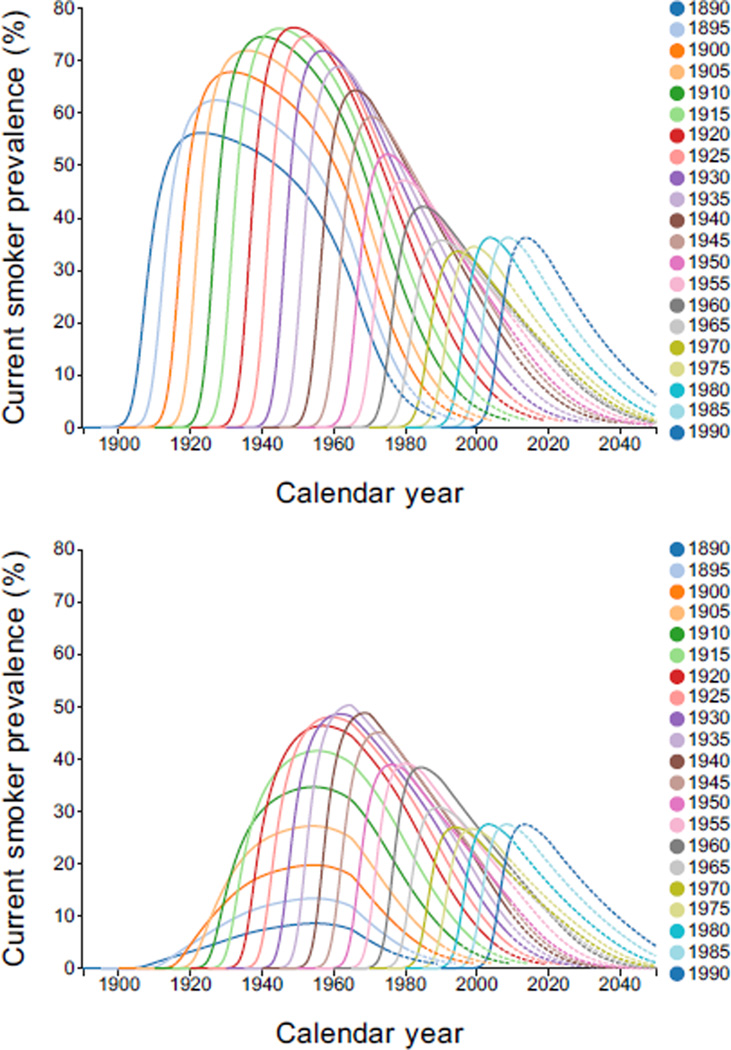
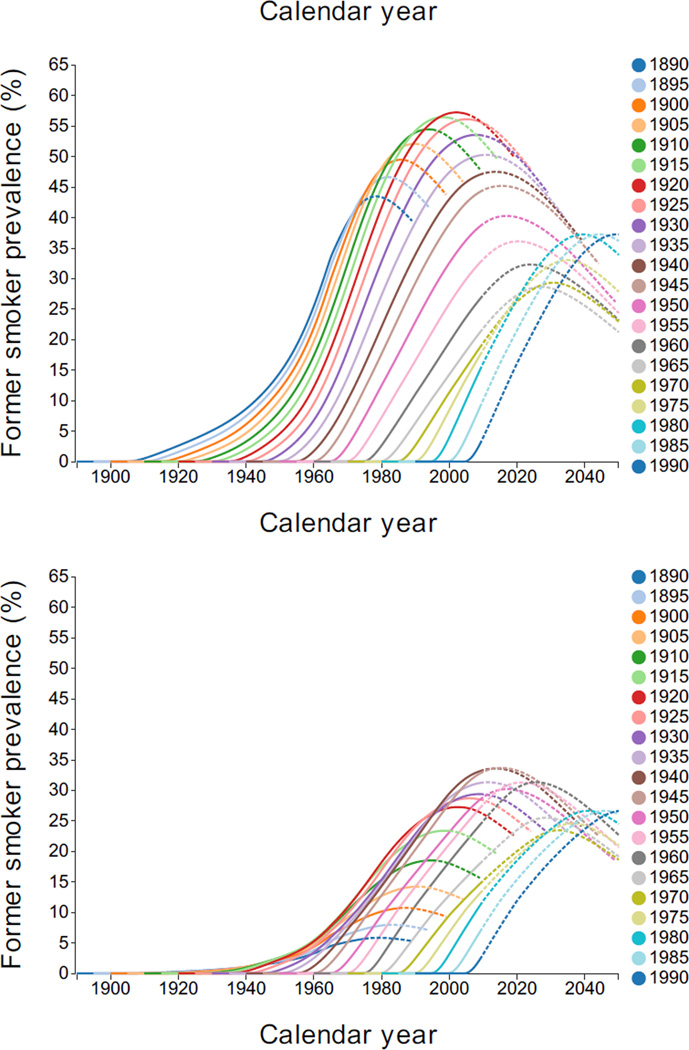
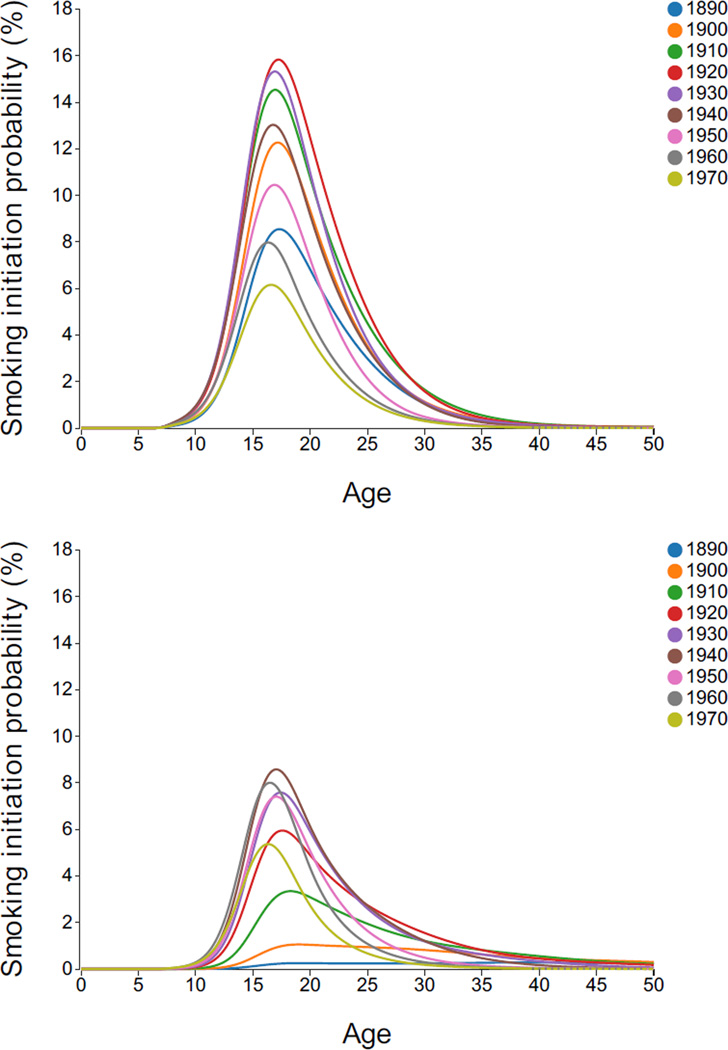
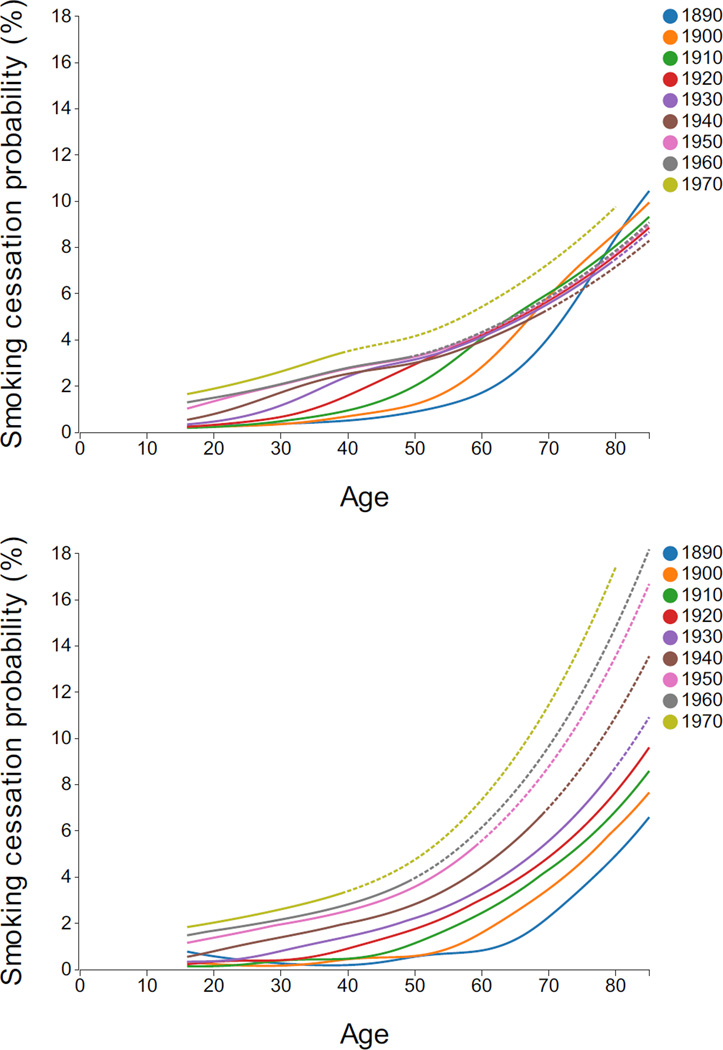
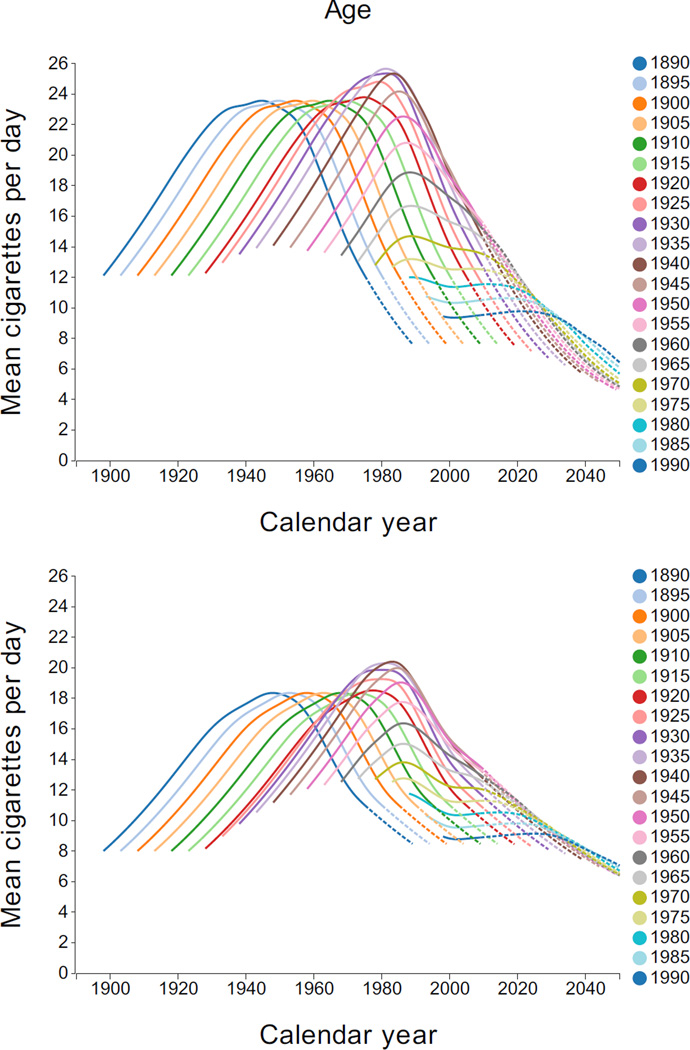
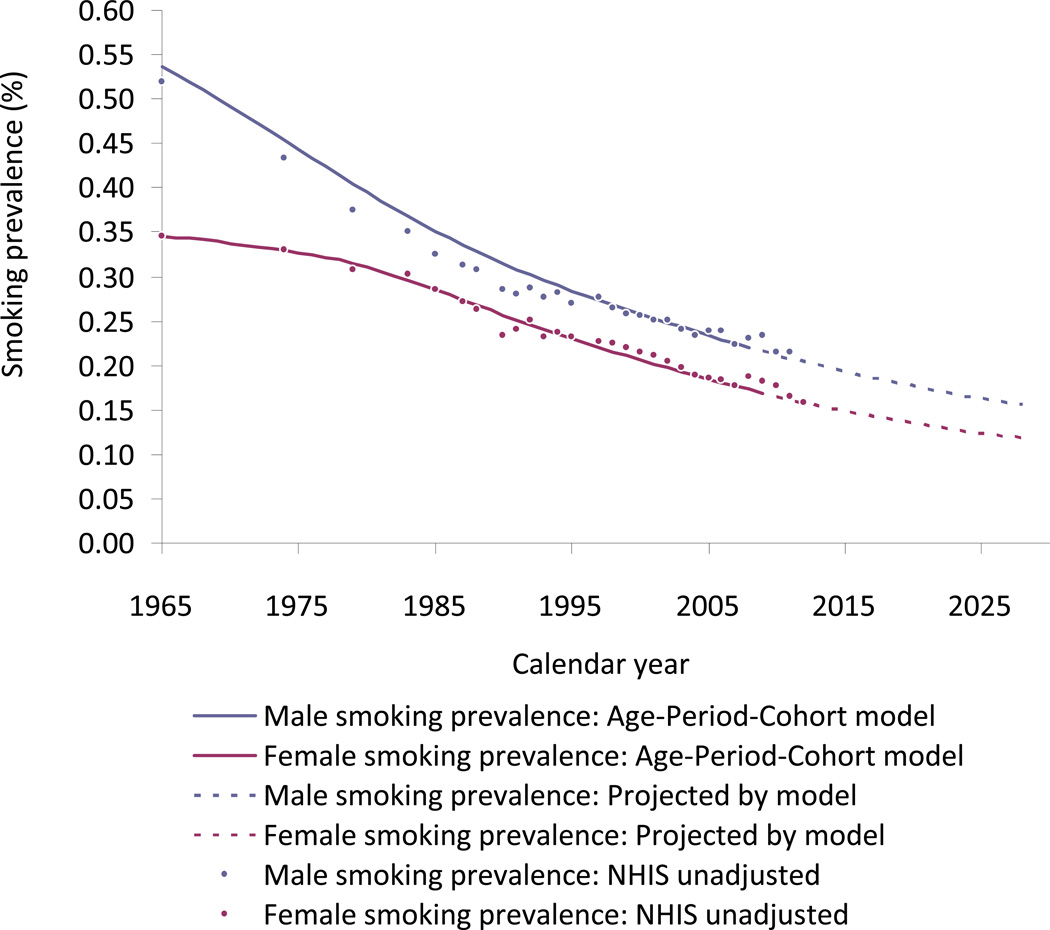
Methods: U.S. National Health Interview Surveys conducted from 1965 to 2009 were used to obtain cross-sectional information on current smoking behavior. Surveys that provided additional detail on history for smokers including age at initiation and cessation and smoking intensity were used to construct smoking histories for participants up to the date of survey. After incorporating survival differences by smoking status, age-period-cohort models with constrained natural splines were used to estimate the prevalence of current, former, and never smokers in cohorts beginning in 1890. This approach was then used to obtain yearly estimates of initiation, cessation, and smoking intensity for the age-specific distribution for each birth cohort. These rates were projected forward through 2050 based on recent trends.
Results: This summary of smoking history shows clear trends by gender, cohort, and age over time. If current patterns persist, a slow decline in smoking prevalence is projected from 2010 through 2040.
Conclusions: A novel method of generating smoking histories has been applied to develop smoking histories that can be used in micro-simulation models, and has been incorporated in the National Cancer Institute's Smoking History Generator. These aggregate estimates developed by age, gender, and cohort will provide a complete source of smoking data over time.
© 2013 Published by American Journal of Preventive Medicine on behalf of American Journal of Preventive Medicine.
Figures
References
-
- Surgeon General’s Advisory Committee on Smoking and Health. Smoking and Health: Report of the Advisory Committee to the Surgeon General of the Public Health Service. U.S. Department of Health, Education, and Welfare, Public Health Service, Office of the Surgeon General; 1964. 1964.
-
- Harris JE. Cigarette smoking among successive birth cohorts of men and women in the United States during 1900–80. J Natl Cancer Inst. 1983;71:473–479. - PubMed
Publication types
MeSH terms
Grants and funding
LinkOut - more resources
Full Text Sources
Other Literature Sources
