. 2014 Jan 16;156(1-2):69-83.
doi: 10.1016/j.cell.2013.12.008.

Neuronal control of metabolism through nutrient-dependent modulation of tracheal branching

Affiliations

Neuronal control of metabolism through nutrient-dependent modulation of tracheal branching

Gerit A Linneweber et al. Cell. .

Abstract

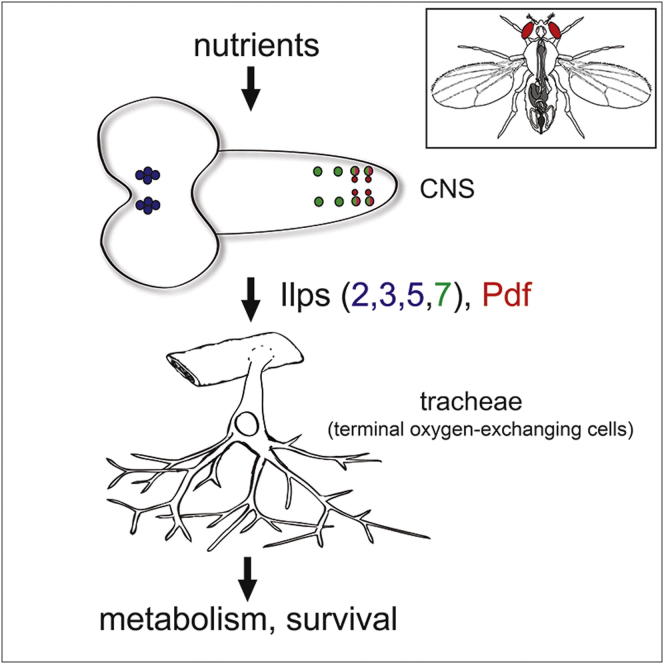
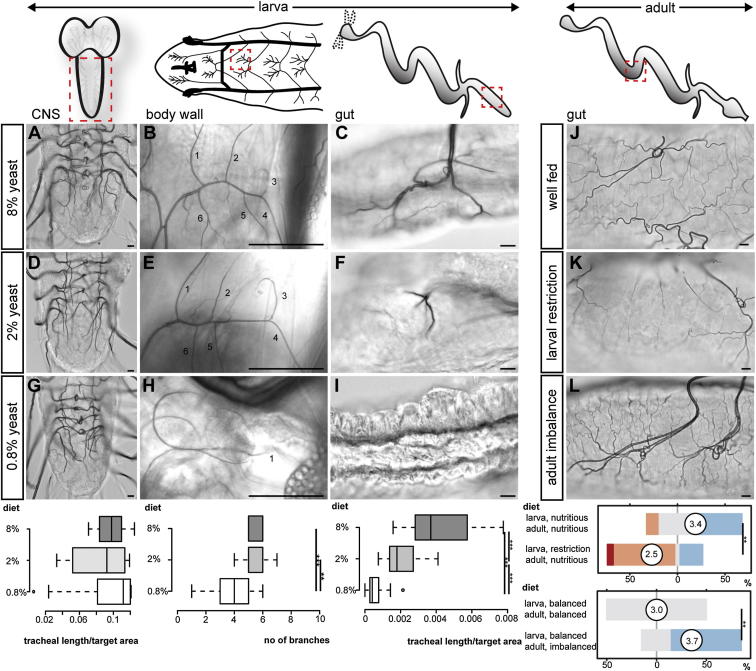
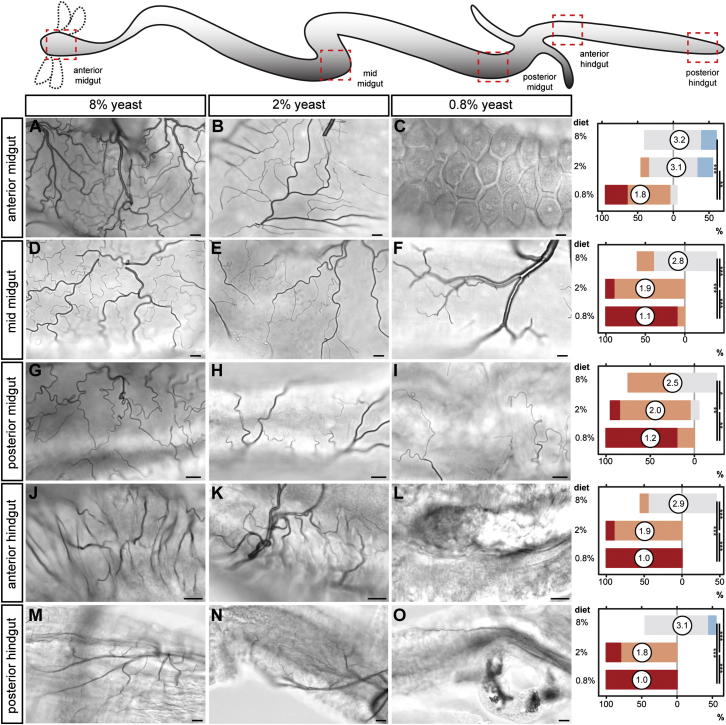
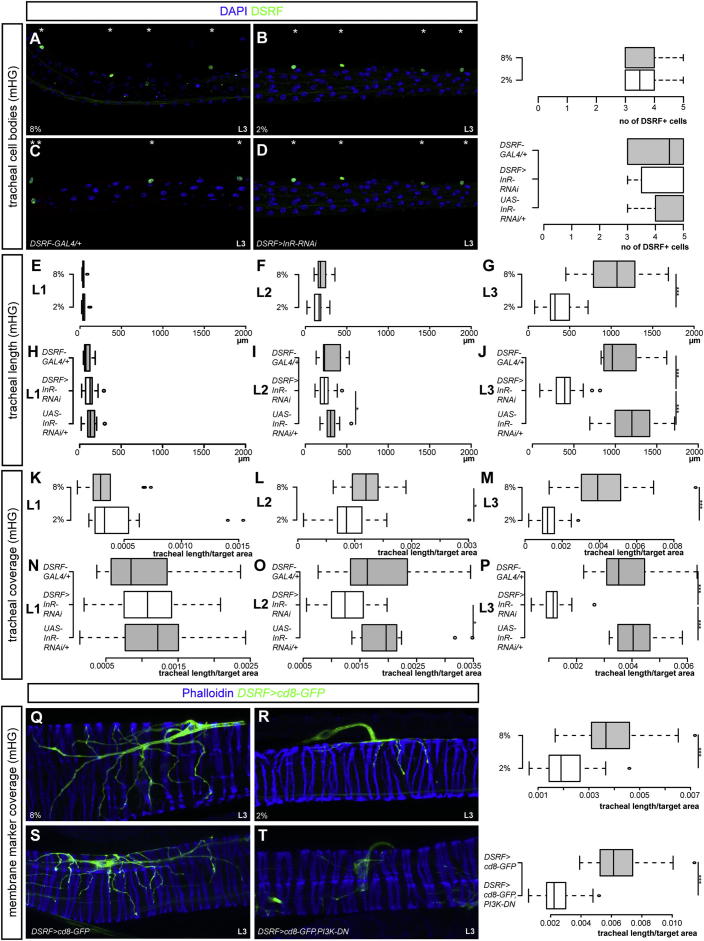
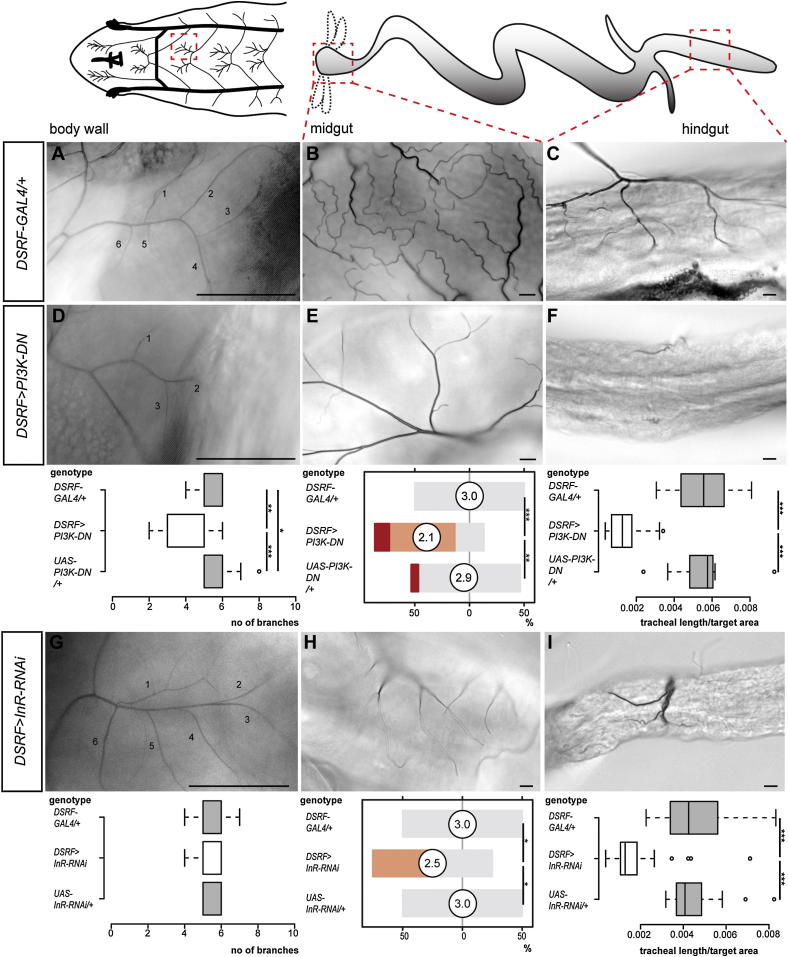
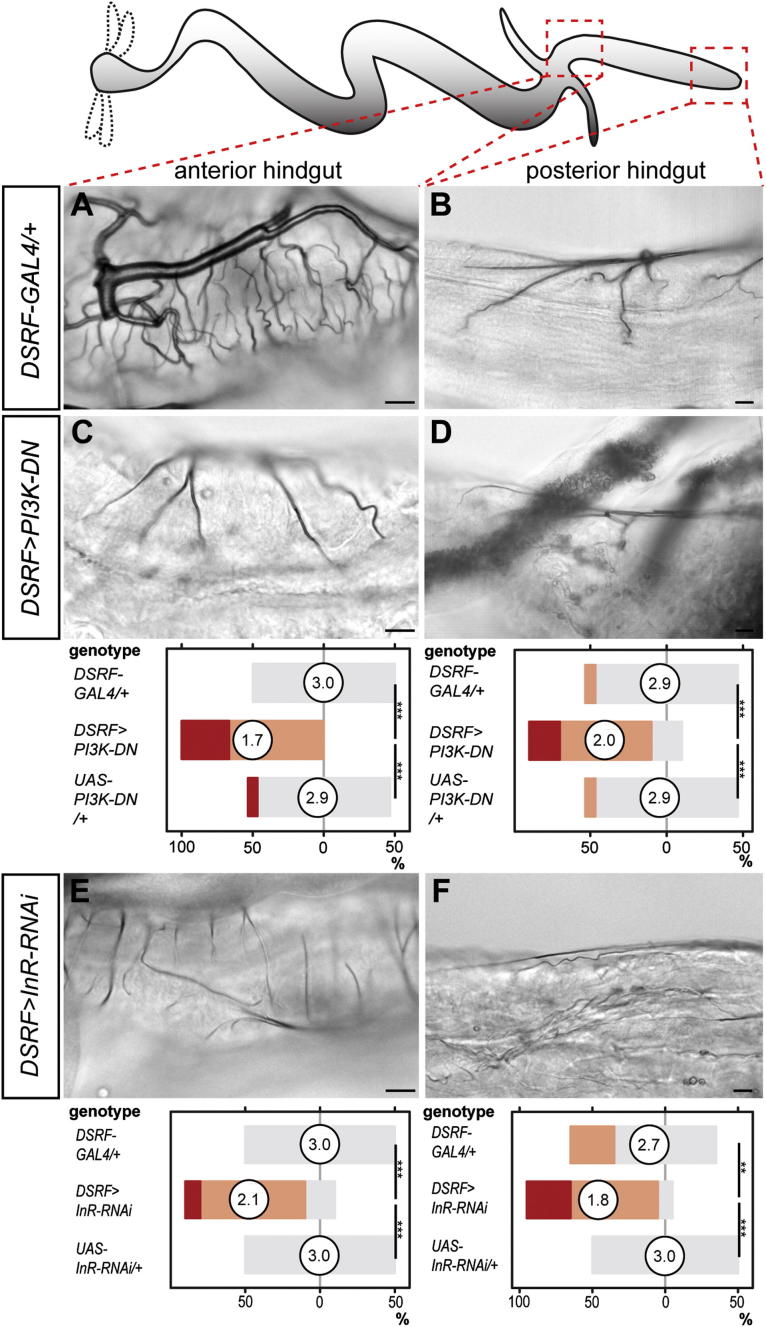
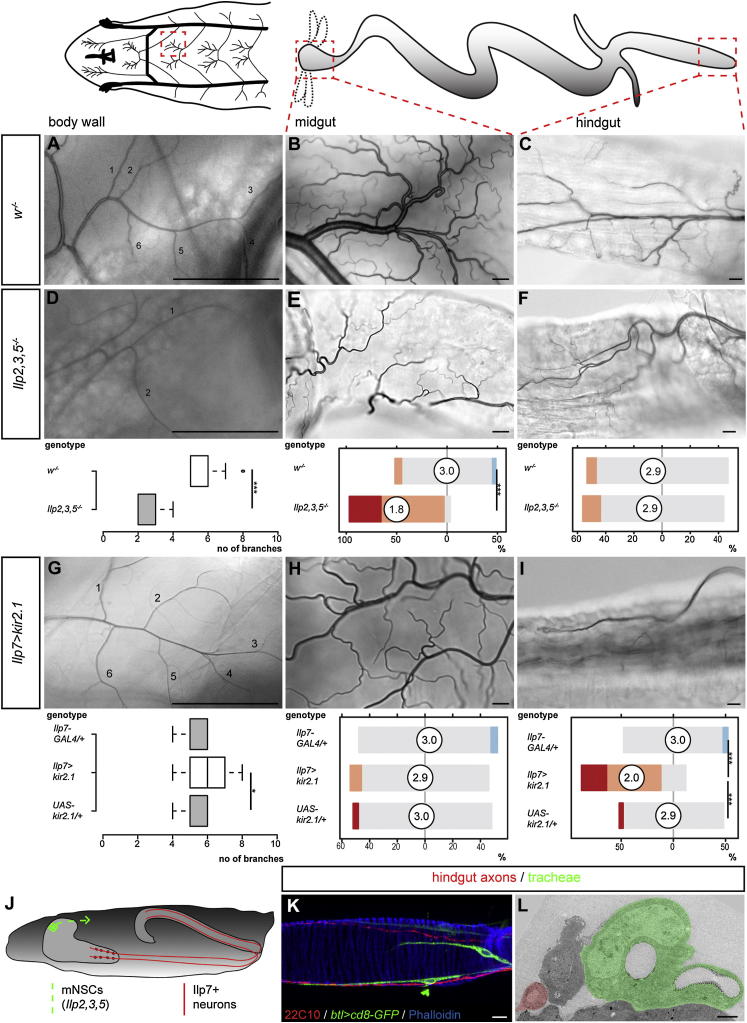
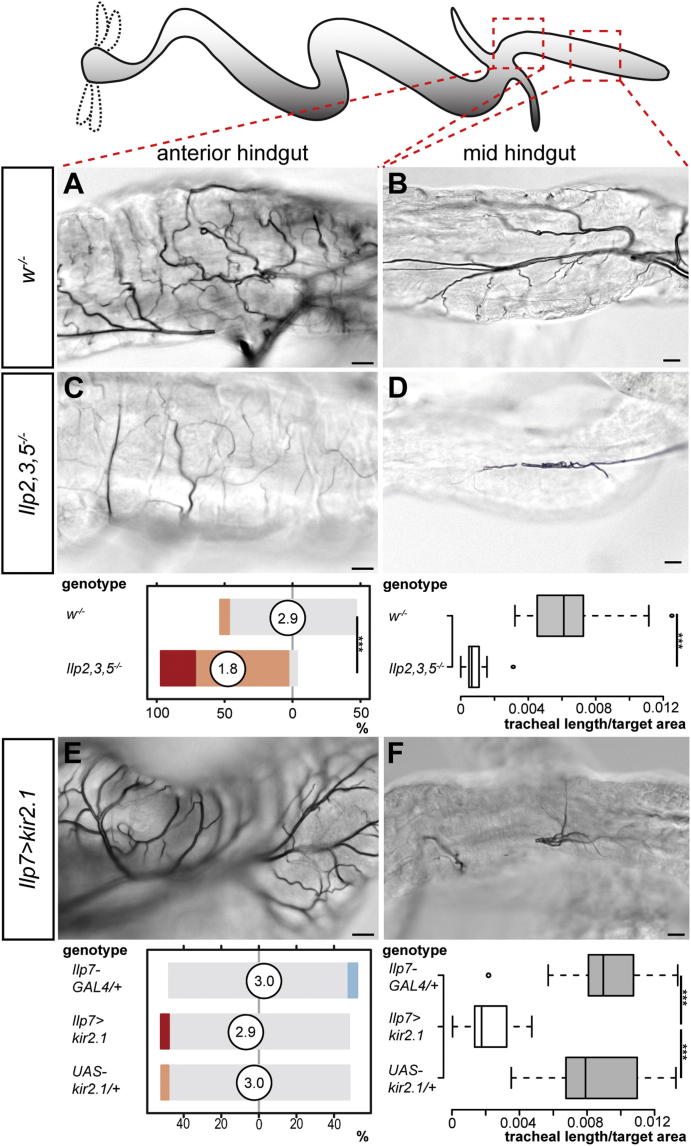
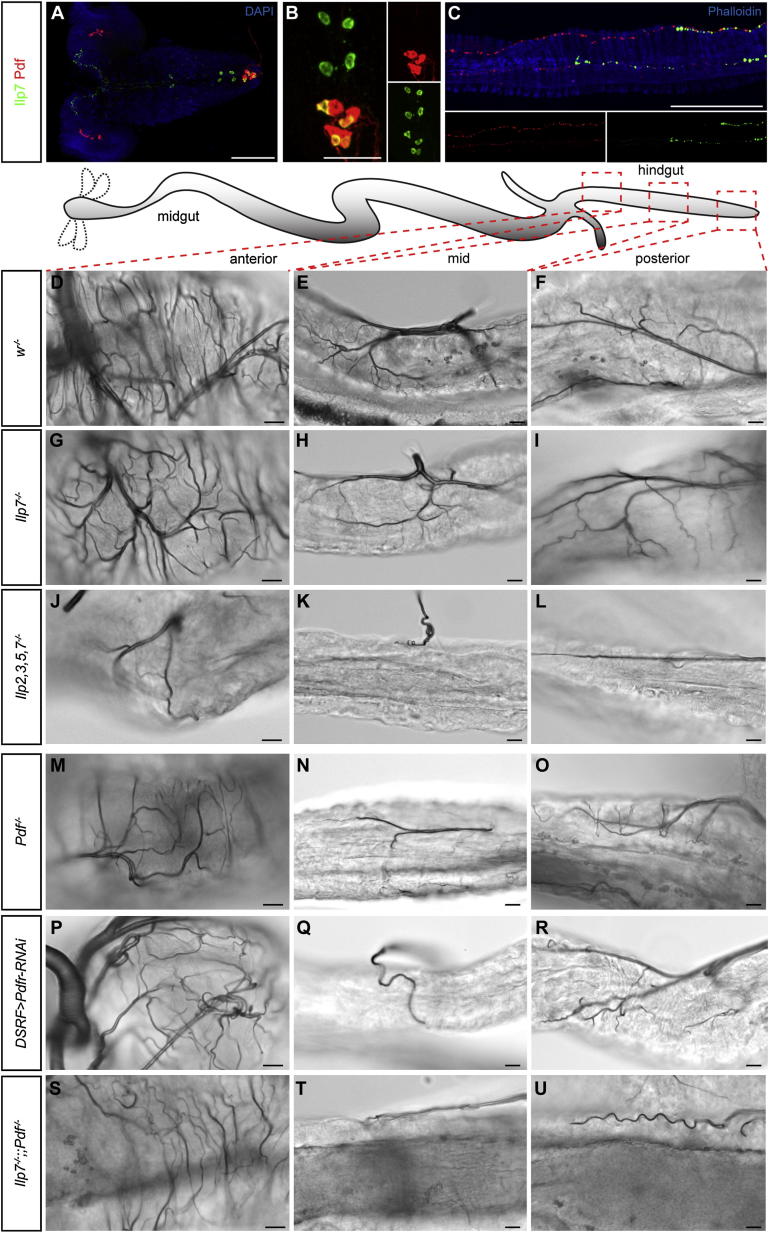
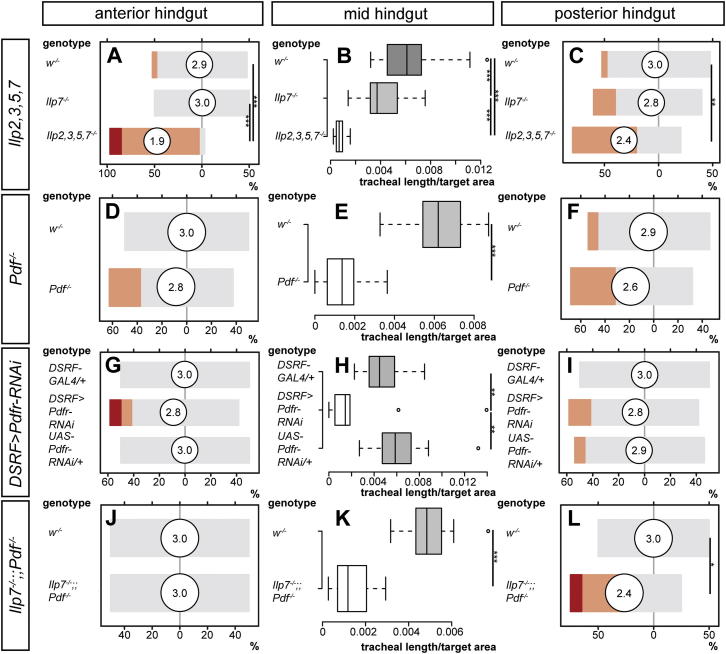
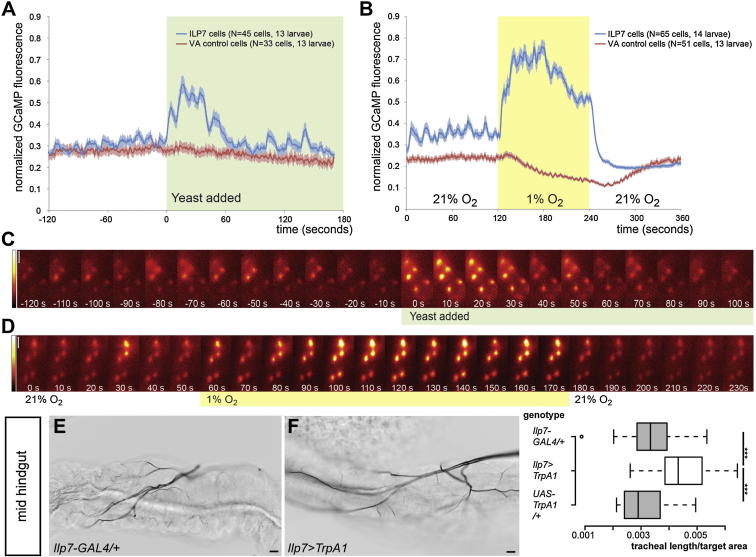
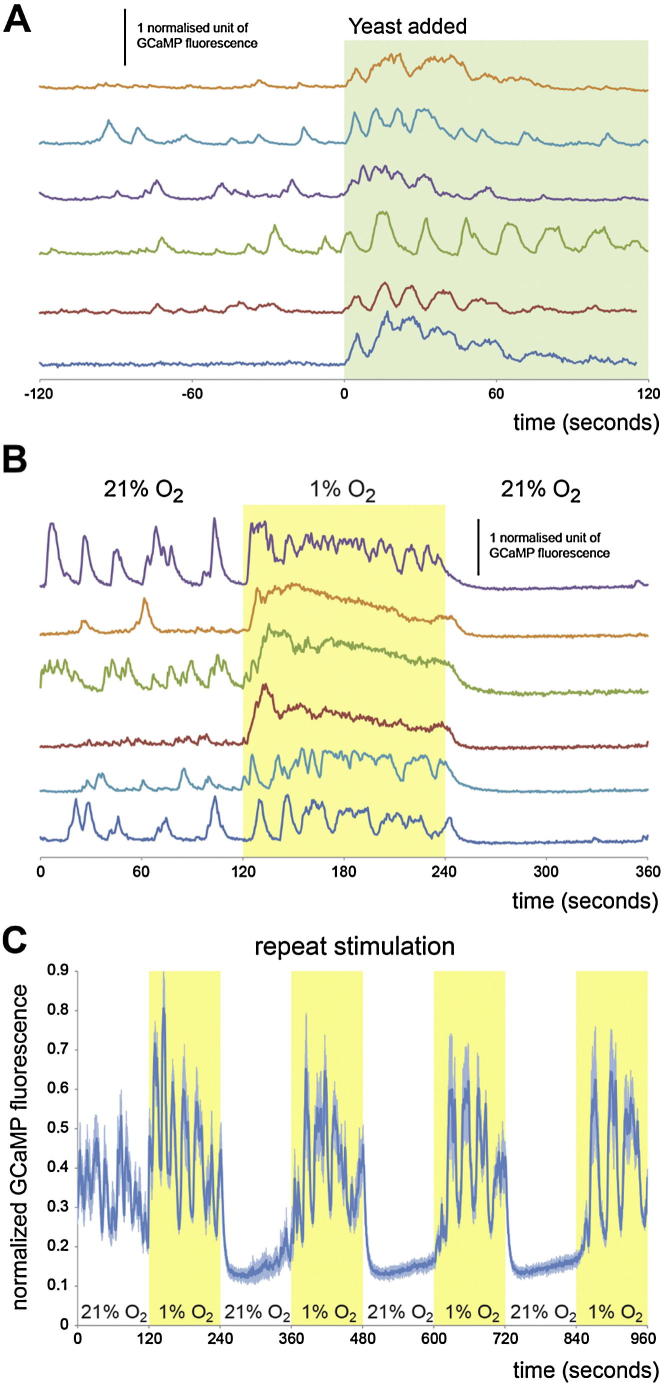
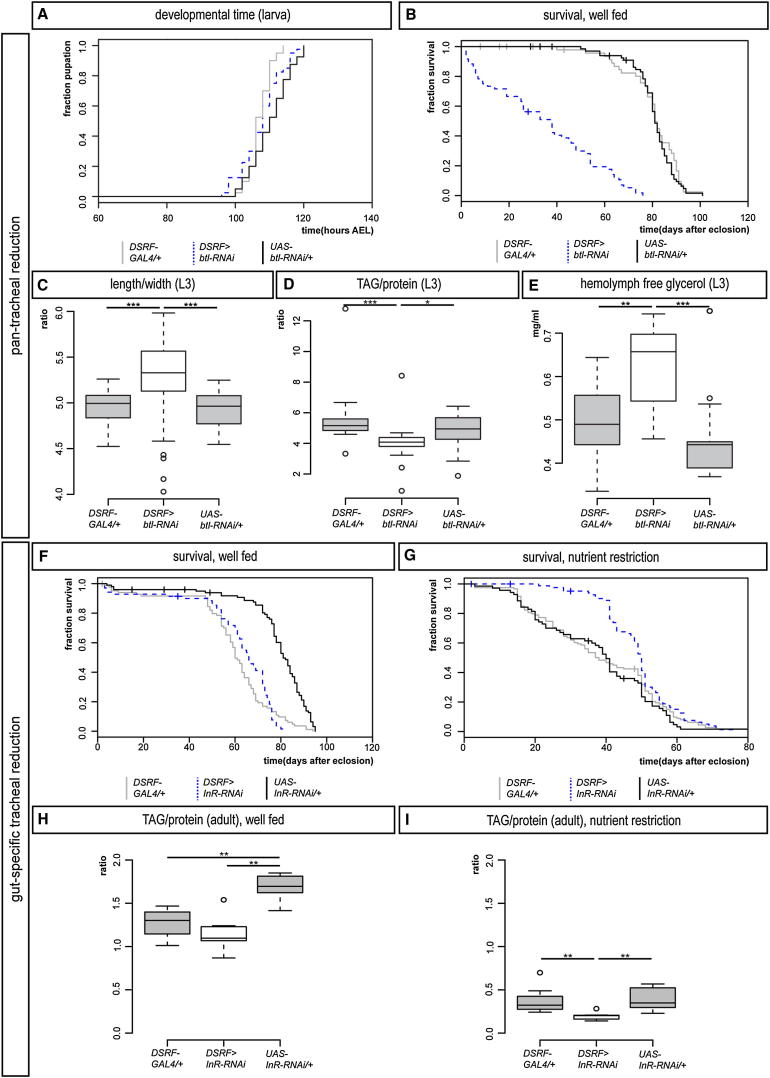
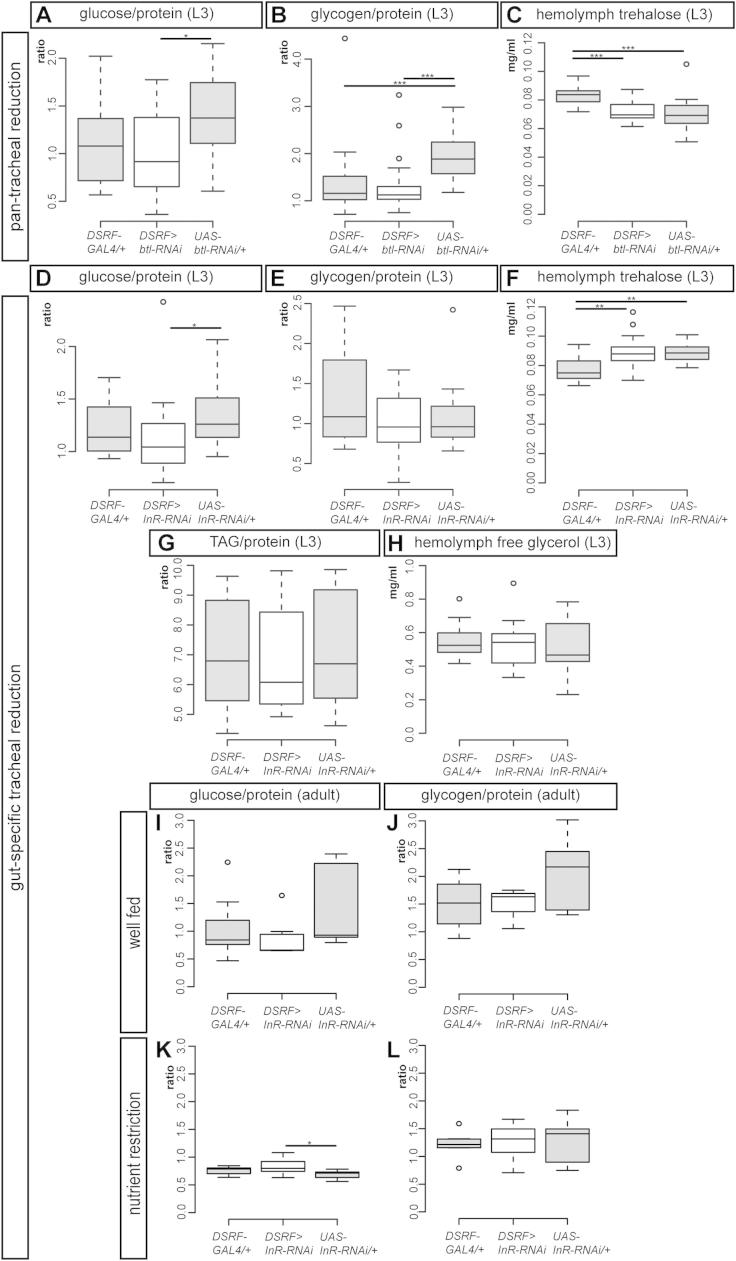
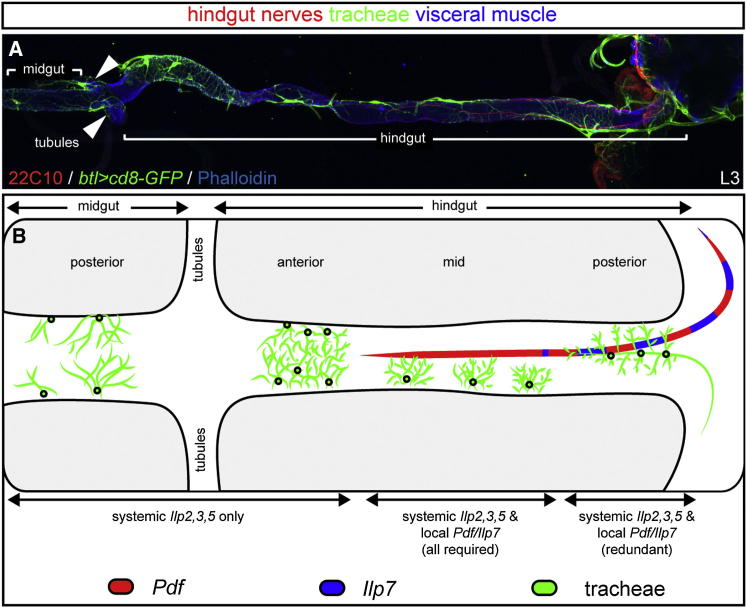
During adaptive angiogenesis, a key process in the etiology and treatment of cancer and obesity, the vasculature changes to meet the metabolic needs of its target tissues. Although the cues governing vascular remodeling are not fully understood, target-derived signals are generally believed to underlie this process. Here, we identify an alternative mechanism by characterizing the previously unrecognized nutrient-dependent plasticity of the Drosophila tracheal system: a network of oxygen-delivering tubules developmentally akin to mammalian blood vessels. We find that this plasticity, particularly prominent in the intestine, drives--rather than responds to--metabolic change. Mechanistically, it is regulated by distinct populations of nutrient- and oxygen-responsive neurons that, through delivery of both local and systemic insulin- and VIP-like neuropeptides, sculpt the growth of specific tracheal subsets. Thus, we describe a novel mechanism by which nutritional cues modulate neuronal activity to give rise to organ-specific, long-lasting changes in vascular architecture.


Figures

None
Graphical abstract
Figure 1
Figure 1
Nutritional and Organ-Specific Plasticity of Different Tracheal Subsets (A–C) Representative tracheation of the ventral nerve cord (VNC) (A), body wall (B), and gut (mid-hindgut, C) in well-fed larvae (8% yeast). (D–F) A mild nutrient restriction (2% yeast) does not affect CNS (D) or body wall (E) tracheae, but leads to reduced tracheal terminal growth in the gut (mid-hindgut, F). (G–I) Severe nutrient restriction (0.8% yeast) does not affect CNS tracheae (G), but leads to reduced coverage of both body wall (H) and gut (I, mid-hindgut). For body wall: p < 0.001 (8% versus 0.8%), p = 0.004 (2% versus 0.8%). For mid-hindgut: p < 0.0001 (8% versus 0.8%), p < 0.0001 (8% versus 2%), and p < 0.0001 (2% versus 0.8%). n = 10–24/set. (J) Representative gut tracheation (mid-midgut) of a 7-day-old adult fly reared on a nutritious (8% yeast) diet both during larval and adult stages. (K) Representative tracheation of the same intestinal region in an age-matched fly subject to an identical dietary regime as an adult, but exposed to a restricted diet (0.8% yeast) during larval life. Reduced branching is apparent. (L) Increased tracheation of the same region in a representative adult fly reared under standard conditions and exposed to 9% sucrose for 7 days. Quantifications of the adult phenotypes (J to L) are displayed below these panels. p = 0.001 (well-fed – larval restriction) and p < 0.0001 (balanced – adult imbalance), n = 17–33/set. Scale bars, 10 μm in all images except for (B), (E), and (H), 100 μm. See also Figures S1 and S2. Color coding for this and subsequent Likert levels are displayed as follows: red (strongly reduced), orange (reduced), gray (unchanged), light blue (increased), and dark blue (strongly increased). The mean (circled) is also displayed. See Experimental Procedures for additional information.
Figure S1
Figure S1
Nutritional Regulation of Different Intestinal Tracheal Subsets, Related to Figure 1 (A) Representative tracheation of the gut portions boxed in the cartoon: anterior midgut (A-C), mid-midgut (D-F), posterior midgut (G-I), anterior hindgut (J-L) and posterior hindgut (M-O) under the same three nutritional conditions described in in Figure 1. Quantifications for each intestinal portion are shown at the end of each row. For anterior midgut: p < 0.001 (8% versus 0.8%) and p = 0.001 (2% versus 0.8%), n = 10/set. For mid-midgut: p < 0.001 (8% versus 0.8%) and p < 0.001 (8% versus 2%) and p < 0.001 (2% versus 0.8%), n = 10/set. For posterior midgut: p = 0.001 (8% versus 0.8%), p = 0.047 (8% versus 2%), and p = 0.004 (2% versus 0.8%), n = 10/set. For anterior hindgut: p < 0.0001 (8% versus 0.8%), p < 0.001 (8% versus 2%), p < 0.001 (2% versus 0.8%), n = 10/set. For posterior hindgut: p < 0.0001 (8% versus 0.8%), p < 0.0001 (8% versus 2%), p < 0.001 (2% versus 0.8%), n = 10/set. Scale bars, 10 μm.
Figure S2
Figure S2
Cellular Analysis of the Reduced Tracheal Coverage Caused by Nutrient Restriction or Reduced Insulin Signaling, Related to Figures 1 and 2 (A to D) Staining with an anti-DSRF antibody that labels the tracheal terminal cell nuclei indicates that these cells are present in 3rd-instar larvae exposed to a mild nutrient restriction (B, not significantly different from the tracheal terminal cell number of well-fed larvae (A). See also quantifications to the right of (A) and (B). This rules out tracheal terminal cell death as the reason for the reduced intestinal tracheal coverage in nutrient-restricted larvae. Similarly, no differences in tracheal terminal cell number are apparent upon reduction of insulin signaling in DSRF>InR-RNAi larvae of the same stage (D, not significantly different from the tracheal terminal cell number of GAL4 (C) or UAS controls (data not shown). See also quantifications to the right of C and D. In all panels, DAPI is used in blue to highlight the gut tissue, and asterisks are used above the tracheal terminal nuclei to highlight them. All panels show the mid-hindgut but the same results were obtained in other intestinal regions (data not shown). (E to P) Quantifications of the total length of tracheal arbours (E to J) and the ratio between this length and the gut area covered by the tracheal arbours (K to P) in the mid-hindgut of well-fed (8% yeast) versus nutrient-restricted (2% yeast) 1st-, 2nd- and 3rd-instar OreR larvae (E to G and K to M) or DSRF>InR-RNAi larvae versus GAL4 and UAS controls (H to J and N to P). Tracheal coverage (as quantified by the length/area ratio in K to M for each larval instar) is mildly reduced in 2nd-instar larvae that have been nutrient restricted (L, p = 0.02), becoming strongly reduced by the 3rd-instar stage (M, p < 0.0001). However, the total length of these tracheal arbours increases with each larval instar (E to G), although not at the same rate as in well-fed larvae (G, p < 0.0001). n = 14–20/set. This suggests that the reduced tracheal coverage results from slower growth of these tracheal arbours. The same is true for the DSRF>InR-RNAi larvae (H to J and N to P). For tracheal length: in I, p = 0.02 versus UAS control but not significant versus GAL4 control, and in J, p < 0.0001 versus either GAL4 or UAS controls. For tracheal coverage: in O, p < 0.001 versus UAS control but not significant versus GAL4 control, and in P, p < 0.0001 versus either GAL4 or UAS controls. n = 13-18/set. (Q and R) Morphology of the tracheal terminal cell arbours of well-fed (Q, 8% yeast) or nutrient-restricted (R, 2% yeast) 3rd-instar larvae expressing the membrane-tagged reporter cd8-GFP from DSRF-GAL4. As the panels and quantification to the right of the panels show, tracheal coverage is reduced in nutrient-restricted 3rd-instar larvae (p < 0.0001, n = 26-29/set). This further confirms that the phenotype observed with DIC optics (an imaging technique best suited to the analysis of gas-filled tracheae), results, at least partly, from reduced branching rather than gas filling. (S and T) The same is true for DSRF > cd8-GFP, PI3K-DN (p < 0.0001 versus DSRF>cd8-GFP control, n = 22-25/set).
Figure 2
Figure 2
Organ-Specific Effects of Reduced Insulin Signaling on Tracheal Coverage (A–C) Representative tracheation of the areas boxed in the cartoons in control larvae: body wall (A), midgut (anterior, B), and hindgut (mid-hindgut, C). (D–F) Expression of PI3K-DN in tracheal terminal cells leads to reduced branching in body wall (D), midgut (anterior, E), and hindgut (mid-hindgut, F). For body wall: p = 0.001 (DSRF>PI3K-DN versus GAL4 control), p < 0.001 (DSRF>PI3K-DN versus UAS control), p = 0.03 (GAL4 versus UAS control), n = 13–15/set. For anterior midgut: p < 0.0001 (DSRF>PI3K-DN versus GAL4 control), p < 0.001 (DSRF>PI3K-DN versus UAS control), n = 15/set. For mid-hindgut: p < 0.0001 (DSRF>PI3K-DN versus GAL4 control), p < 0.0001 (DSRF>PI3K-DN versus UAS control), n = 19–25/set. (G–I) Driving RNAi against InR from the same driver line does not affect body wall tracheae (G) but leads to reduced branching in the midgut (anterior, H) and hindgut (mid-hindgut, I). Scale bars, 10 μm in all images except for (A), (D), and (G), 100 μm. For body wall: n = 15–20/set. For anterior midgut: p = 0.014 (DSRF>InR-RNAi versus GAL4 control), p = 0.014 (DSRF>InR-RNAi versus UAS control), n = 10/set. For mid-hindgut: p < 0.0001 (DSRF>InR-RNAi versus GAL4 control), p < 0.0001 (DSRF>InR-RNAi versus UAS control), n = 27–28/set. See also Figures S2 and S3.
Figure S3
Figure S3
Effects of Reduced Insulin Signaling in the Tracheal Terminal Cells of Additional Intestinal Portions, Related to Figure 2 Representative tracheation of the areas boxed in the cartoons in control flies: anterior hindgut (A) and mid-hindgut (B). Expression of PI3K-DN specifically in tracheal terminal cells results in reduced branching in the anterior (C) and posterior hindgut (D). Tracheal branching quantifications for controls and DSRF>PI3K-DN larvae are shown separately for each tracheal subset below each column. p < 0.0001 (DSRF>PI3K-DN versus GAL4 control) and p < 0.0001 (DSRF>PI3K-DN versus UAS control) for both anterior and posterior hindgut, n = 15/set. Driving RNAi against InR from the same driver line leads to reduced branching in these same gut portions: anterior hindgut (E) and posterior hindgut (F). Tracheal branching quantification for controls and DSRF>InR-RNAi larvae are shown separately for each tracheal subset below each panel. For anterior hindgut: p < 0.001 (DSRF>InR-RNAi versus GAL4 control), p < 0.001 (DSRF>InR-RNAi versus UAS control). For posterior hindgut: p = 0.005 (DSRF>InR-RNAi versus GAL4 control), p < 0.001 (DSRF>InR-RNAi versus UAS control). n = 10 flies/set. Scale bars, 10 μm.
Figure 3
Figure 3
Two Subsets of Insulin-Producing Neurons Regulate the Growth of Different Tracheal Subsets (A–C) Representative terminal tracheation in well-fed control larvae. The specific body wall/gut areas are boxed in the cartoons: body wall (A), midgut (B, anterior), and hindgut (C, posterior). (D–F) Reduced branching is apparent in equivalent areas of the body wall (D), midgut (E), but not hindgut (F) in well-fed and genetically matched Ilp2,3,5 mutants. p < 0.0001 for both body wall and anterior midgut. n = 16–35/set. (G–I) Representative terminal tracheation in the same body regions of well-fed control larvae upon silencing of the hindgut-innervating Ilp7 neurons. No effect is apparent in body wall (G) or anterior midgut (H), but the tracheal branching in the posterior hindgut is significantly reduced (I). For body wall: p = 0.048 (Ilp7 > kir2.1 versus UAS control), but not significant versus GAL4 control. For posterior hindgut: p < 0.0001 (Ilp7 > kir2.1 versus GAL4 control) and p < 0.0001 (Ilp7 > kir2.1 versus UAS control). n = 12–18/set for body wall, 22–27/set for guts. (J) Larval neuroanatomy of the two subsets of insulin-producing neurons: Ilp2, Ilp3, and Ilp5 (in green) are released from the brain mNSCs into the circulation. Ilp7-producing neurons located in the posterior segments of the VNC (in red) send long axons that exit in the posterior nerves that innervate both sides of the hindgut. (K) The two hindgut nerves (labeled in red with the broad neuronal marker 22C10) are found in close proximity to the posterior visceral tracheal branches in the posterior hindgut of a 1st-instar larva (visualized using a membrane-tagged GFP expressed from the pan-tracheal driver btl-GAL4). Phalloidin (in blue) was used to highlight the visceral muscles. (L) Transmission electron microscopy of a posterior hindgut cross-section highlighting the proximity between the hindgut nerve axons (highlighted in red) and tracheae (in green). Scale bars, 10 μm in all images except for (A), (D), and (G), 100 μm and (L), 2,000 nm. See also Figure S4.
Figure S4
Figure S4
Differential Regulation of Hindgut Tracheae by the Two Subsets of Insulin-Producing Neurons, Related to Figure 3 (A–B) Representative terminal tracheation in well-fed control larvae. The specific gut areas are boxed in the cartoons: anterior hindgut (A) and mid-hindgut (B). (C–D) Reduced branching is apparent in equivalent areas in well-fed and genetically matched Ilp2,3,5 mutants. Quantifications for each tracheal subset are shown below each column. p < 0.0001 for both anterior hindgut and mid-hindgut, n = 15–31/set. (E–F) Representative terminal tracheation in the same body regions of well-fed larvae upon silencing of the hindgut-innervating Ilp7 neurons. No effect is apparent in the anterior hindgut (E), but the tracheal branching in the mid-hindgut is significantly reduced (F). For mid-hindgut: p < 0.0001 (Ilp7 > kir2.1 versus GAL4 control), p < 0.0001 (Ilp7 > kir2.1 versus UAS control), n = 17–27/set for both anterior and mid-hindgut. Scale bars, 10 μm.
Figure 4
Figure 4
Regional Regulation of Intestinal Tracheae by Multiple Ilp and Pdf Neuropeptides (A) Expression of Ilp7 (green) and Pdf (red) neuropeptides in a 1st-instar VNC. Note the cell bodies in the posterior-most segments (to the right). DAPI (in blue) was used to visualize the CNS. Anterior is to the left. (B) Higher magnification image of these posterior cell bodies: four of the eight Ilp7-expressing neurons (those located in the two posterior-most segments) coexpress Pdf. Pdf is also expressed by four additional neurons in these segments. Anterior is to the top. (C) Regional expression of the Ilp7 and Pdf peptides produced by the neurons in (B) in a 2nd-instar hindgut. Anterior is to the left, and the visceral muscles are highlighted in blue with phalloidin. Both peptides are present in varicosities along the hindgut nerves, but the anterior-most nerve endings are only positive for Pdf. (D–F) Representative hindgut tracheation in well-fed control larvae. The specific gut regions are boxed in the cartoons: anterior (D), mid- (E), and posterior hindgut (F). (G–I) Ilp7 mutation does not affect branching in the anterior or posterior hindgut but results in mildly reduced branching in the mid-hindgut. (J–L) A severe reduction in branching is apparent in the entire hindgut of mutants lacking Ilp7 as well the systemic Ilp2, Ilp3, and Ilp5 peptides. (M–O) Pdf mutation does not affect branching in the anterior hindgut (M) or posterior hindgut (O) but leads to reduced tracheal growth in the mid-hindgut (N). (P–R) Downregulation of the Pdf receptor specifically in tracheal terminal cells using DSRF-GAL4 does not affect branching in the anterior hindgut (P) or posterior hindgut (R) but leads to significantly reduced growth in the mid-hindgut (Q). (S–U) The intestinal tracheal coverage in double mutants lacking both Pdf and Ilp7 peptides is indistinguishable from that of control flies in the anterior hindgut (S), but it is strongly reduced in both the mid-hindgut (T) and posterior hindgut (U). See also Figure S5 for quantifications and Figure 7 for a summary of this regional regulation of tracheae by different peptides. Scale bars, 10 μm in all images except for (A), (B), and (C), 100 μm, 50 μm, and 100 μm, respectively.
Figure S5
Figure S5
Quantifications of Phenotypes Resulting from Ilp and/or Pdf Mutation and from Pdfr Tracheae-Specific Downregulation, Related to Figure 4 (A–C) Ilp7 mutation does not affect tracheal growth in anterior hindgut (A), or posterior hindgut (C) when compared to genetically matched control flies, but has a small effect on the tracheae of the mid-hindgut. By contrast, tracheal branching is significantly reduced in all three portions in quadruple mutants lacking Ilp7 and mNSC-derived Ilp2, Ilp3 and Ilp5. For anterior hindgut: p < 0.0001 (Ilp2,3,5,7 mutants versus either Ilp7 or w mutants). For mid-hindgut: p < 0.001 (Ilp7 mutants versus w) and p < 0.0001 (Ilp2,3,5,7 mutants versus either Ilp7 or w mutants). For posterior hindgut: p = 0.002 (Ilp2,3,5 mutants only versus w mutants). n = 10–23/set for all three gut regions. (D–F) The tracheal branching of Pdf mutants is not significantly different from genetically matched controls in the anterior hindgut (D) or posterior hindgut (F), but it is reduced in the mid-hindgut (E, p < 0.0001). n = 14–18/set for all three gut regions. (G–I) Downregulation of the Pdf receptor specifically in tracheal terminal cells using DSRF-GAL4 does not affect branching in the anterior hindgut (G) or posterior hindgut (I), but leads to significantly reduced growth in the mid-hindgut (H, p = 0.005 (DSRF>Pdfr-RNAi versus GAL4 control) and p = 0.002 (DSRF>Pdfr-RNAi versus UAS control). n = 10-15/set for all three gut regions. (J–L) The intestinal tracheal branching of double mutants lacking both Pdf and Ilp7 peptides is indistinguishable from that of control flies in the anterior hindgut (J), but it is reduced in both the mid-hindgut (K, p < 0.0001) and posterior hindgut (L, p = 0.014). n = 10–12 in all three gut regions.
Figure 5
Figure 5
Regulation of Ilp7 Neuronal Activity by Nutrients and Hypoxia, and Its Effect on Tracheal Branching (A) Exposure to yeast leads to a transient Ca2+ rise in Ilp7 neurons. Activity returns to basal levels after one minute. No such response is observed in control Va neurons. (B) A switch from 21% to 1% ambient O2 elicits a rapid rise in Ca2+ in Ilp7 neurons that persists while O2 is low. Upon return to normoxia, the basal activity of the Ilp7 neurons is immediately abrogated. No Ca2+ rise is triggered in control Va neurons, which display a subtle drop in Ca2+ levels in response to hypoxia, as has previously been observed for different types of neurons in various species (Cheung et al., 2006, Fujiwara et al., 1987, Krnjević, 1999). Error bars denote SEM. (C and D) False color-coded single frames depicting GCaMP fluorescence in representative movies illustrating the response to yeast (C) or hypoxia (D) observed in Ilp7 neuronal cell bodies. Yellow/white indicates strong responses, red, low Ca2+ (false color scale is shown to the left). (E and F) 25°C thermogenetic activation of the TrpA1 channel expressed in Ilp7 neurons through larval development results in increased tracheal coverage of the midgut (F) relative to controls (E for GAL4 control). Quantifications are displayed to the right of these two panels (p < 0.001 versus GAL4 control, p < 0.0001 versus UAS control, n = 23-27/set). Scale bars, 25 μm (C) and (D) or 10 μm (E) and (F). See also Figure S6.
Figure S6
Figure S6
Dynamics of Ilp7 Neuronal Activation in Response to Nutrients and Hypoxia, Related to Figure 5 (A) Single-neuron traces for yeast-evoked Ca2+ responses in Ilp7 neurons. While most neurons respond by increasing the frequency and amplitude of Ca2+ spikes, a subset of them respond in a more tonic fashion. (B) Single-neuron traces for O2-evoked Ca2+ responses in Ilp7 neurons. Some neurons respond completely tonically, while others respond chiefly with Ca2+ transients. (C) Ilp7 neuron traces from a larva exposed to repeated 2 min cycles of 21% and 1% O2. Each repeat stimulation with 1% O2 causes a very similar response, indicating that the cells neither habituate to the hypoxic stimulus nor become unable to respond.
Figure 6
Figure 6
Distinct Effects on Energy Homeostasis Resulting from Pan-Tracheal or Gut-Specific Reductions in Tracheal Terminal Branching (A) Reduced growth of most tracheal terminal cells (achieved using DSRF>btl-RNAi) does not affect the time between egg laying and pupation (only the two controls are significantly different from one another, p < 0.001, n = 40 larvae/set). (B) This genetic manipulation leads to shorter-lived adult male flies in the presence of nutritious food (p < 0.0001 for all three comparisons, n = 70–120 flies/set). (C) DSRF>btl-RNAi larvae have an increased length to width ratio (p < 0.001 versus GAL4 control, p < 0.0001 versus UAS control, n = 30 samples/set, total 300 larvae/set). (D) They also have a reduced fat/protein content ratio (p < 0.0001 versus GAL4 control and p = 0.013 versus UAS control, n = 19 samples/set, total 190 larvae/set). (E) An increase in free glycerol is also apparent in their hemolymph (p = 0.002 versus GAL4 control, p < 0.001 versus UAS control, n = 13 samples/set, total 130 larvae/set). (F) A gut-specific reduction in tracheal terminal cell growth (achieved using DSRF>InR-RNAi) does not affect the survival of adult male flies in well-fed conditions (n = 60–140 flies/set). (G) The same genetic manipulation leads to enhanced survival when adult male flies are subject to nutrient restriction (p < 0.0001 versus either control, p < 0.001 GAL4 versus UAS controls, n = 110–120 flies/set). (H and I) The lipid stores of these adult males are relatively normal in well-fed conditions (H, p = 0.001 versus UAS control but not significant versus GAL4 control, p = 0.002 GAL4 versus UAS controls, n = 7 samples/set, total 70 flies/set), but they are more reduced than those of controls upon nutrient restriction (I, p = 0.002 versus either UAS or GAL4 controls, n = 7 samples/set, total 70 flies/set). See also Figure S7.
Figure S7
Figure S7
Additional Metabolic Quantifications Following Pan-Tracheal or Gut-Specific Reductions in Tracheal Terminal Branching, Related to Figure 6 (A) A reduction in the growth of most tracheal terminal cells (achieved using DSRF>btl-RNAi) does not affect the ratio between glucose and protein content (experimental flies are only marginally different from the UAS control, p = 0.011, n = 20/set). (B) The same manipulation does not affect the ratio between glycogen and protein content of whole 3rd-instar larvae (p < 0.0001 versus UAS control but not significant versus GAL4 control, p < 0.001 GAL4 control versus UAS control, n = 17/set). (C) The amount of trehalose in their hemolymph is also unaffected (p < 0.001 versus GAL4 control but not significant versus UAS control, p < 0.0001 GAL4 control versus UAS control, n = 17/set). (D–F) Reduction of tracheal terminal growth specifically in the gut (achieved using DSRF>InR-RNAi) has glycogen/protein ratio (E, n = 18/set) and hemolymph trehalose (F, p = 0.004 versus GAL4 control but not significant versus UAS control, p = 0.002 GAL4 control versus UAS control, n = 14/set). (G) Although a trend toward a reduced TAG/protein ratio is observed in this genotype, this ratio is not significantly different from that of control flies (n = 14/set). (H) The amount of free glycerol in their hemolymph is also unaffected (n = 15/set). (I–L) As adults, these flies have glucose/protein (I and K) and glycogen/protein (J and L) ratios comparable to those of controls, both in well-fed (I and J) and nutrient-restricted (K and L) conditions (for K, p = 0.04 versus UAS control but not significant versus GAL4 control, n = 7/set).
Figure 7
Figure 7
Regional Specificity of the Gut Neuron/Tracheae Interactions (A) The different visceral tracheal terminal branches of the posterior midgut and hindgut, as visualized in green in a 3rd-instar larva using a pan-tracheal reporter to express a membrane-tagged GFP (btl>cd8-GFP). 22C10 staining (in red) highlights the two hindgut nerves and phalloidin (in blue) labels visceral muscles. (B) Illustration summarizing the different kinds of visceral tracheal terminal cells, their positioning relative to the hindgut nerves, and their regulation by systemic and paracrine neuropeptides at the 3rd-instar stage. In the posterior midgut and anterior hindgut, there is no apparent dorsoventral patterning with regard to the positioning of tracheal terminal cells. In these intestinal portions, tracheal terminal growth is exclusively under the control of the systemic mNSC-derived Ilps. In the mid-hindgut, the visceral tracheal terminal cells reach the hindgut from its ventral side and extend branches that eventually cover the dorsal domain. Mutation of Pdf or Ilp7 alone, as well as the triple Ilp2,3,5 mutation, all lead to reduced branching. In the posterior hindgut, where the Ilp7/Pdf axons abut the posterior hindgut tracheal branches, Ilp7 is partially redundant with Pdf and the systemic Ilps.

Comment in

References

    1. Adolphe J.L., Whiting S.J., Juurlink B.H., Thorpe L.U., Alcorn J. Health effects with consumption of the flax lignan secoisolariciresinol diglucoside. Br. J. Nutr. 2010;103:929–938. - PubMed
    1. Andersen D.S., Colombani J., Léopold P. Coordination of organ growth: principles and outstanding questions from the world of insects. Trends Cell Biol. 2013;23:336–344. - PubMed
    1. Asano A., Morimatsu M., Nikami H., Yoshida T., Saito M. Adrenergic activation of vascular endothelial growth factor mRNA expression in rat brown adipose tissue: implication in cold-induced angiogenesis. Biochem. J. 1997;328:179–183. - PMC - PubMed
    1. Belkacemi L., Nelson D.M., Desai M., Ross M.G. Maternal undernutrition influences placental-fetal development. Biol. Reprod. 2010;83:325–331. - PubMed
    1. Böhni R., Riesgo-Escovar J., Oldham S., Brogiolo W., Stocker H., Andruss B.F., Beckingham K., Hafen E. Autonomous control of cell and organ size by CHICO, a Drosophila homolog of vertebrate IRS1-4. Cell. 1999;97:865–875. - PubMed

Supplemental References

    1. Allan D.W., St Pierre S.E., Miguel-Aliaga I., Thor S. Specification of neuropeptide cell identity by the integration of retrograde BMP signaling and a combinatorial transcription factor code. Cell. 2003;113:73–86. - PubMed
    1. Baines R.A., Uhler J.P., Thompson A., Sweeney S.T., Bate M. Altered electrical properties in Drosophila neurons developing without synaptic transmission. J. Neurosci. 2001;21:1523–1531. - PMC - PubMed
    1. Busch K.E., Laurent P., Soltesz Z., Murphy R.J., Faivre O., Hedwig B., Thomas M., Smith H.L., de Bono M. Tonic signaling from O2 sensors sets neural circuit activity and behavioral state. Nat. Neurosci. 2012;15:581–591. - PMC - PubMed
    1. Hamada F.N., Rosenzweig M., Kang K., Pulver S.R., Ghezzi A., Jegla T.J., Garrity P.A. An internal thermal sensor controlling temperature preference in Drosophila. Nature. 2008;454:217–220. - PMC - PubMed
    1. Harrington D.P., Fleming T.R. A class of rank test procedures for censored survival data. Biometrika. 1982;69:553–566.

Publication types