. 2014 Jan 16;156(1-2):277-90.
doi: 10.1016/j.cell.2013.11.044.

Myelin membrane wrapping of CNS axons by PI(3,4,5)P3-dependent polarized growth at the inner tongue

Affiliations

Myelin membrane wrapping of CNS axons by PI(3,4,5)P3-dependent polarized growth at the inner tongue

Nicolas Snaidero et al. Cell. .

Abstract

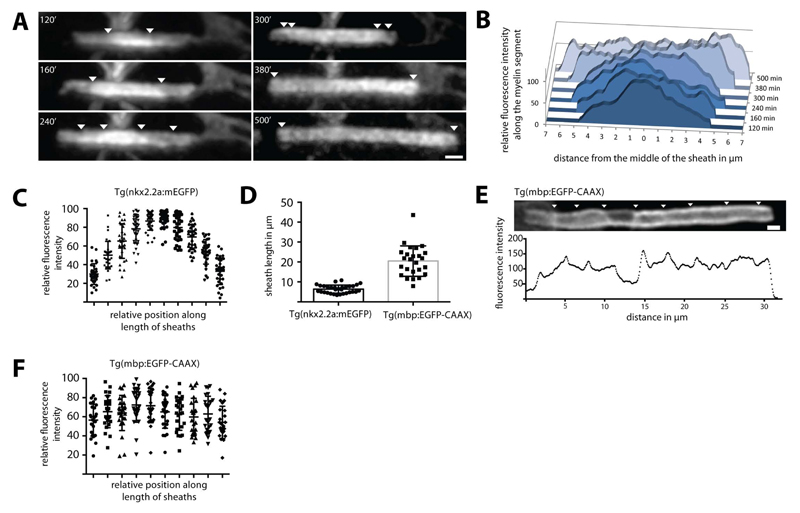
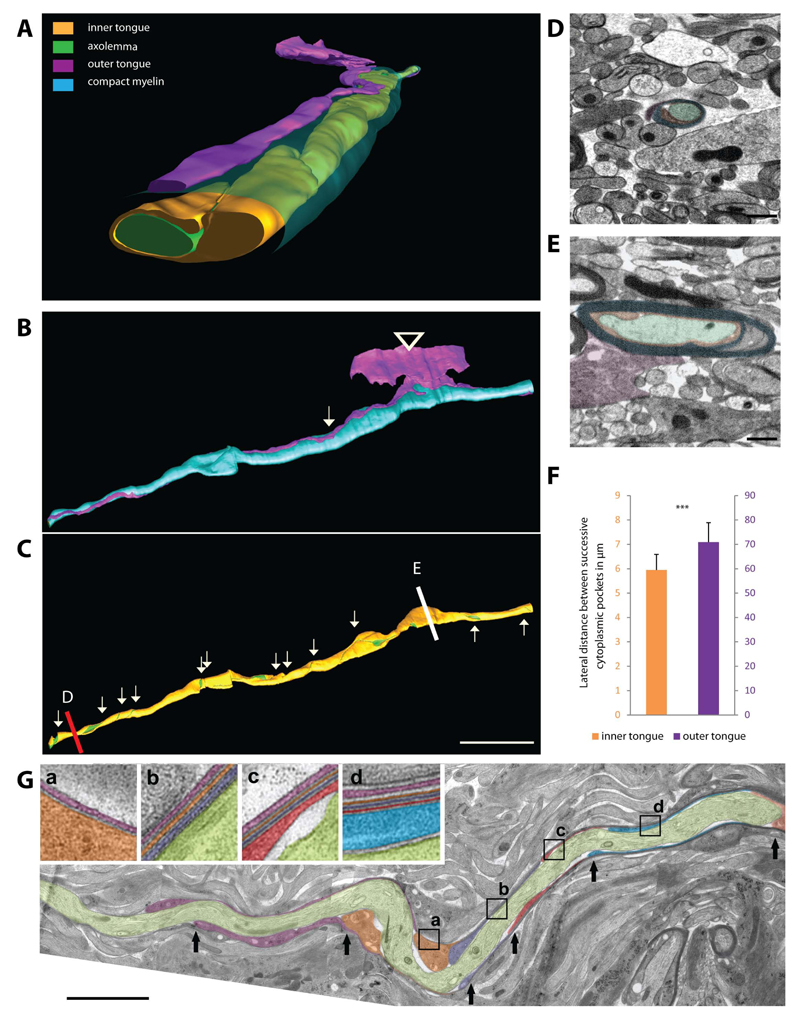
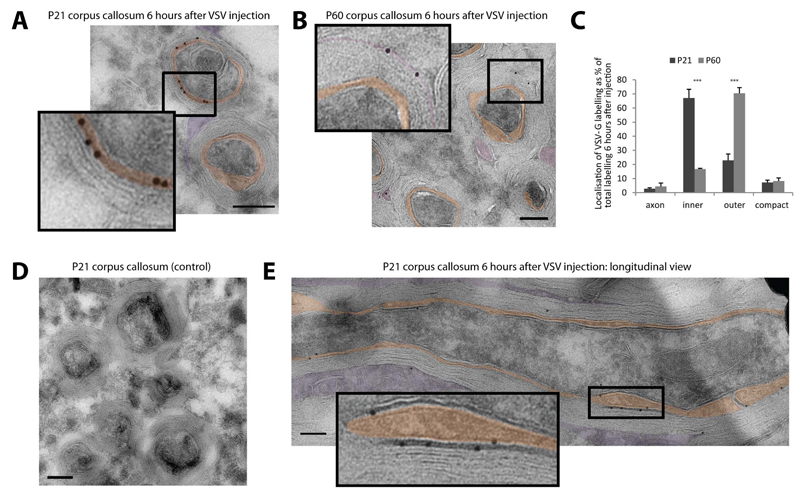
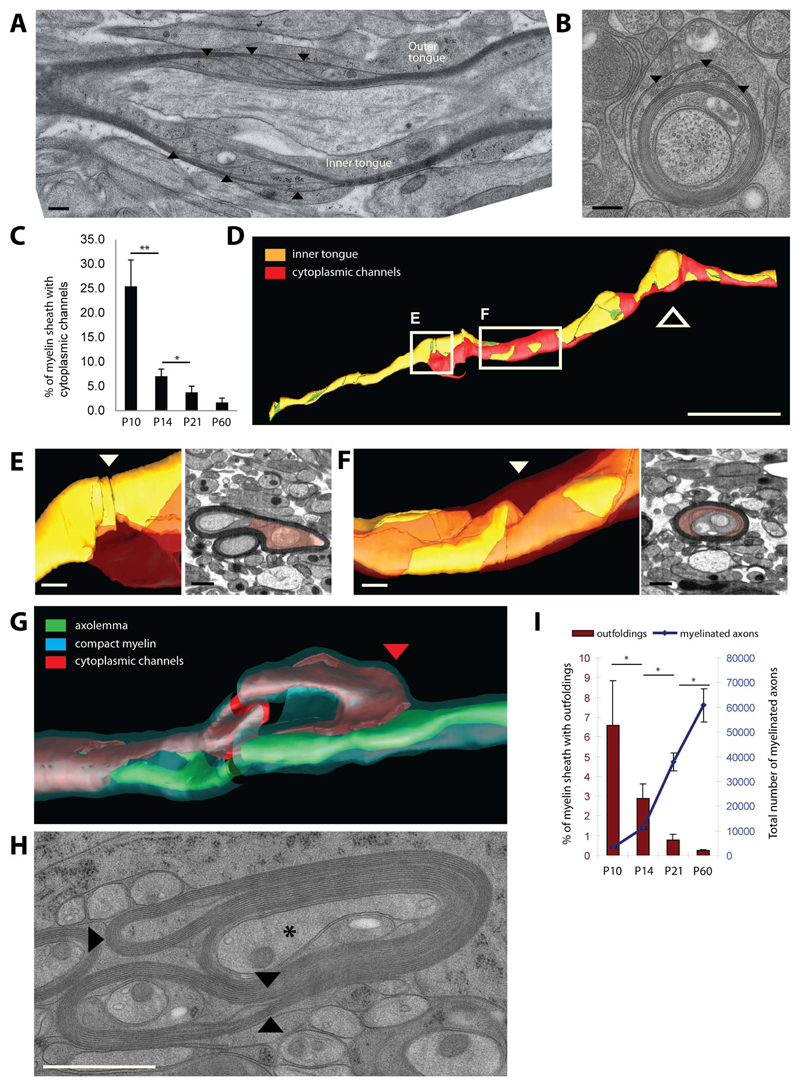
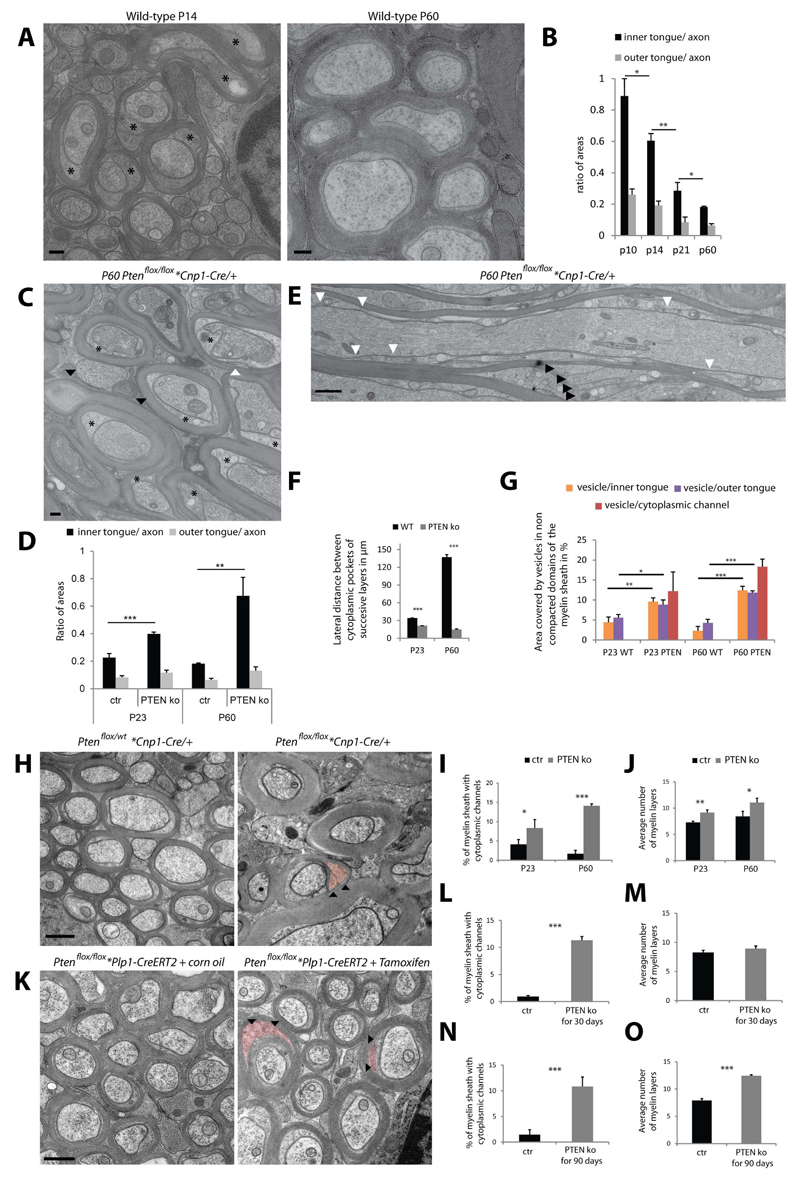
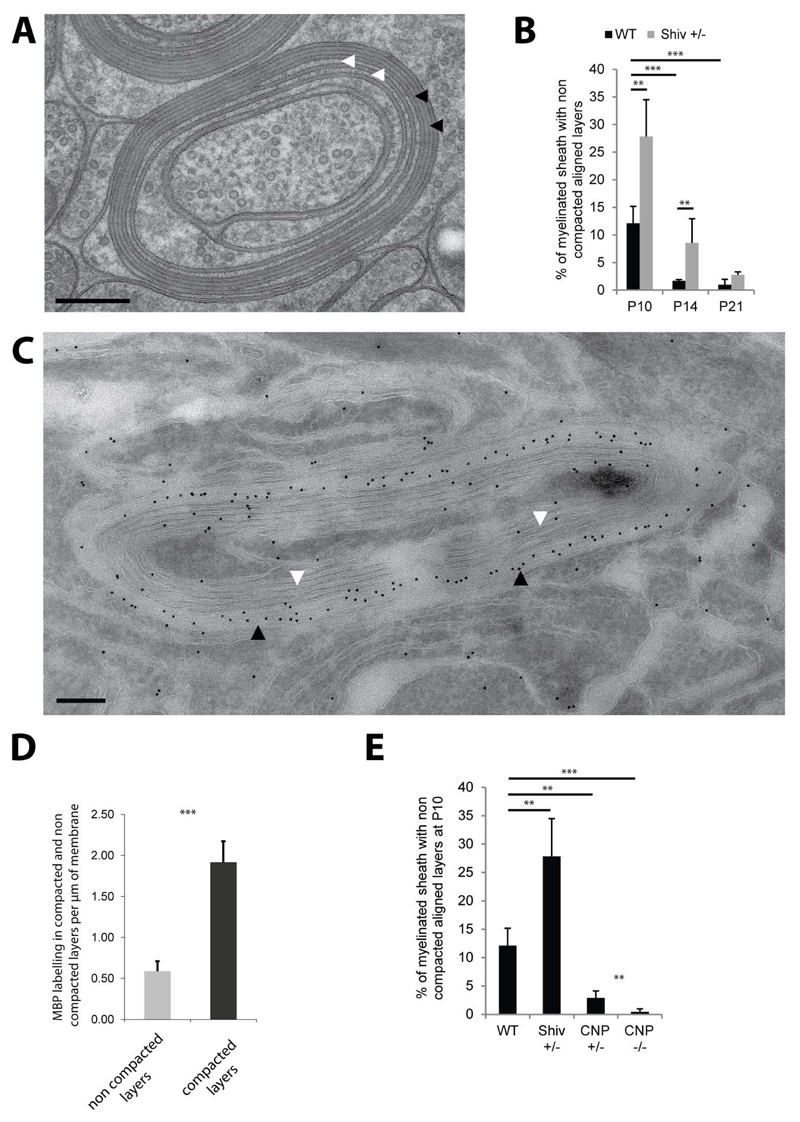
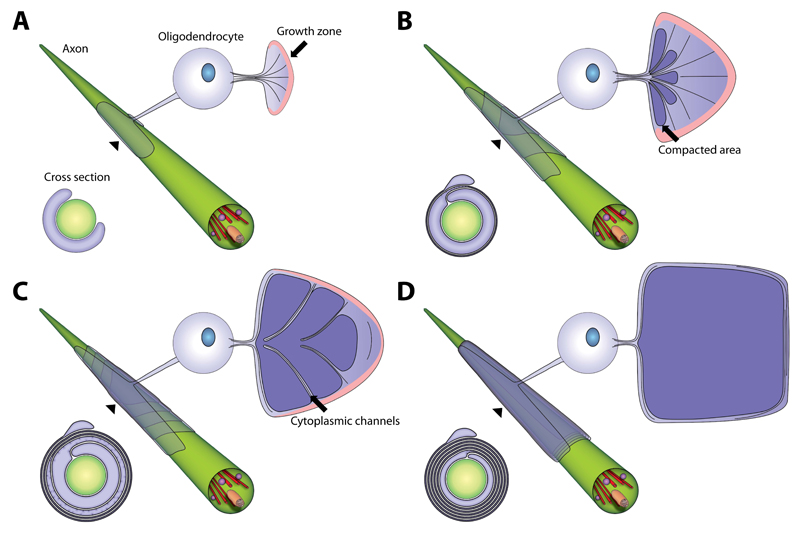
Central nervous system myelin is a multilayered membrane sheath generated by oligodendrocytes for rapid impulse propagation. However, the underlying mechanisms of myelin wrapping have remained unclear. Using an integrative approach of live imaging, electron microscopy, and genetics, we show that new myelin membranes are incorporated adjacent to the axon at the innermost tongue. Simultaneously, newly formed layers extend laterally, ultimately leading to the formation of a set of closely apposed paranodal loops. An elaborated system of cytoplasmic channels within the growing myelin sheath enables membrane trafficking to the leading edge. Most of these channels close with ongoing development but can be reopened in adults by experimentally raising phosphatidylinositol-(3,4,5)-triphosphate levels, which reinitiates myelin growth. Our model can explain assembly of myelin as a multilayered structure, abnormal myelin outfoldings in neurological disease, and plasticity of myelin biogenesis observed in adult life.


Figures

Figure 1
Figure 1. Live imaging of myelin formation in zebrafish.
(A) Visualization of the growth of a myelin segment in live Tg(nkx2.2a:meGFP) zebrafish for 500 minutes at 3 days postfertilization (dpf). The steps in fluorescence intensity are pointed with arrowheads. (B) Graphic representation of the relative fluorescence along the myelin segment over time shown in (A). (C) Graph showing relative fluorescence intensity measurements for 32 nkx2.2a:mEGFP expressing nascent myelin sheaths along their length. This indicates higher average intensity at the centre of sheaths relative to their ends. Bars show mean ± SD (D) Graph showing length of 32 myelin sheaths imaged using the nkx2.2a:mEGFP compared to 25 segments visualized in the mbp:EGFP-CAAX zebrafish line. (E) Lateral view of a mbp:EGFP-CAAX expressing mature myelin sheath at 4 dpf shows fluorescence intensity pattern along the maturing myelin segment. Arrowheads point to areas of higher fluorescence intensity. (F) Graph showing relative fluorescence intensity measurements for 25 mbp:EGFP-CAAX expressing mature myelin sheaths along their length. Scale bars= 1µm. See also Figure S1 and Movie S1.
Figure 2
Figure 2. Three-dimensional reconstruction of myelin structure in high-pressure frozen optic nerves.
(A,B,C) High-resolution 3D reconstruction of a forming myelin segment showing the structure of the inner and outer layers (green: axolemma, orange: inner tongue, cyan: compacted myelin, purple: outer tongue). (B) The outer tongue is connected to the oligodendrocyte cell body (arrowhead) and the position where the outer tongue has made one turn is marked by an arrow. (C) The inner tongue coils around the axon from a 2 wraps thick myelin sheath (red line; cross-section shown in D) up to 11 wraps (white line; cross-section shown in E). Every turn is indicated by an arrows pointing down; and by arrows pointing up where the inner tongue is unwinding towards the other end of the sheath. Scale bar= 10µm.(D) Cross-sectional image of the area indicated with a red line (myelin with 2 wraps). (E) Cross-sectional image of the area indicated with a white line (myelin with 11 wraps). (F) Average distance between 2 lateral cytoplasmic-rich edges of successive myelin layers of the inner and outer tongue. Bars show mean ± SD (n=3 animals with 45 different axons). (G) Representative myelin sheath of P10 mouse optic nerve obtained by serial sectioning of high-pressure frozen tissue and imaged by TEM. An arrow is pointing to the lateral edge of successive myelin layers; each in a different color. (a-d) In the enlarged areas the individual myelin layers are marked by different colors and followed along the segment; the position of the zoomed areas is shown as a box. Scale bar= 5µm. See also Figure S2 and Movie S2,3,4.
Figure 3
Figure 3. Tracking membrane trafficking using the vesicular stomatitis virus G protein in vivo.
(A-B) High-titer stocks of VSV were injected into the corpus callosum of P21 and P60 mice. The subcellular localization of VSV-G in the myelin sheath was determined by immunoelectron microscopy 6 hours after infection at P21 (A) and P60 (B) mice (orange: inner tongue, purple: outer tongue). (C) Quantification of the VSV-G labeling distribution within the different domains of the myelin sheath at P21 and P60. Bars show mean ± SD (n=3, 100 axon per animal, ***p < 0.001, t-test). (D) No background staining of the VSV-G antibody after control injections without virus into the corpus callosum at P21. (E) Localization of VSV-G at the inner layers in longitudinal section of P21 corpus callosum 6 hours after VSV injection. Scale bars= 200nm; gold size= 10 nm. See also Figure S3.
Figure 4
Figure 4. Cytoplasmic channels and myelin outfoldings appear transiently in developing myelin sheaths.
(A, B) Longitudinal and cross sections of P10 optic nerve myelinated axons showing cytoplasmic channels within the compact myelin indicated by arrow heads. Scale bar=200nm. (C) Percent of myelin sheaths with cytoplasmic channels at P10, P14, P21 and P60. Bars show mean ± SD (n=3, 200 axons per animal, *p < 0.05 **p < 0.01, t-test). (D) Three dimensional organisation of the cytoplasmic channels (red: cytopalsmic channels, orange: inner tongue, green: axolemma) along the myelin sheath (thick arrow signals the location the oligodendrocyte process). Scale bar= 10µm. (E,F) Model and electron microscopy views of the area where the cytoplasmic channels (red) reach the inner tongue (arrowhead: position of the EM views). Scale bar= 500nm. (G) Spatial organization of cytoplasmic channels (red) running inside the outfolding and reaching the inner tongue at the lateral end of the outfolding (red arrow head). (H) Cross section morphology of myelin outfolding (arrowheads) in P10 high pressure frozen optic nerve (star labels the axon with a normal myelin sheath). (I) Amount of myelin outfoldings in myelinated fibers in optic nerves between P10 and P60. Bars show mean ± SD (n=3, 200-800 axons per animal, *p < 0.05, t-test). See also Figure S4.
Figure 5
Figure 5. Regulation of cytoplasmic channels, inner tongue size and myelin sheath growth by PI(3,4,5)P3 levels.
(A) Electron micrograph of high pressure frozen wild-type optic nerve showing larger inner tongue at P14 (stars) as compared to P60. Scale bar= 200nm. (B) Relative size of the inner and outer tongue area to the axonal area between P10 and P60. (C) Electron micrograph of P60 conditional Pten deficient mice (Pten KO; Ptenflox/flox *Cnp1- Cre/+) optic nerve showing enlarged inner tongues (stars). (D) Relative size of the inner and outer tongue area to the axonal area at P23 and P60 for the Pten mutant (wild type P60 data from panel B for comparison). (E) Longitudinal view of P60 Pten mutant optic nerve show the short lateral distances between successive inner layers (white arrow heads) and the large cytoplasmic channels within the compact myelin (black arrow heads). (F) Average distance between 2 lateral cytoplasmic-rich edges of successive myelin layers at P23 and P60 for the Pten mutant compared to wild-type. (G) Quantification of the area covered by vesicular structures in Pten deficient animals as compared to wild-type at P23 and P60 (data used for wild-type are from S4). (H) Electron micrograph of myelin from conditional Pten deficient mice (Pten KO; Ptenflox/flox *Cnp1-Cre/+) optic nerve compared to the control (Control; Ptenflox/wt *Cnp1-Cre/+) at P60 (arrowheads pointing at colored cytoplasmic channels). (I,J) Amount of myelin sheaths with cytoplasmic channels in cross-sections and measurement of the myelin thickness in control and Pten mutant optic nerves. (K) Electron micrograph of optic nerve myelin after tamoxifen-induced conditional inactivation for 4 weeks of Ptenflox/flox*Plp1-CreERT2 mice in the adult (P60) compared to the control (arrowhead pointing at colored cytoplasmic channels). Scale bar= 500nm. (L-O) Amount of myelin sheaths with cytoplasmic channels in cross-sections and measurement of the myelin thickness in control and after tamoxifen-induced conditional inactivation of Pten for 4 weeks (L,M) and for 12 weeks (N,O). Bars shown in all graphs mean ± SD (n=3, 100-200 axons per animal, 20 axons per animals for F; *p < 0.05, **p < 0.01, ***p < 0.001, t-test). See also Figure S5.
Figure 6
Figure 6. Myelin compaction from the outer to the inner layers is regulated by MBP and CNP levels.
(A) Cross section of P10 wild-type myelin sheath with outer layers compacted (black arrows) and inner layers non-compacted (white arrows). (B) Amount of myelinated axons with non-compacted layers in wild-type and shiverer heterozygote (Shiv +/-) optic nerves between P10 and P21. (C) Immunoelectron micrograph for MBP of a partially compacted myelin sheath of P10 wild-type optic nerve (black arrows pointing at compacted layers and white arrows to the non-compacted layers). Scale bars= 200nm. Gold size= 10nm. (D) Quantification of MBP labeling per µm of membrane in the compacted and non-compacted layers of P10 wild-type myelin sheaths. (E) Amount of myelinated axons with non-compacted layers in wild-type, Shiv +/-, CNP +/- and CNP -/- at P10. Bars show mean ± SD (n=3-5, 120-200 axons per animal, **p < 0.01, ***p < 0.001, t-test). See also Figure S6.
Figure 7
Figure 7. Model of myelin biogenesis in the CNS.
(A-D) Model of a developing myelin sheath in a wrapped, unwrapped and cross section view. The unwrapped representation shows the geometry and the development of the sheath and the localization of the cytoplasmic channels, which connect the cell body and the growth zone at the inner tongue. The growth zone is colored in pink and compacted myelin in dark violet. The wrapped representation shows the position of the layers when wrapped around the axon. The cross sections show the state of compaction during myelin growth. See also Figure S7 and Movie S5.

Comment in

Similar articles

Cited by

References

    1. Aggarwal S, Snaidero N, Pahler G, Frey S, Sanchez P, Zweckstetter M, Janshoff A, Schneider A, Weil MT, Schaap IA, et al. Myelin membrane assembly is driven by a phase transition of myelin basic proteins into a cohesive protein meshwork. PLoS Biol. 2013;11:e1001577. - PMC - PubMed
    1. Ainger K, Avossa D, Morgan F, Hill SJ, Barry C, Barbarese E, Carson JH. Transport and localization of exogenous myelin basic protein mRNA microinjected into oligodendrocytes. J Cell Biol. 1993;123:431–441. - PMC - PubMed
    1. Barres BA, Raff MC. Proliferation of oligodendrocyte precursor cells depends on electrical activity in axons. Nature. 1993;361:258–260. - PubMed
    1. Ben Geren B. The formation from the Schwann cell surface of myelin in the peripheral nerves of chick embryos. Exp Cell Res. 1954;7:558–562. - PubMed
    1. Blakemore WF. Schmidt-Lantermann incisures in the central nervous system. J Ultrastruct Res. 1969;29:496–498. - PubMed

Publication types