. 2014 Jan 16;156(1-2):304-16.
doi: 10.1016/j.cell.2013.12.021.

Ablation of PRDM16 and beige adipose causes metabolic dysfunction and a subcutaneous to visceral fat switch

Affiliations

Ablation of PRDM16 and beige adipose causes metabolic dysfunction and a subcutaneous to visceral fat switch

Paul Cohen et al. Cell. .

Abstract

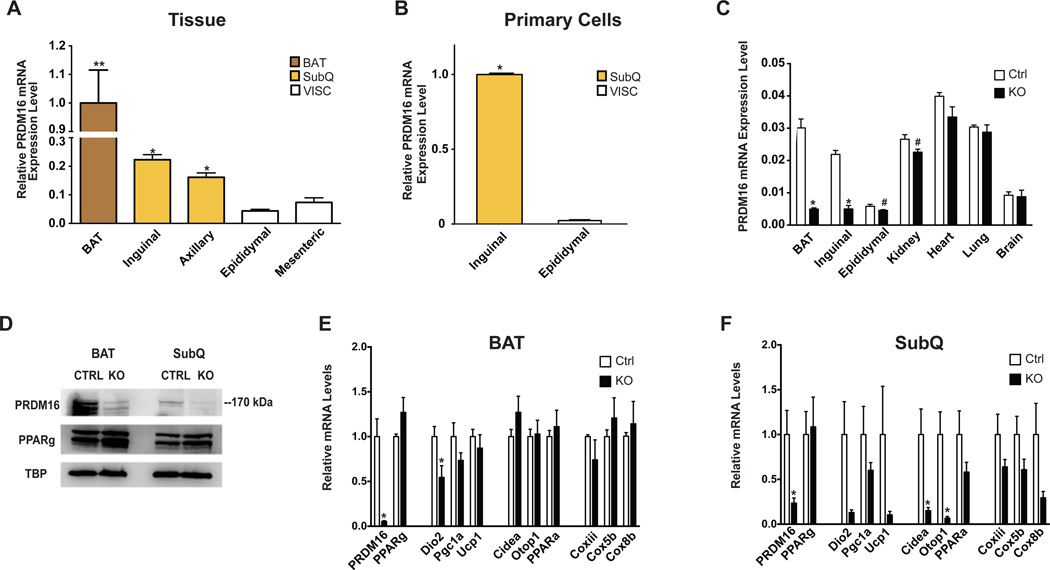
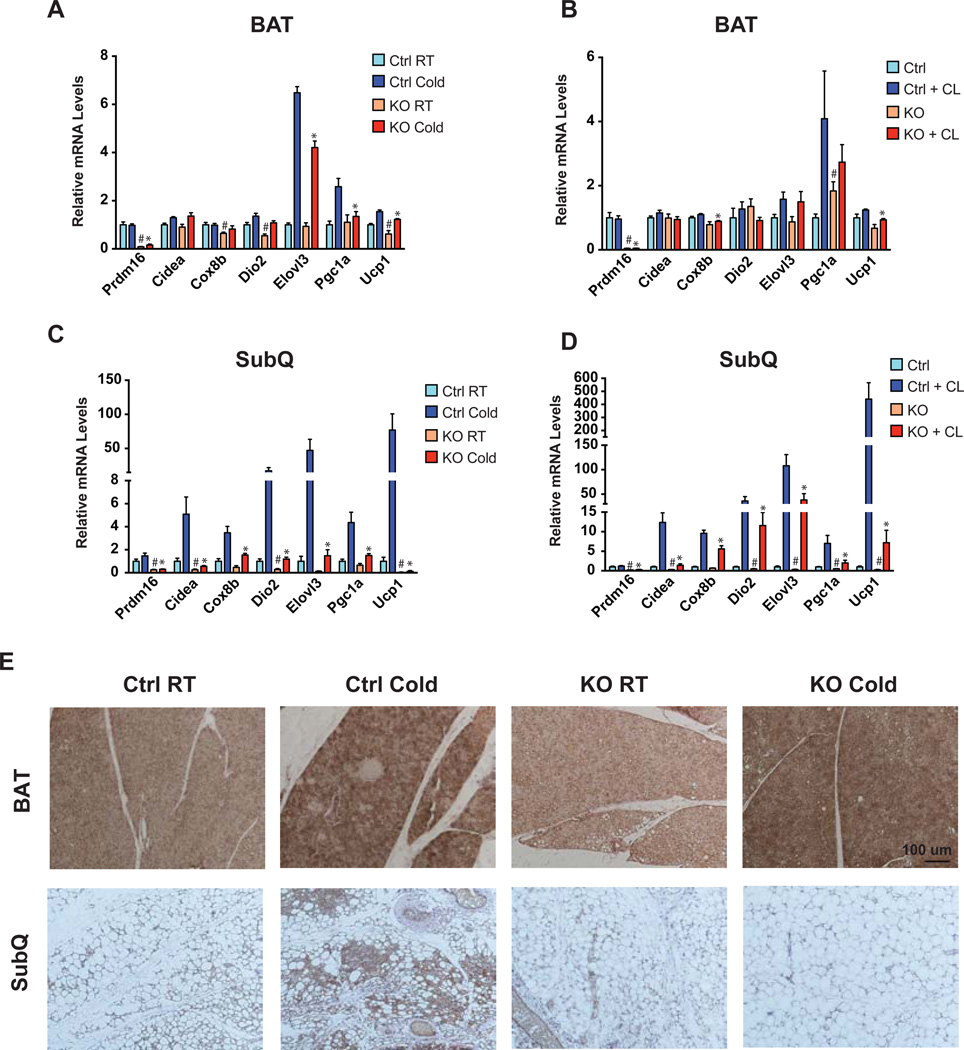
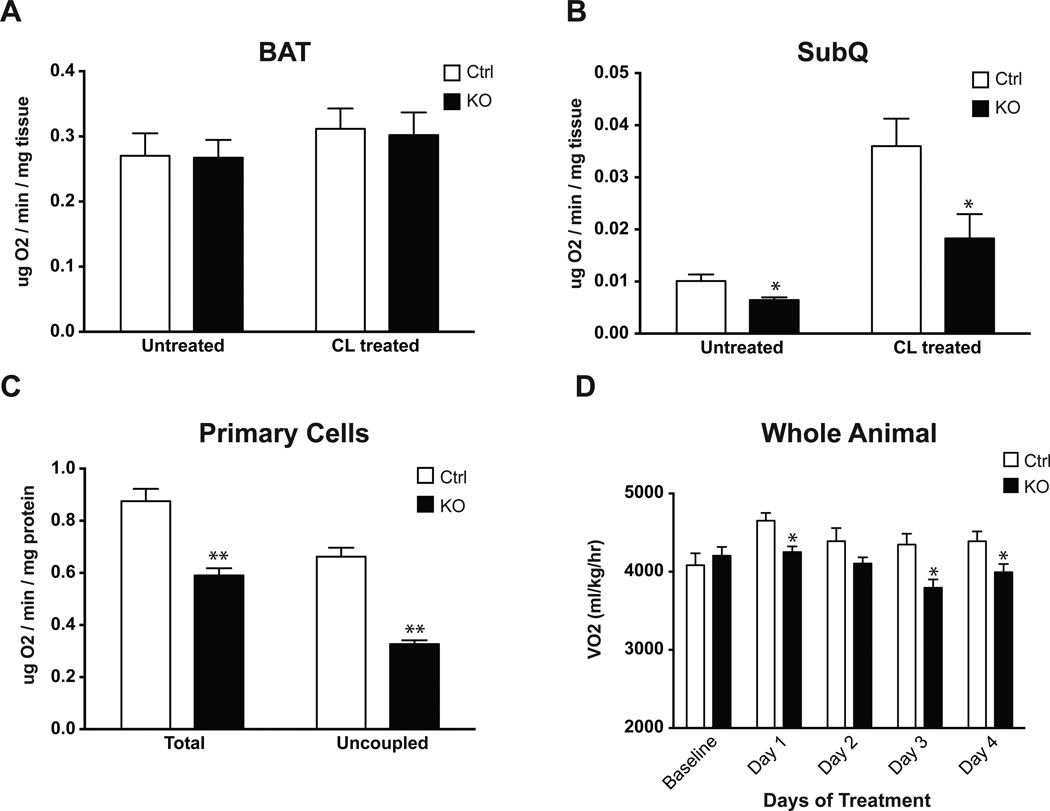
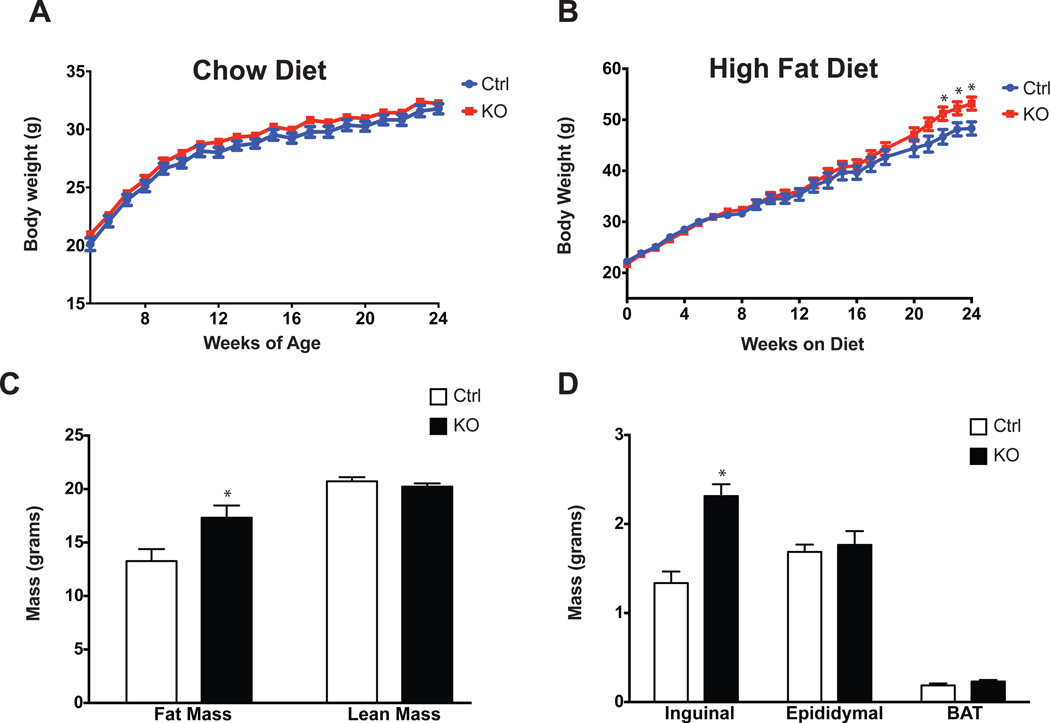
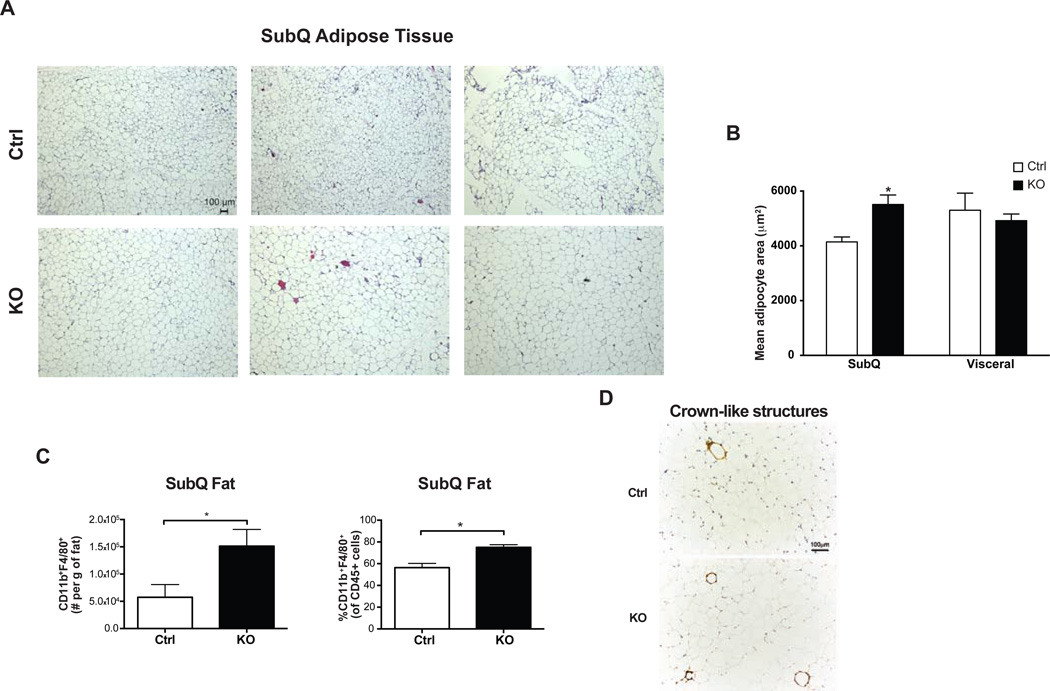
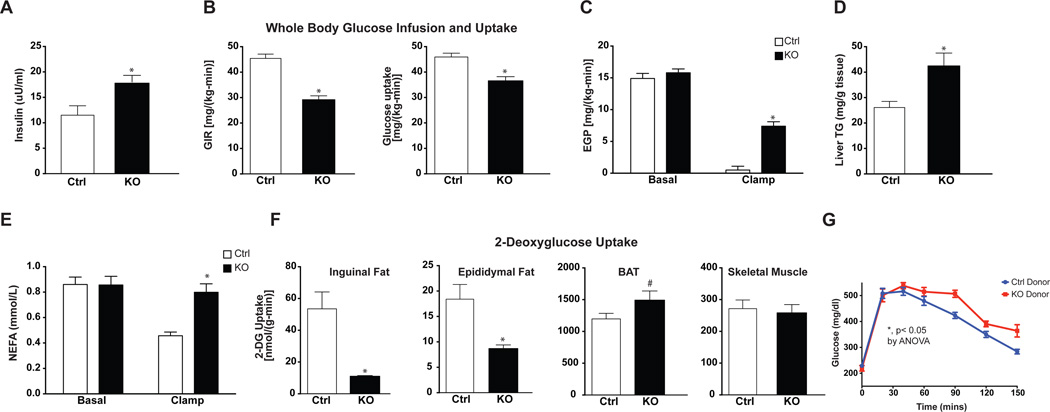
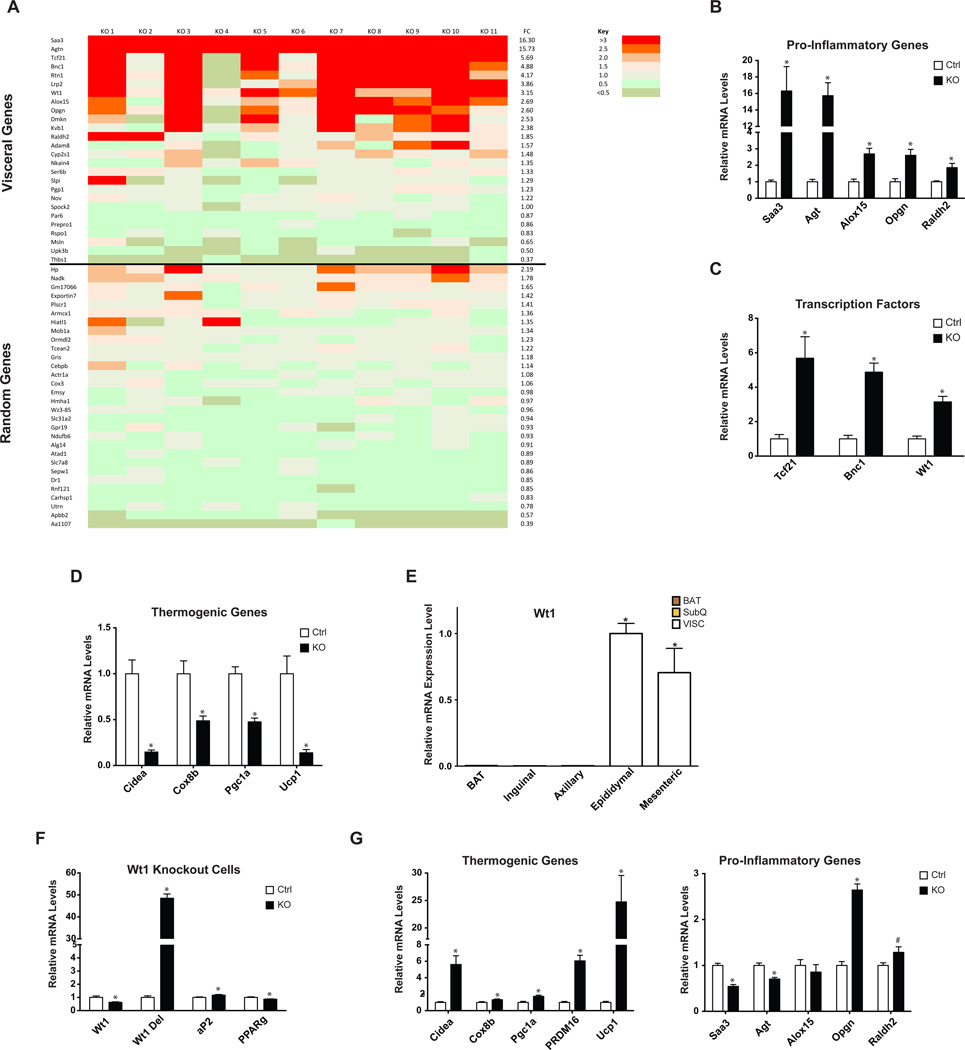
A clear relationship exists between visceral obesity and type 2 diabetes, whereas subcutaneous obesity is comparatively benign. Here, we show that adipocyte-specific deletion of the coregulatory protein PRDM16 caused minimal effects on classical brown fat but markedly inhibited beige adipocyte function in subcutaneous fat following cold exposure or β3-agonist treatment. These animals developed obesity on a high-fat diet, with severe insulin resistance and hepatic steatosis. They also showed altered fat distribution with markedly increased subcutaneous adiposity. Subcutaneous adipose tissue in mutant mice acquired many key properties of visceral fat, including decreased thermogenic and increased inflammatory gene expression and increased macrophage accumulation. Transplantation of subcutaneous fat into mice with diet-induced obesity showed a loss of metabolic benefit when tissues were derived from PRDM16 mutant animals. These findings indicate that PRDM16 and beige adipocytes are required for the "browning" of white fat and the healthful effects of subcutaneous adipose tissue.


Figures

Figure 1
Figure 1. PRDM16 Deletion in Adipocytes Results in Altered Subcutaneous Adipose Tissue Gene Expression
(A) and (B) qPCR analysis of Prdm16 mRNA from multiple adipose tissues from 8–10 week old, male wild-type mice (n=9), normalized to mRNA expression in BAT (A) or from in vitro differentiated primary adipocytes, normalized to mRNA expression in inguinal cells (n=3) (B). (C) qPCR analysis of Prdm16 mRNA from multiple tissues from 6–8 week old male Adipo-PRDM16 KO mice (n=4) and controls (n=4). (D) PRDM16 protein in nuclear extracts from BAT or inguinal SubQ adipose tissue from Adipo-PRDM16 KO and controls. PPARγ and TBP protein are shown as controls. (E) and (F) Normalized gene expression of thermogenic, brown adipose, and mitochondrial genes in BAT (E) and SubQ adipose tissue (F) from Adipo-PRDM16 KO and control mice at RT. Mice were males, 6–8 weeks old, n=5 per group. Data are presented as mean ± SEM. *, p< 0.05. #, p=0.053 for kidney and 0.079 for epididymal fat. See also Figure S1.
Figure 2
Figure 2. PRDM16 Regulates Beige Adipose Thermogenic Gene Expression
(A–D) Normalized thermogenic gene expression in BAT (A and B) and SubQ adipose tissue (C and D) from Adipo-PRDM16 KO and control mice at RT and following 48 hours at 4°C (A and C) or following five daily injections of 1 mg/kg CL (B and D). Cold exposure was done with male 6–8 week old mice, n=5–6 per group. CL treatment was done with female 6–8 week old mice, n=5–6 per group. Data are presented as mean ± SEM. *, p< 0.05 KO vs. control cold exposed or CL treated. #, p< 0.05 KO vs. control room temperature or untreated. (E) Representative images from UCP1 immunohistochemistry on sections of interscapular BAT or inguinal SubQ adipose tissue from Adipo-PRDM16 KO and control mice at RT or following 48 hours at 4°C. Images are shown at 10x magnification. Scale bar =100 microns. See also Figure S2.
Figure 3
Figure 3. Altered Subcutaneous Adipose Tissue and Whole Body O2 Consumption in Adipo-PRDM16 KO Mice
(A and B) O2 consumption in brown (A) and SubQ adipose tissue (B) from control and Adipo-PRDM16 KO mice. Tissues from untreated animals and animals treated with 5 daily injections of 1 mg/kg CL were analyzed. CL treatment was done with female 6–8 week old mice, n=5–6 per group. (C) Total and uncoupled respiration in primary SubQ adipocytes from control and Adipo-PRDM16 KO mice. N=6 per group. (D) O2 consumption in 8–10 week old Adipo-PRDM16 KO and control male mice, n=8 per group. Data were recorded at baseline and for 6 hours following daily injection of 0.1 mg/kg CL. Data are presented as mean ± SEM. *, p< 0.05. **, p<0.001. See also Figure S3.
Figure 4
Figure 4. Obesity and Altered Fat Distribution in Adipo-PRDM16 KO Mice
(A and B) Body weights of Adipo-PRDM16 KO and control mice on standard chow (A) or HFD (B). HFD was started at 4 weeks of age. Experiments were done with male mice, n=12–15 per group. (C) Body composition of Adipo-PRDM16 KO and control mice following 16 weeks on HFD. N=12 for controls and N=19 for KOs. (D) Weights of individual fat pads from Adipo-PRDM16 KO and control mice following 18 weeks on HFD. N=11 per group. Data are presented as mean ± SEM. *, p< 0.05. See also Figure S4.
Figure 5
Figure 5. Increased Cell Size and Macrophage Accumulation in Subcutaneous Adipose Tissue from Adipo-PRDM16 KO Mice
(A and B) Cell size in inguinal SubQ adipose tissue from male Adipo-PRDM16 KO and control mice following 18 weeks on HFD. Representative images from hematoxylin and eosin (H&E) stained sections. Images are shown at 5x magnification. Scale bar =100um. (B). Mean adipocyte area from inguinal SubQ and epididymal VISC adipose tissue. N=3 per group. (C) Flow cytometry quantitation of CD11b+F4/80+ macrophages in SubQ adipose tissue from Adipo-PRDM16 KO and control mice following 6 weeks on HFD. (D) Morphological analysis for crown-like structures using Mac-2 staining from Adipo-PRDM16 KO and control mice following 6 weeks on HFD. For (C) and (D), experiments was done with male mice 8–10 weeks old at start of HFD, n=5–6 per group. Data are presented as mean ± SEM. *, p< 0.05. See also Figure S5.
Figure 6
Figure 6. Insulin Resistance, Hepatic Steatosis, and Altered Glucose Uptake in Adipo-PRDM16 KO Mice
(A–E) Hyperinsulinemic-euglycemic clamp studies on Adipo-PRDM16 KO and control mice after 6 weeks on HFD. (A) Fasting insulin levels. (B) Glucose infusion rate and whole body glucose uptake. (C) Basal and insulin-stimulated endogenous glucose production. (D) Liver triglyceride content. (E) Basal and insulin-stimulated levels of non-esterified fatty acids. (F) 2-deoxyglucose uptake in tissues from Adipo-PRDM16 KO and control mice. Data are presented as mean ± SEM. *, p< 0.05, # p= 0.09. Clamp studies were done with male mice, 8 weeks old at the start of HFD. N=7–8 per group. (G) Intraperitoneal glucose tolerance test (1.5 mg/kg) in male, high fat-fed recipients of Adipo-PRDM16 KO or control SubQ adipose tissue. The GTT was done 6 weeks following transplantation. N=6 per group. *, p <0.05 by ANOVA. Data are presented as mean ± SEM. See also Figure S6.
Figure 7
Figure 7. Induction of a Visceral Adipose Tissue Gene Expression Profile in Adipo-PRDM16 KO Subcutaneous Adipose Tissue
(A) Heat map showing relative expression of VISC selective and randomly selected genes in SubQ adipose tissue from Adipo-PRDM16 KO mice after 18 weeks on HFD. Each row depicts an individual gene. Each column depicts the expression in a KO sample relative to the average expression in control mice. Average fold change is indicated in the column to the right. Fold change for each individual sample is color-coded according to the key. (B) Normalized expression of pro-inflammatory genes and (C) transcription factors. (D) Normalized expression of thermogenic genes. For (A)–(D), gene expression was measured in male mice following 18 weeks HFD. N=11 per group. (E) qPCR analysis of Wt1 mRNA from multiple adipose tissues from 8–10 week old, male wild-type mice, normalized to mRNA expression in epididymal white adipose tissue. N=9 per group. (F–G) Normalized expression of Wt1 (F) and thermogenic and pro-inflammatory genes (G) in primary VISC Wt1lox/lox;cre+ adipocytes. N=6 per group. Data are presented as mean ± SEM. *, p< 0.05, #, p=0.058. See also Figure S7.

Similar articles

Cited by

References

    1. Angulo P. Nonalcoholic fatty liver disease. N. Engl. J. Med. 2002;346:1221–1231. - PubMed
    1. Bjork BC, Turbe-Doan A, Prysak M, Herron BJ, Beier DR. Prdm16 is required for normal palatogenesis in mice. Hum. Mol. Genet. 2010;19:774–789. - PMC - PubMed
    1. Butler AA, Kozak LP. A recurring problem with the analysis of energy expenditure in genetic models expressing lean and obese phenotypes. Diabetes. 2010;59:323–329. - PMC - PubMed
    1. Cipolletta D, Feuerer M, Li A, Kamei N, Lee J, Shoelson SE, Benoist C, Mathis D. PPAR-gamma is a major driver of the accumulation and phenotype of adipose tissue Treg cells. Nature. 2012;486:549–553. - PMC - PubMed
    1. Cypess AM, White AP, Vernochet C, Schulz TJ, Xue R, Sass CA, Huang TL, Roberts-Toler C, Weiner LS, Sze C, et al. Anatomical localization, gene expression profiling and functional characterization of adult human neck brown fat. Nat. Med. 2013;19:635–639. - PMC - PubMed

Publication types

Associated data