. 2014 Jan 16;156(1-2):343-58.
doi: 10.1016/j.cell.2013.10.058.

Leveraging cross-species transcription factor binding site patterns: from diabetes risk loci to disease mechanisms

Collaborators, Affiliations

Leveraging cross-species transcription factor binding site patterns: from diabetes risk loci to disease mechanisms

Melina Claussnitzer et al. Cell. .

Abstract

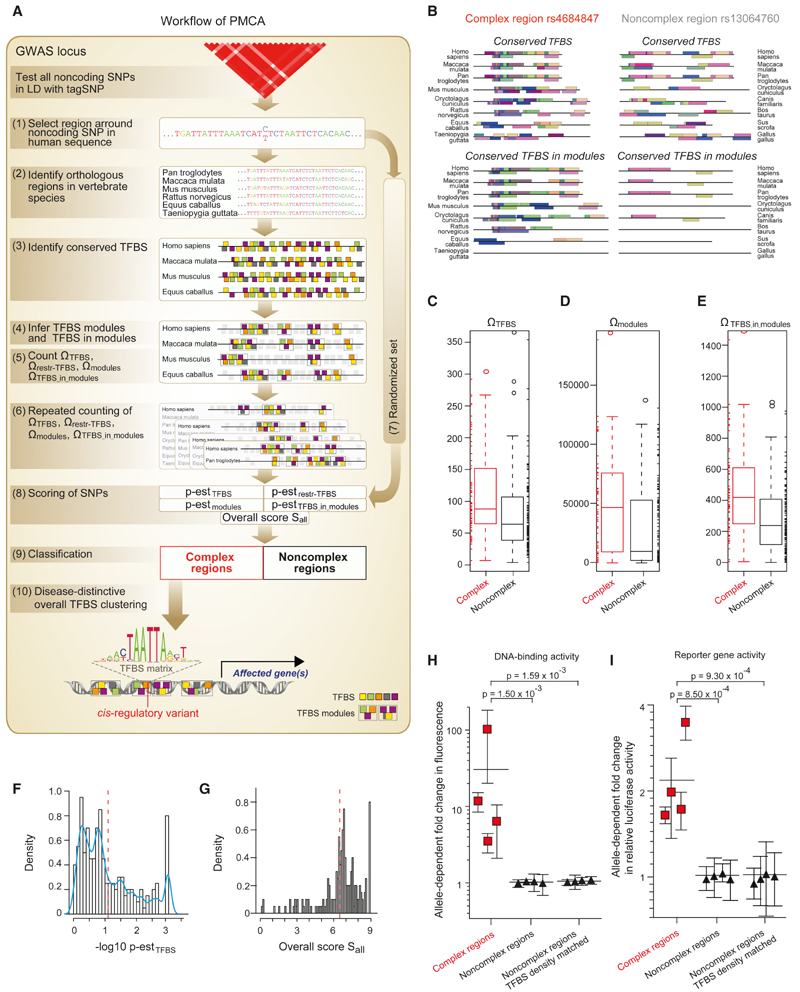
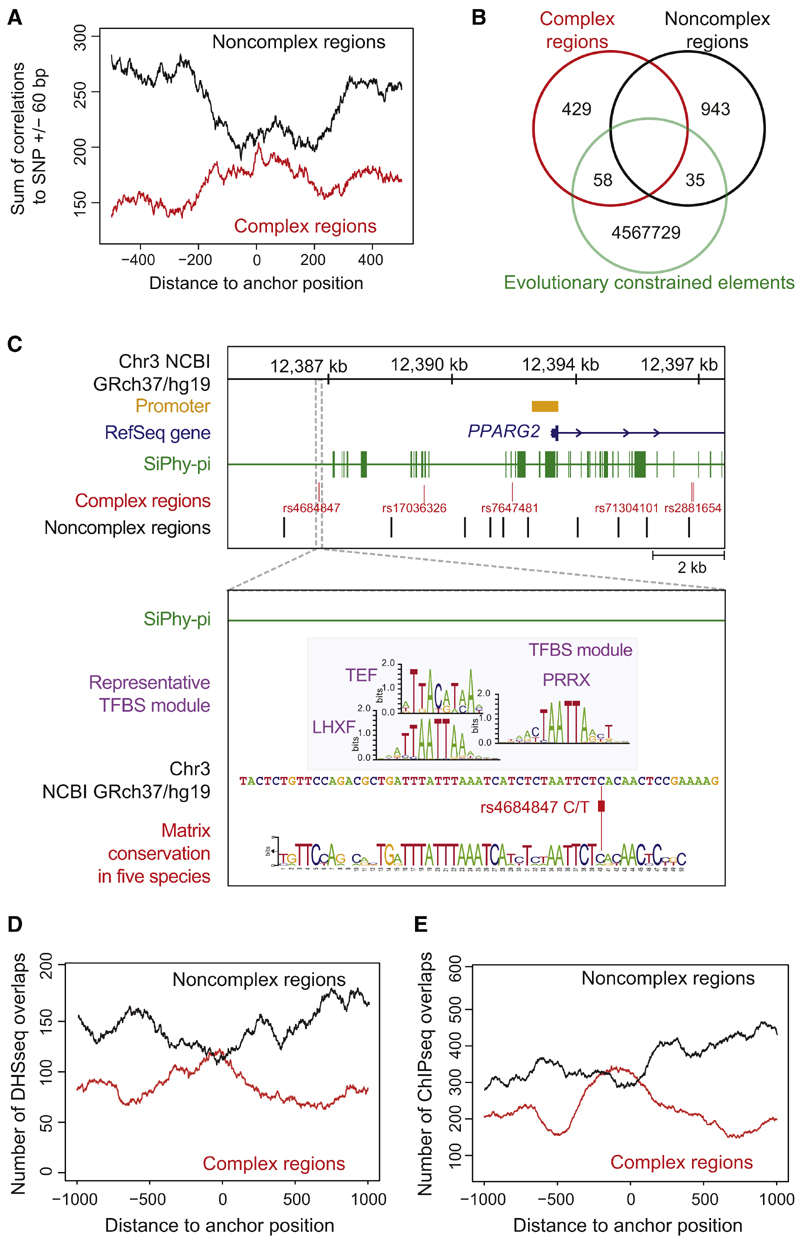
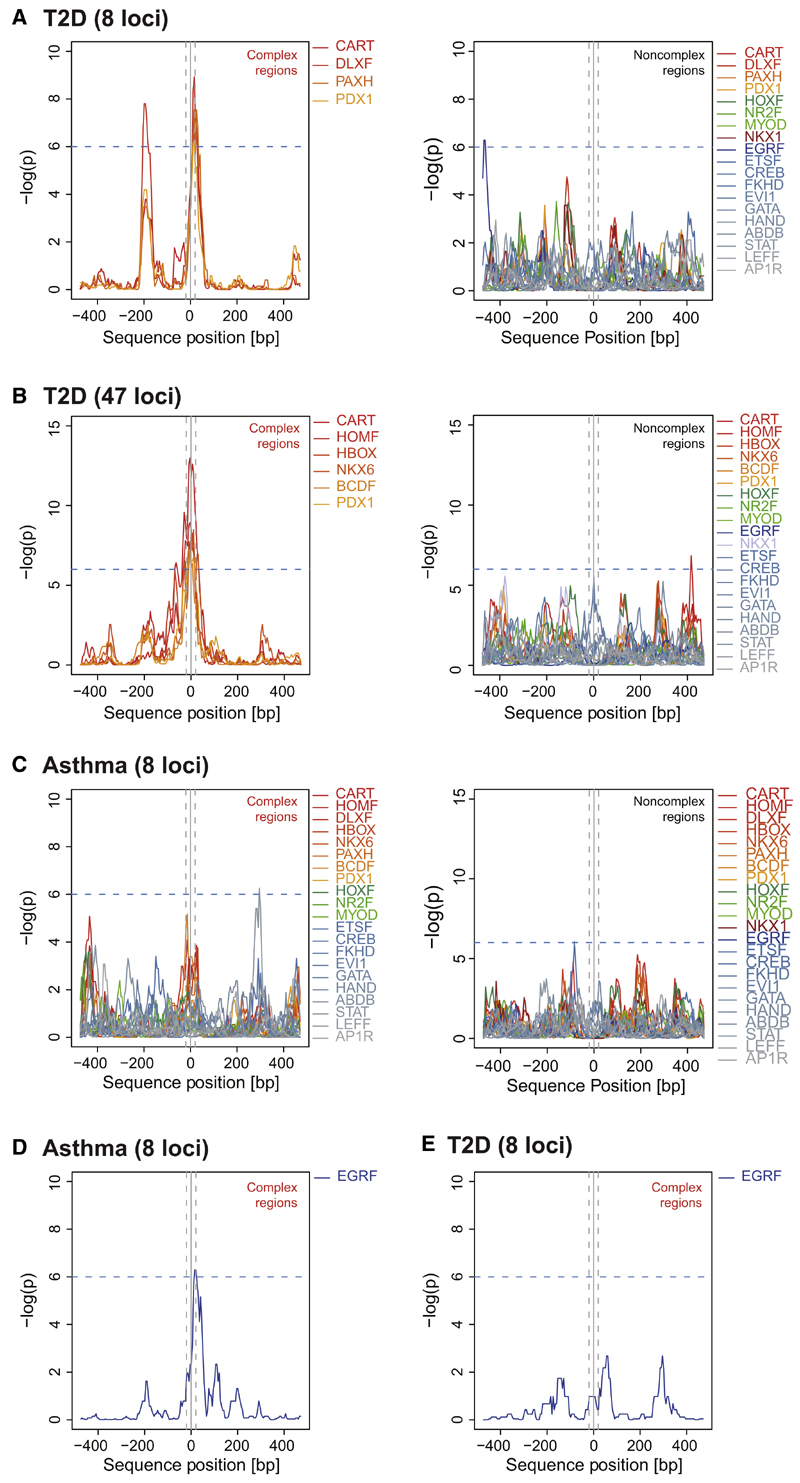
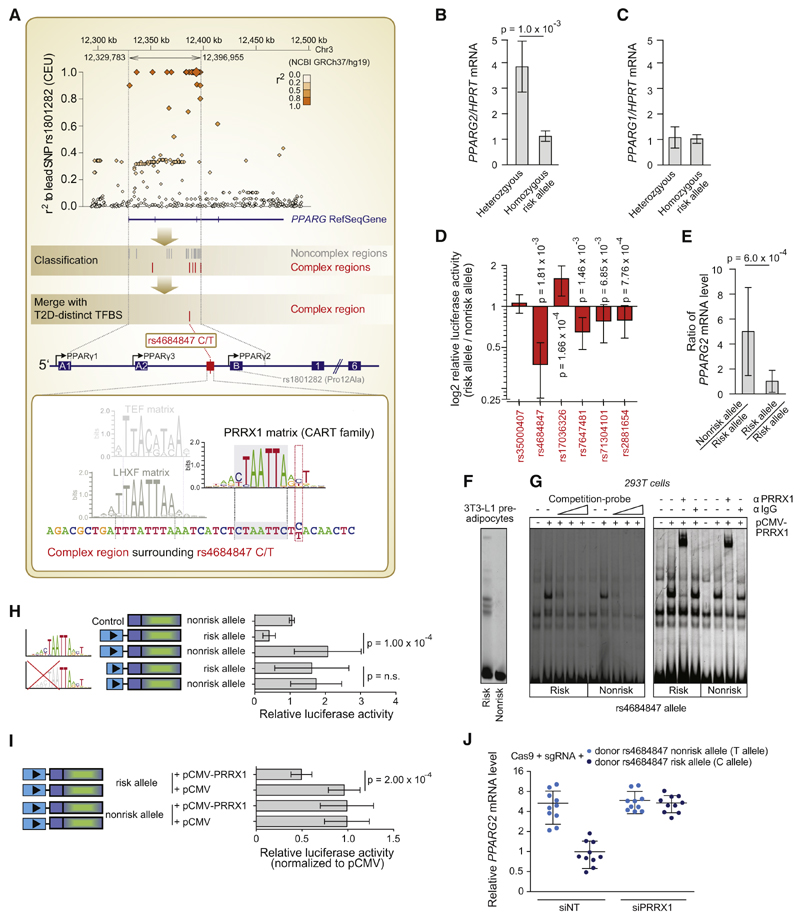
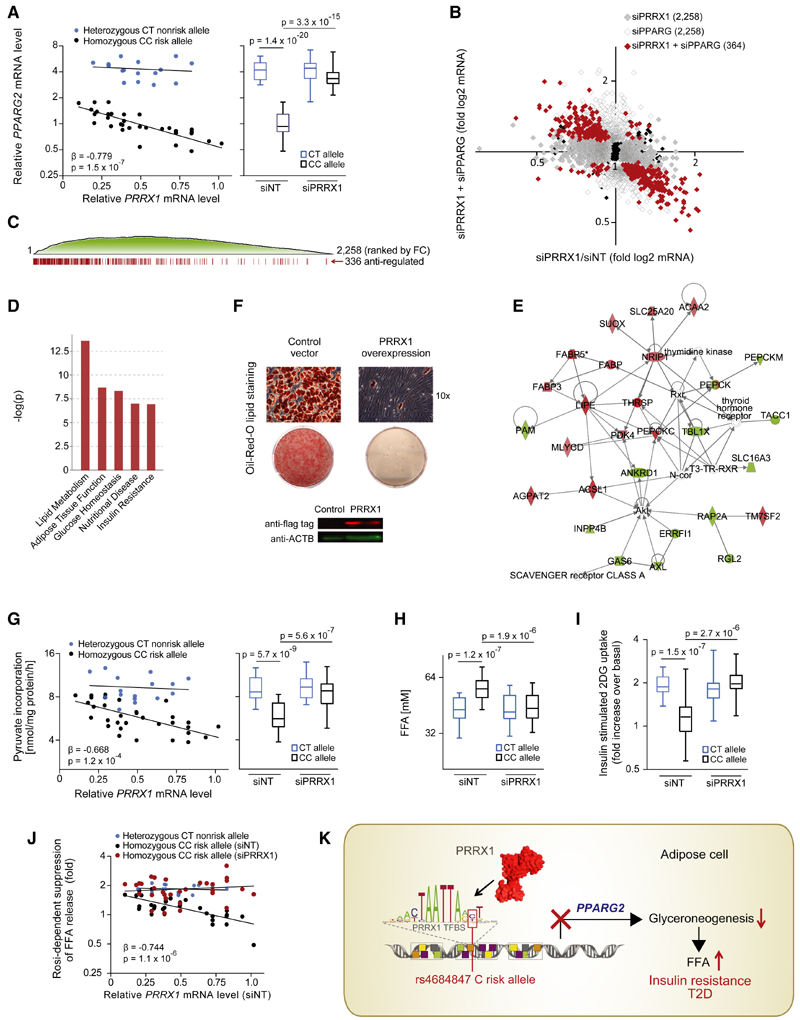
Genome-wide association studies have revealed numerous risk loci associated with diverse diseases. However, identification of disease-causing variants within association loci remains a major challenge. Divergence in gene expression due to cis-regulatory variants in noncoding regions is central to disease susceptibility. We show that integrative computational analysis of phylogenetic conservation with a complexity assessment of co-occurring transcription factor binding sites (TFBS) can identify cis-regulatory variants and elucidate their mechanistic role in disease. Analysis of established type 2 diabetes risk loci revealed a striking clustering of distinct homeobox TFBS. We identified the PRRX1 homeobox factor as a repressor of PPARG2 expression in adipose cells and demonstrate its adverse effect on lipid metabolism and systemic insulin sensitivity, dependent on the rs4684847 risk allele that triggers PRRX1 binding. Thus, cross-species conservation analysis at the level of co-occurring TFBS provides a valuable contribution to the translation of genetic association signals to disease-related molecular mechanisms.


Figures

Figure 1
Figure 1. Discovery of cis-Regulatory Diabetes SNPs
(A) Workflow of the PMCA methodology: (1) the flanking region of a noncoding SNP is extracted from the human reference genome; (2) orthologous regions are searched in the genomes of 15 vertebrate species; (3) TFBS are identified in each orthologous sequence; (4) TFBS modules are identified in the set of orthologous sequences (TFBS modules defined as all, two or more TFBS occurring in the same order and in certain distance range in all or a subset of the orthologous sequences); (5) phylogenetically conserved TFBS ΩTFBS, TFBS modules Ωmodules, and occurrences of TFBS in TFBS modules ΩTFBS_in_modules are counted; (6) repeated counting for different numbers of input sequences weighs the degree of cross-species conservation and the number of TFBS in modules; computation of conserved TFBS with more restricted parameters Ωrestr_TFBS accounts for genomic regions with low numbers of orthologs; (7) steps 3-6 are repeated using randomized input sequences (randomization of sequences is done using local shuffling in order to conserve local nucleotide frequency distributions) to estimate; (8) the probability p-est of observing a given ΩTFBS, Ωrestr_TFBS, Ωmodules, and ΩTFBS_in_modules and to calculate the overall scoring criterion; (9) input sequences are classified as complex and noncomplex regions; and (10) complex regions harboring a trait-related TFBS at SNP position are selected for functional evaluation (trait-related TFBS are drawn from overall TFBS clustering analysis as described in text related to Figure 3). See also the Extended Experimental Procedures. (B) Representative complex region (rs4684847) and noncomplex region (rs13064760). Conserved TFBS and conserved TFBS in modules occurring in more than two vertebrate species are shown to illustrate TFBS modularity across species. (C-G) Classification of SNP regions for a set of eight T2D risk loci (Table S1; Figure S1). Box-whisker plots (IQR 50%) show the counts of conserved TFBS ΩTFBS (C), conserved TFBS modules Ωmodules (D) and occurrences of TFBS in TFBS modules ΩTFBS_in_modules (E) for complex regions (red lines) and noncomplex regions (black lines). Data points covered by the interquartile range (IQR) and the whiskers values were added as rug at the sides of the plot. Note that values vary over a large range with higher median for complex regions for all criteria (at 47 T2D loci we find a median of 354.5/470.46 and 310/382.35 for ΩTFBS_in_modules in complex/noncomplex regions). Scoring of SNP regions is illustrated by histograms showing the probability p-est of observing ΩTFBS across species (F) and showing the overall scoring criterion Sall (G). Blue curve: empirical density function of the histogram data. Red dashed line: cut-off scores separating complex from noncomplex regions ( log10 p-estTFBS = 1.12, Sall = 6.5); SNP regions with a value to the left of the red line were defined as noncomplex. (H and I) cis-Regulatory activity of SNP regions. Noncomplex regions include regions matched for TFBS density of complex regions (TFBS median = 88). The allele-dependent change in DNA-binding activity from EMSAs (n = 4) (H) and luciferase reporter activity (n = 10) (I) is shown for each SNP. Mean ± SD, p from linear mixed-effects model. See also Tables S2 and S3.
Figure 2
Figure 2. Correlations of cis-Regulatory Predictions at 47 T2D Risk Loci with Evolutionary Constrained Elements and Functionally Annotated Genomic Regions
(A) Correlation of PMCA results with evolutionary constrained regions. The occurrences of 487 complex and 978 noncomplex T2D-associated regions within constrained regions from SiPhy-p algorithm (Lindblad-Toh et al., 2011). Localization of SNPs relative to transcription start site in Figures S2A and S2B. (B) Venn diagram illustrates the number of complex and noncomplex regions that directly map to a constrained element (overlap). (C) Complex regions at the PPARG locus (Figure 4E) lack an overlap with constrained regions. Zoom-in: the rs4684847 cis-regulatory region does not map to a constrained region (393 bp upstream of nearest constrained element). A representative TFBS module (UTFBS_in_module = 3) is shown and its TFBS module conservation for a given quorum of five species is visualized by a sequence logo. (D and E) Correlation of complex (red line) and noncomplex (black line) T2D-associated SNP regions to DHSseq (D) and ChIP-seq (E) peaks. From the midpoint of 487 complex and 978 noncomplex regions, 1,000 bp in both directions were scanned for DHSseq and ChIP-seq peaks (Extended Experimental Procedure). For each position, the sum of occurrences was plotted. T2D complex regions were significantly enriched for overlaps with DHSseq and ChIP-seq regions, displayed as a central peak (correlations with Crohn’s-associ-ated regions in Figures S2C and S2D). See also Tables S7, S8, and S9.
Figure 3
Figure 3. Positional Bias of Distinct Homeo-box TFBS Families at T2D Risk SNPs
Distribution of TFBS matrices relative to SNP positions (SNP ± 500 bp) at T2D compared to asthma risk loci, calculated using positional bias analysis. One thousand base pair genomic regions with SNPs at midposition were scanned for the occurrence of TFBS matches for 192 TFBS matrix families (sliding 50 bp windows, p from binomial distribution model, Extended Experimental Procedures). (A and B) TFBS family distribution in a set of eight and an extended set of 47 T2D risk loci. Complex regions reveal clustering of distinct homeobox TFBS matrix families at T2D risk SNP positions (±20 bp, gray dashed lines). All TFBS families displayed equal distributions within T2D non-complex regions (a subset of representative TFBS families is shown). (C) TFBS family distribution in a set of eight asthma risk loci. Asthma complex and noncomplex regions lack a positional bias at SNP positions for the homeobox TFBS matrix families clustering in complex regions at T2D risk SNPs (see Figure S3 for details on Crohn’s). (D and E) TFBS family distribution in asthma risk loci revealed a specific EGRF matrix family clustering in complex regions at asthma risk SNPs (D). T2D complex regions lack a clustering of EGRF matrices at SNP positions (E).
Figure 4
Figure 4. The Noncoding SNP rs4684847 by Binding the Homeobox Factor PRRX1, Represses PPARG2 Expression at the PPARG Diabetes Risk Locus
(A) Top panel: an LD regional plot of the PPARG locus. Diamonds, tagSNP Pro12Ala and pairwise correlation of SNPs in LD (MAF ≥ 1%) against genomic position; blue, PPARG gene and exons. Middle/lower panel: classification of SNPs in complex regions (red lines) and noncomplex regions (gray lines) (PMCA steps 1–9, Figure 1A). Scanning of PPARG complex regions for T2D-distinct homeobox TFBS matrix families (CART, HOMF, HBOX, NKX6, BCDF, PDX1; Figure 3B) pinpoints rs4684847 (C/T), based on its overlap with the CART binding matrix for PRRX1 (step 10, Figure 1A). Zoom-in, human PPARG gene; arrows, transcription start site (TSS) of PPARG1-3 mRNA isoforms; boxes, coding exons (filled) and untranslated exons (open); lines, introns. Second zoom-in, CRM at rs4684847; the PRRX1 matrix co-occurs with diverse TFBS matrices in consistent orientation and distance range across species, exemplarily illustrated by one conserved TFBS module (UTFBS_in_modules = 3; TFBS matrices: PRRX1, TEF, LHXF). (B and C) Genotype-dependent mRNA expression in undifferentiated hASCs genotyped for Pro12Ala and rs4684847 (r2 = 1.0). qPCR of PPARG1 and PPARG2 mRNA isoforms (standardized to HPRT) homozygous CC risk (n = 9) and CT nonrisk allele carriers (n = 5) normalized to mean for CC. Mean ± SD, t test. (D) Validation of cis-regulatory predictions for complex regions at the PPARG locus. Quantified change in reporter activity in 3T3-L1 adipocytes is shown for each SNP, using luciferase constructs harboring the risk or nonrisk alleles, representing an activating or repressing effect of the risk allele on transcriptional activity. Mean ± SD, n = 3–14, paired t test. (E) Allele-specific primer extension analysis in hASCs of heterozygous rs4684847 carriers (n = 6) normalized to mean risk allele levels (D). Mean ± SD, Mann-Whitney U test. (F and G) Increased PRRX1 binding at the risk allele in EMSAs with rs4684847 allelic probes and 3T3-L1 preadipocyte nuclear extracts (F), confirmed by competition with cold PRRX1 probe (G, left panel) and PRRX1 antibody shift of protein-DNA complex in 293T with ectopically expressed PRRX1 (G, right panel). (H) Reporter assays with constructs harboring the rs4684847 risk and nonrisk allele in 3T3-L1 preadipocytes. Truncation of the PRRX1 matrix without affecting rs4684847 reveals abrogated allelic cis-regulatory activity. Mean ± SD, n = 9, paired t test. (I) Inhibition of reporter activity (normalized to pCMV control) at the rs4684847 risk allele by ectopic expression of PRRX1 in 3T3-L1 preadipocytes. Mean ± SD; n = 9, paired t test. (J) Regulation of PPARG2 mRNA expression in SGBS adipocytes with the CC risk allele, or TT nonrisk allele introduced by CRISPR/Cas9 genome editing approach. siPRRX1 and siNT transfection concurrent with induction of differentiation, PPARG2 mRNA assessed by quantitative RT-PCR (qRT-PCR), standardized to HPRT. Mean ± SD, n = 12, t test. siNT, nontargeting siRNA. See also Figure S4 and Table S17.
Figure 5
Figure 5. Binding of PRRX1 at the rs4684847 Risk Allele in Human Adipose Cells Affects Lipid Metabolism and Insulin Sensitivity
(A) rs4684847-dependent PPARG2 and PRRX1 mRNA levels measured by qPCR (standardized to HPRT) in hASC from BMI-matched rs4684847 CT (n = 16) and CC (n = 32) risk allele carriers. siPRRX1 and siNT transfected concurrent with induction of adipogenic differentiation for 72 hr. Left: Pearson’s correlation in the siNT set. Right: box-whisker plot comparing PPARG2 mRNA in siNT- versus siPRRX1-treated cells (t test). FC, fold change. (B and C) Global gene expression profiling by Illumina microarrays (q < 0.2) in hASCs from rs4684847 CC risk allele carriers transfected with siPRRX1 (n = 9, gray dots) and cotransfected with siPRRX1 and siPPARG (n = 4, red dots) for 72 hr after induction of adipogenic differentiation (B). Distribution of siPRRX1/siPPARG antiregulated genes among all regulated genes ranked by fold change (C). (D and E) Biological pathways associated with siPRRX1/siPPARG antiregulated genes (D) and top scoring interaction network (E) from ingenuity pathway analysis. (F) Oil Red O lipid staining of human SGBS cells with lentiviral-overexpressed flag-tagged PRRX1 (or control vector) 12 days after induction of adipocyte differentiation. Protein expression with aflag (PRRX1) and aACTB antibodies. (G and H) rs4684847-dependent glyceroneogenesis rate measured by [1-14C]-pyruvate incorporation (G) and FFA release (H) in hASCs from BMI-matched rs4684847CT(n=16) and CC (n = 32) risk allele carriers aftersilencing ofPRRX1. (G) Left: Pearson’s correlation inthe siNT set. Right: box-whisker plot comparing siNT- versus siPRRX1-treated cells, t test. FFA, free fatty acids. (I) rs4684847-dependent increase of [3H]-2-deoxyglucose ([3H]-2DG) uptake following insulin stimulation in hASCs. Box-whisker plot comparing siNT- versus siPRRX1-treated cells; t test. (J) rs4684847-dependent rosiglitazone-mediated suppression of FFA-release during glyceroneogenesis. Pearson’s correlation comparing siNT versus siPRRX1. Mean ± SD, t test. See also Figures S4G and S4H; Tables 1 and 2. (K) The rs4684847 risk allele (C allele) promotes PRRX1 binding 6.5 kb upstream of the PPARG2-specific promoter, leading to suppression of PPARG2 mRNA expression and perturbated lipid handling in adipose cells, increased circulating FFA levels, insulin resistance, and risk of T2D.

Similar articles

Cited by

  • The short and long of noncoding sequences in the control of vascular cell phenotypes.
    Miano JM, Long X. Miano JM, et al. Cell Mol Life Sci. 2015 Sep;72(18):3457-88. doi: 10.1007/s00018-015-1936-9. Epub 2015 May 29. Cell Mol Life Sci. 2015. PMID: 26022065 Free PMC article. Review.
  • Integrating ChIP-seq with other functional genomics data.
    Jiang S, Mortazavi A. Jiang S, et al. Brief Funct Genomics. 2018 Mar 1;17(2):104-115. doi: 10.1093/bfgp/ely002. Brief Funct Genomics. 2018. PMID: 29579165 Free PMC article. Review.
  • Thiazolidinediones and the promise of insulin sensitization in type 2 diabetes.
    Soccio RE, Chen ER, Lazar MA. Soccio RE, et al. Cell Metab. 2014 Oct 7;20(4):573-91. doi: 10.1016/j.cmet.2014.08.005. Epub 2014 Sep 18. Cell Metab. 2014. PMID: 25242225 Free PMC article. Review.
  • Prioritising Causal Genes at Type 2 Diabetes Risk Loci.
    Grotz AK, Gloyn AL, Thomsen SK. Grotz AK, et al. Curr Diab Rep. 2017 Sep;17(9):76. doi: 10.1007/s11892-017-0907-y. Curr Diab Rep. 2017. PMID: 28758174 Free PMC article. Review.
  • Refining the accuracy of validated target identification through coding variant fine-mapping in type 2 diabetes.
    Mahajan A, Wessel J, Willems SM, Zhao W, Robertson NR, Chu AY, Gan W, Kitajima H, Taliun D, Rayner NW, Guo X, Lu Y, Li M, Jensen RA, Hu Y, Huo S, Lohman KK, Zhang W, Cook JP, Prins BP, Flannick J, Grarup N, Trubetskoy VV, Kravic J, Kim YJ, Rybin DV, Yaghootkar H, Müller-Nurasyid M, Meidtner K, Li-Gao R, Varga TV, Marten J, Li J, Smith AV, An P, Ligthart S, Gustafsson S, Malerba G, Demirkan A, Tajes JF, Steinthorsdottir V, Wuttke M, Lecoeur C, Preuss M, Bielak LF, Graff M, Highland HM, Justice AE, Liu DJ, Marouli E, Peloso GM, Warren HR; ExomeBP Consortium; MAGIC Consortium; GIANT Consortium; Afaq S, Afzal S, Ahlqvist E, Almgren P, Amin N, Bang LB, Bertoni AG, Bombieri C, Bork-Jensen J, Brandslund I, Brody JA, Burtt NP, Canouil M, Chen YI, Cho YS, Christensen C, Eastwood SV, Eckardt KU, Fischer K, Gambaro G, Giedraitis V, Grove ML, de Haan HG, Hackinger S, Hai Y, Han S, Tybjærg-Hansen A, Hivert MF, Isomaa B, Jäger S, Jørgensen ME, Jørgensen T, Käräjämäki A, Kim BJ, Kim SS, Koistinen HA, Kovacs P, Kriebel J, Kronenberg F, Läll K, Lange LA, Lee JJ, Lehne B, Li H, Lin KH, Linneberg A, Liu CT, Liu J, Loh M, Mägi R, Mamakou V, McKean-Cowdin R, Nadkarni G, Neville M, Nielsen SF, Ntalla I… See abstract for full author list ➔ Mahajan A, et al. Nat Genet. 2018 Apr;50(4):559-571. doi: 10.1038/s41588-018-0084-1. Epub 2018 Apr 9. Nat Genet. 2018. PMID: 29632382 Free PMC article.

References

    1. Alberobello AT, Congedo V, Liu H, Cochran C, Skarulis MC, Forrest D, Celi FS. An intronic SNP in the thyroid hormone receptor β gene is associated with pituitary cell-specific over-expression of a mutant thyroid hormone receptor b2 (R338W) in the index case of pituitary-selective resistance to thyroid hormone. J Transl Med. 2011;9:144. - PMC - PubMed
    1. Arnone MI, Davidson EH. The hardwiring of development: organization and function of genomic regulatory systems. Development. 1997;124:1851–1864. - PubMed
    1. Ballard FJ, Hanson RW, Leveille GA. Phosphoenolpyruvate carboxykinase and the synthesis of glyceride-glycerol from pyruvate in adipose tissue. J Biol Chem. 1967;242:2746–2750. - PubMed
    1. Blow MJ, McCulley DJ, Li Z, Zhang T, Akiyama JA, Holt A, Plajzer-Frick I, Shoukry M, Wright C, Chen F, et al. ChIP-Seq identification of weakly conserved heart enhancers. Nat Genet. 2010;42:806–810. - PMC - PubMed
    1. Brissova M, Shiota M, Nicholson WE, Gannon M, Knobel SM, Piston DW, Wright CVE, Powers AC. Reduction in pancreatic transcription factor PDX-1 impairs glucose-stimulated insulin secretion. J Biol Chem. 2002;277:11225–11232. - PubMed

Publication types

Associated data