. 2014 Jun:54:116-22.
doi: 10.1016/j.exger.2014.01.004. Epub 2014 Jan 15.

High TNF-α levels in resting B cells negatively correlate with their response

Affiliations

High TNF-α levels in resting B cells negatively correlate with their response

Daniela Frasca et al. Exp Gerontol. 2014 Jun.

Abstract

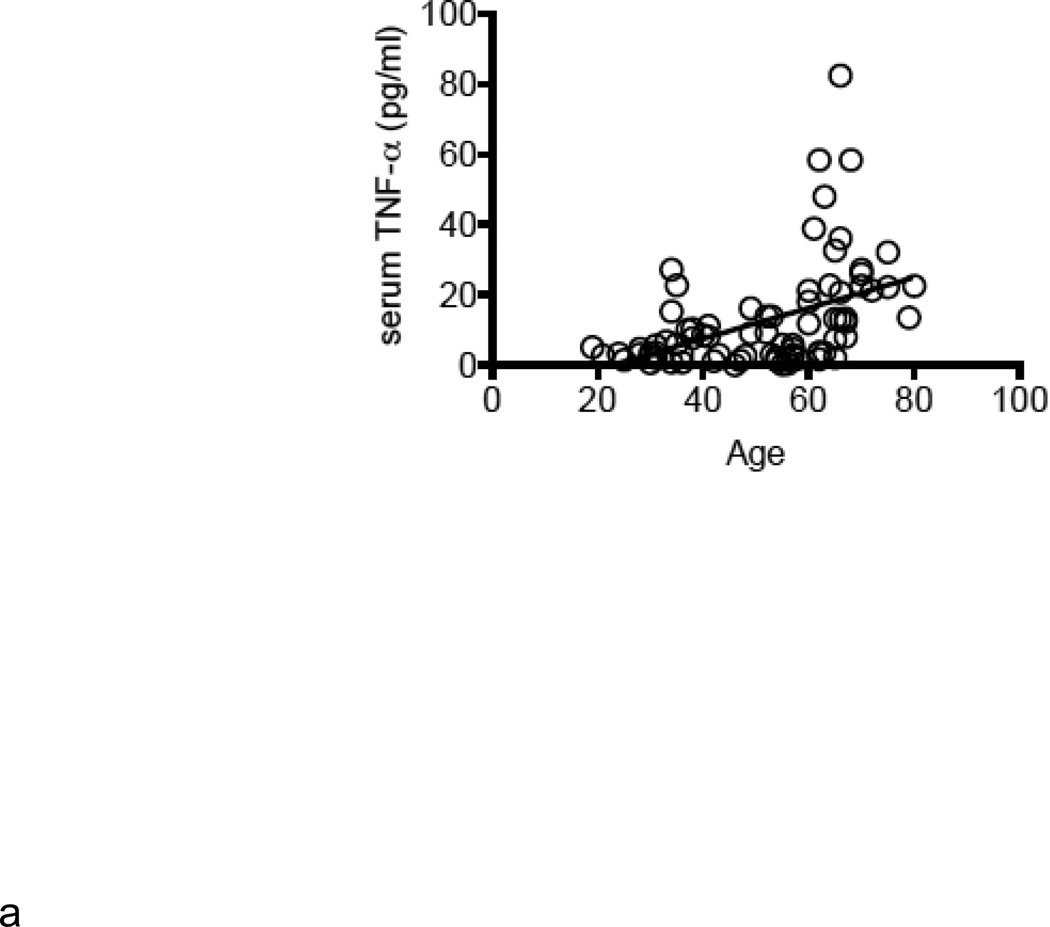
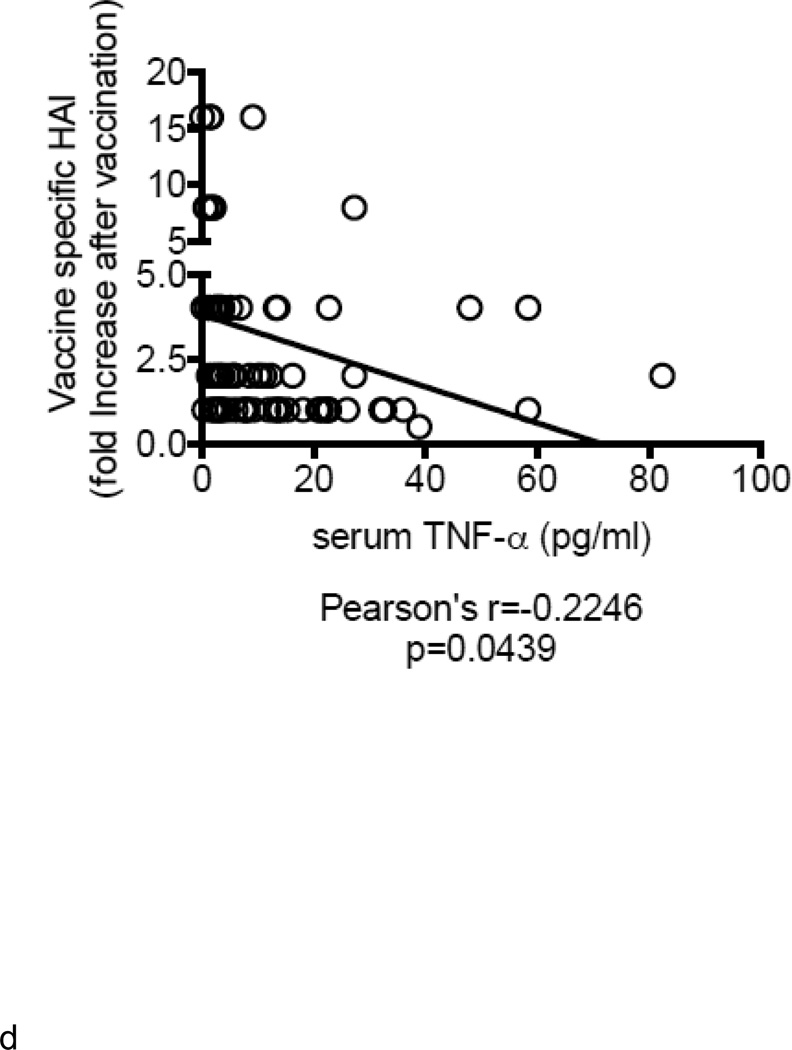
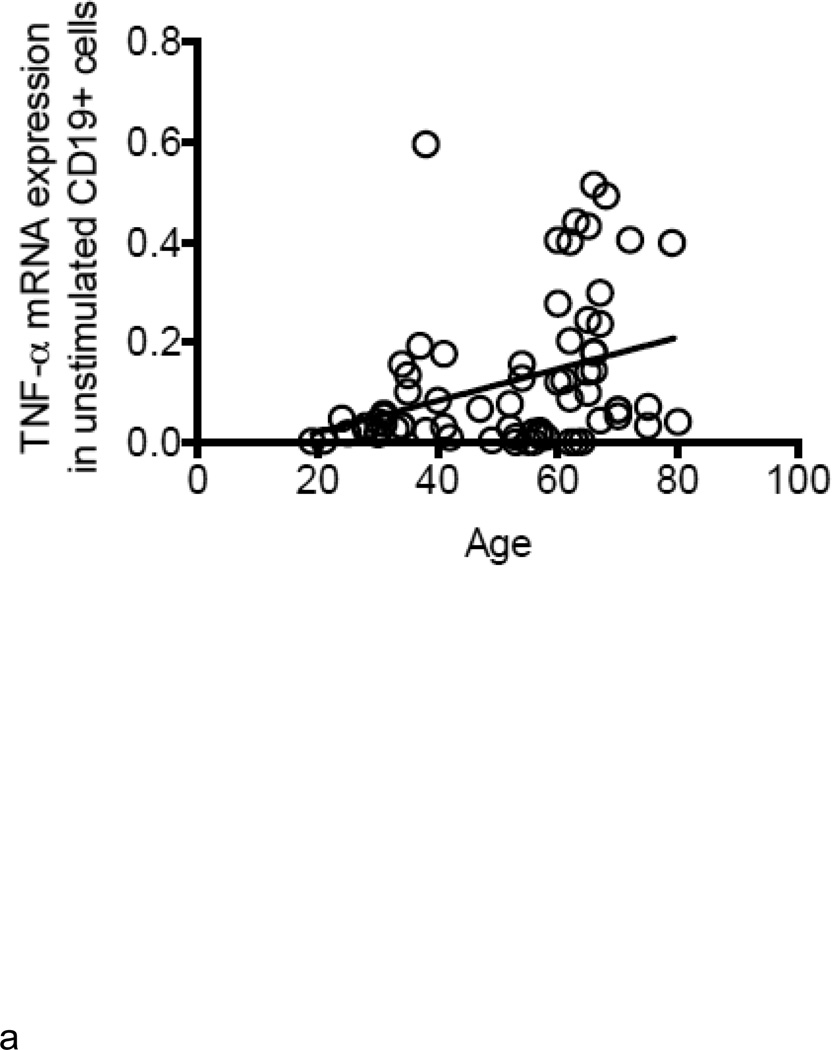
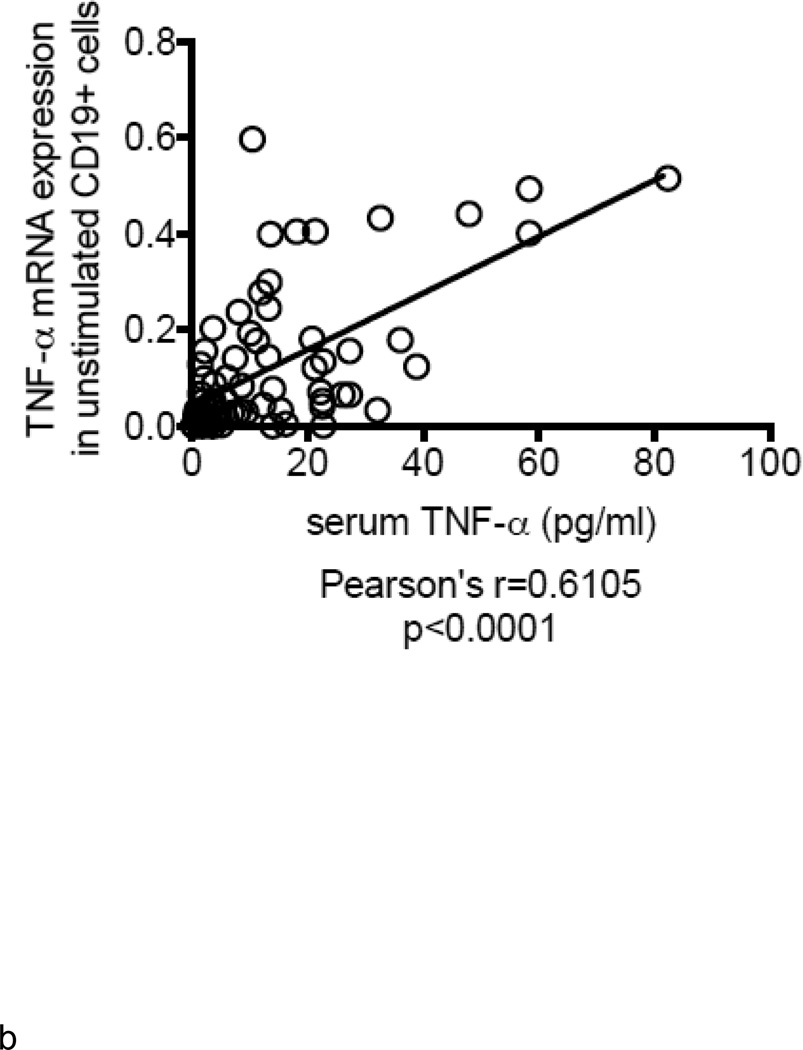
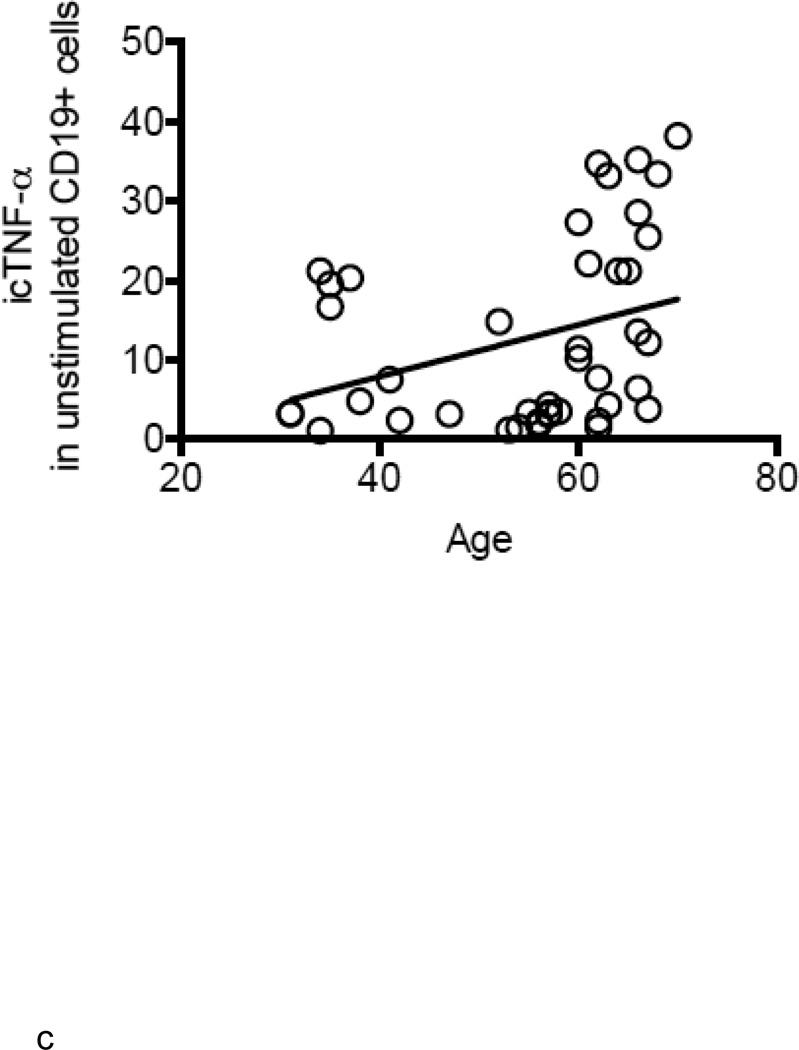
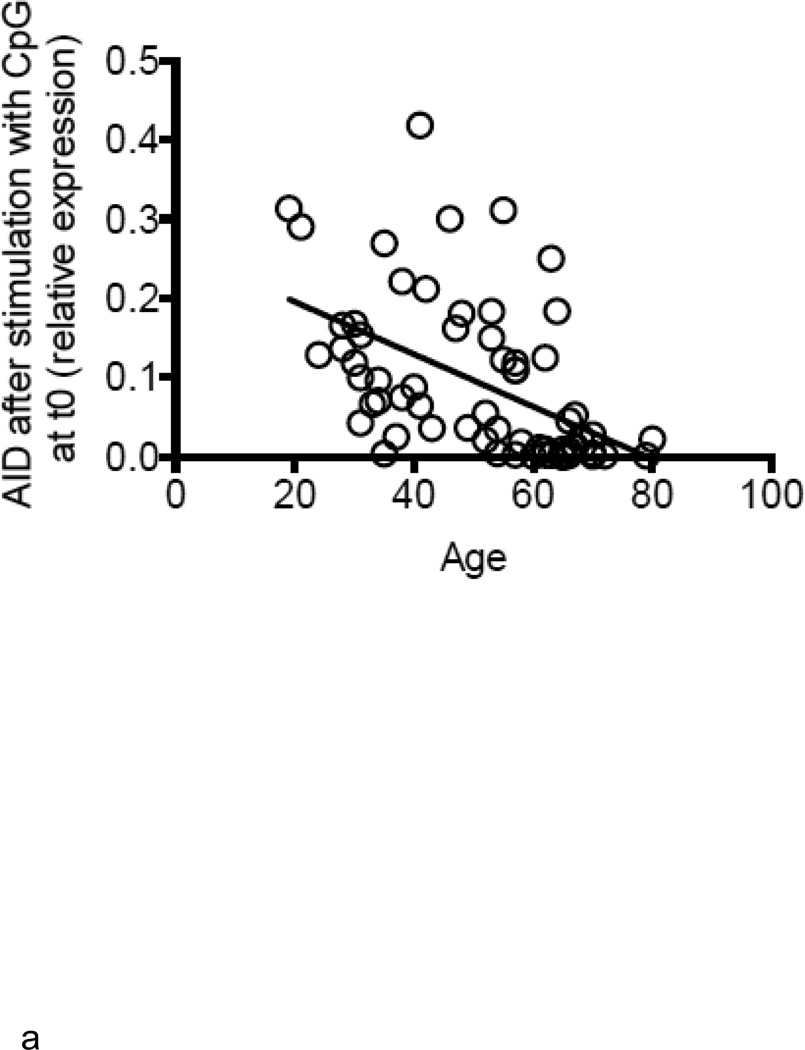
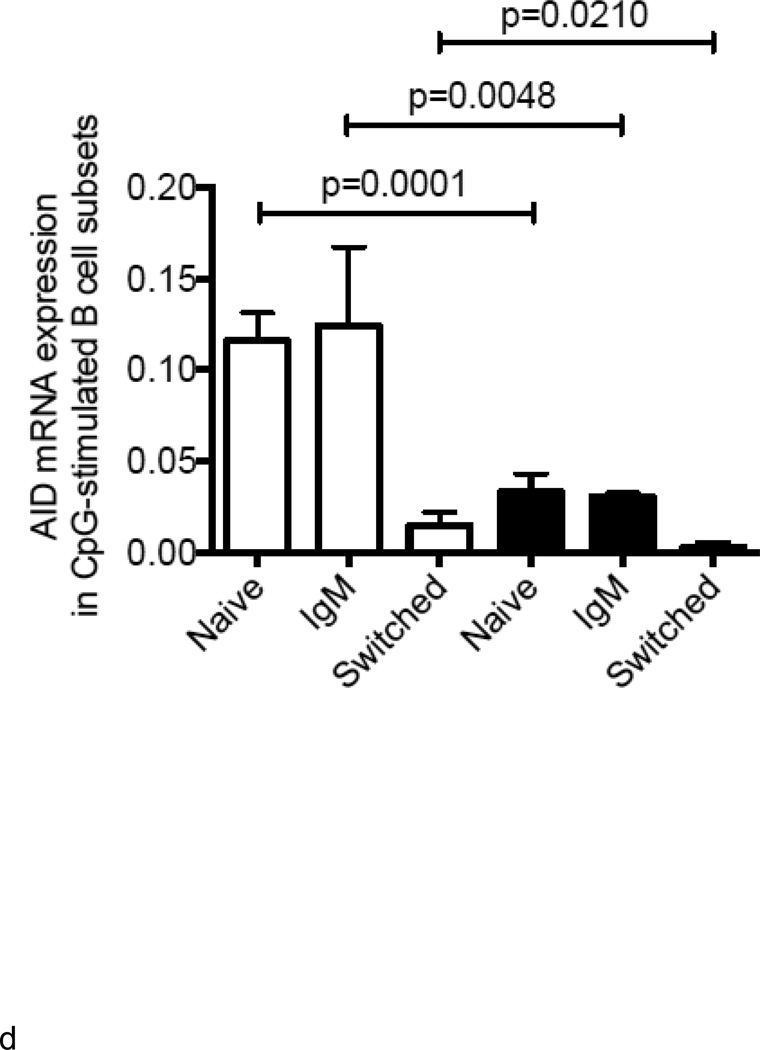
Aging significantly decreases the influenza vaccine-specific response as we and others have previously shown. Based on our previous data in aged mice, we hypothesize that the inflammatory status of the individual and of B cells themselves would impact B cell function. We here show that the ability to generate a vaccine-specific antibody response is negatively correlated with levels of serum TNF-α. Moreover, human unstimulated B cells from elderly make higher levels of TNF-α than those from young individuals, and these positively correlate with serum TNF-α levels. These all negatively correlate with B cell function, measured by activation-induced cytidine deaminase, the enzyme of class switch recombination and somatic hypermutation. Only memory B cells (either IgM or switched), but not naïve B cells, make appreciable levels of TNF-α and more in elderly as compared to young individuals. Finally, an anti-TNF-α antibody can increase the response in cultured B cells from the elderly, suggesting that TNF-α secreted by memory B cells affects IgM memory B cells and naïve B cells in an autocrine and/or paracrine manner. Our results show an additional mechanism for reduced B cell function in the elderly and propose B cell-derived TNF-α as another predictive biomarker of in vivo and in vitro B cell responses.

Keywords: Aging; B cells; Inflammation; Vaccine responses.


Conflict of interest statement

Conflict of interest

The authors have declared that no conflict of interest exists.

Figures

Figure 1
Figure 1. Increased serum TNF-α levels negatively correlate with the in vivo influenza vaccine response
A. Serum TNF-α levels (pg/ml) from 52 young and 31 elderly individuals was measured by ELISA. Pearson’s r=0.4506, p<0.0001. B. Sera isolated from the same young and elderly individuals, before (t0) and after vaccination (t7), were collected and analyzed by HAI assay to evaluate antibody production to vaccine. Results are expressed as fold-increase in the reciprocal of the titer after vaccination, calculated as follows: reciprocal of titer values after vaccination/ reciprocal of titer values before vaccination. Pearson’s r=−0.2325, p=0.0367. C. HAI results are expressed as reciprocal of the titer after vaccination. Only 11 out of 52 young, 7 out of 31 elderly individuals had a non protective titer (below 1/40) at t0. D. ELISA (to measure serum TNF-α) and HAI (to measure antibody titers) were performed as described above. Pearson’s r=−0.2246, p=0.0439.
Figure 2
Figure 2. Unstimulated B cells from elderly individuals produce higher amounts of TNF-α mRNA
A. B cells were isolated from PBMC by magnetic sorting and mRNA extracted to evaluate TNF-α mRNA expression. Results show qPCR values (ΔΔCt) of TNF-α mRNA expression normalized to GAPDH±SE from 52 young and 31 elderly individuals, same as in Fig. 1. Pearson’s r=0.3480, p=0.0026. B. ELISA (to measure serum TNF-α) and qPCR (to measure TNF-α mRNA) were performed as described above. Correlations were performed by Pearson’s test. Pearson’s r=0.6105, p<0.0001. Thirty-five experimental points fall between 10 (X axis) and 0.1 (Y axis). C. One hundred µl of blood at t0 from 21 young and 21 elderly individuals (among those in Fig. 1) were stained. Pearson’s r=0.3345, p=0.0304. D. Naïve, IgM memory and switched memory B cell subsets were sorted. The mRNA was extracted at the end of sorting to evaluate TNF-α mRNA expression. Vertical columns represent the qPCR values (ΔΔCt) of TNF-α mRNA expression normalized to GAPDH±SE from 4 young (white columns) and 4 elderly (black columns) individuals (among those in Fig. 1). The relative percentages of the 4 B cell subsets in these young and elderly individuals are: 32±2 (naïve), 54±11 (IgM memory), 12±2 (switched memory) and 2±1 (late/exhausted memory) in young and 59±4 (naïve), 27±10 (IgM memory), 3±1 (switched memory) and 11±5 (late/exhausted memory) in elderly individuals. Mean comparisons between groups were performed by paired Student’s t test (two-tailed).
Figure 3
Figure 3. Increased TNF-α levels in B cells from elderly individuals correlate with lower B cell response to CpG
A. B cells were isolated from PBMC by magnetic sorting at t0. B cells were cultured with CpG for 7 days and then processed as described in Methods. Results are expressed as qPCR values of AID mRNA normalized to GAPDH, as the individuals in this study have comparable percentages of B cells. The is because we selected the elderly with sufficient percentages of B cells in order to perform the sort (7–10%). Every point in the figure is a positive value and we consider 0.1 a predictive biomarker of optimal B cell responses. Pearson’s r=− 0.5129, p<0.0001. B. Correlation between CpG-specific AID mRNA and TNF-α mRNA, both measured at t0, was performed by Pearson’s test. Pearson’s r=−0.2777, p=0.0302. C. HAI (to measure the serum response) and qPCR (to measure AID mRNA) were performed as described. Pearson’s r=0.3754, p=0.0021. D. Naïve, IgM memory and switched memory B cell subsets were sorted as described in Methods. The mRNA was extracted at the end of sorting to evaluate AID mRNA expression after stimulation with CpG. Vertical columns represent the qPCR values (ΔΔCt) of AID mRNA expression normalized to GAPDH±SE from 4 young (white columns) and 4 elderly (black columns) individuals (same individuals in Fig. 2D). Mean comparisons between groups were performed by paired Student’s t test (two-tailed).
Figure 4
Figure 4. Anti-TNF-α Ab increases LPS response in young and more significantly in old cultured B cells
B cells (106 cells/ml) from 4 young and 4 elderly individuals (among those in Fig. 1) were stimulated with CpG for 7 days. Anti-TNF-α (100 ng/ml/106 cells) antibody was added to B cell cultures since the beginning. The mRNA was extracted and qPCR performed to evaluate expression of AID mRNA. Vertical columns represent the densitometric analyses (arbitrary units) of AID mRNA expression normalized to GAPDH±SE (raw qPCR values). Fold-differences in AID in cultures without and with anti-TNF-α are shown. Young B cell cultures: white (no anti-TNF-α), stripes on white background (plus anti-TNF-α). Old B cell cultures: black (no anti-TNF-α), stripes on black background (plus anti-TNF-α). The relative percentages of the 4 B cell subsets in young individuals are: 38,44,39,46 (naïve); 51,44,49,43 (IgM memory); 8,9,10,8 (switched memory) and 3,3,2,3 (late/exhausted memory) whereas in elderly individuals are: 55,53,56,62 (naïve); 35,37,32,31 (IgM memory); 3,2,3,2 (switched memory) and 7,8,9,5 (late/exhausted memory) in elderly individuals.

References

    1. Agrawal S, Gupta S. TLR1/2, TLR7, and TLR9 signals directly activate human peripheral blood naive and memory B cell subsets to produce cytokines, chemokines, and hematopoietic growth factors. J Clin Immunol. 2011;31:89–98. - PMC - PubMed
    1. Ahmed AE, Nicholson KG, Nguyen-Van-Tam JS. Reduction in mortality associated with influenza vaccine during 1989–90 epidemic. Lancet. 1995;346:591–595. - PubMed
    1. Biagi E, Candela M, Franceschi C, Brigidi P. The aging gut microbiota: new perspectives. Ageing Res Rev. 2011;10:428–429. - PubMed
    1. Biagi E, Nylund L, Candela M, Ostan R, Bucci L, Pini E, Nikkila J, Monti D, Satokari R, Franceschi C, Brigidi P, De Vos W. Through ageing, and beyond: gut microbiota and inflammatory status in seniors and centenarians. PLoS One. 2010;5:e10667. - PMC - PubMed
    1. Bryl E, Vallejo AN, Weyand CM, Goronzy JJ. Down-regulation of CD28 expression by TNF-alpha. J Immunol. 2001;167:3231–3238. - PubMed

Publication types