Review
. 2014 Jun:26:88-95.
doi: 10.1016/j.conb.2013.12.013. Epub 2014 Jan 14.

In vivo optogenetic identification and manipulation of GABAergic interneuron subtypes

Affiliations
Review

In vivo optogenetic identification and manipulation of GABAergic interneuron subtypes

Lisa Roux et al. Curr Opin Neurobiol. 2014 Jun.

Abstract

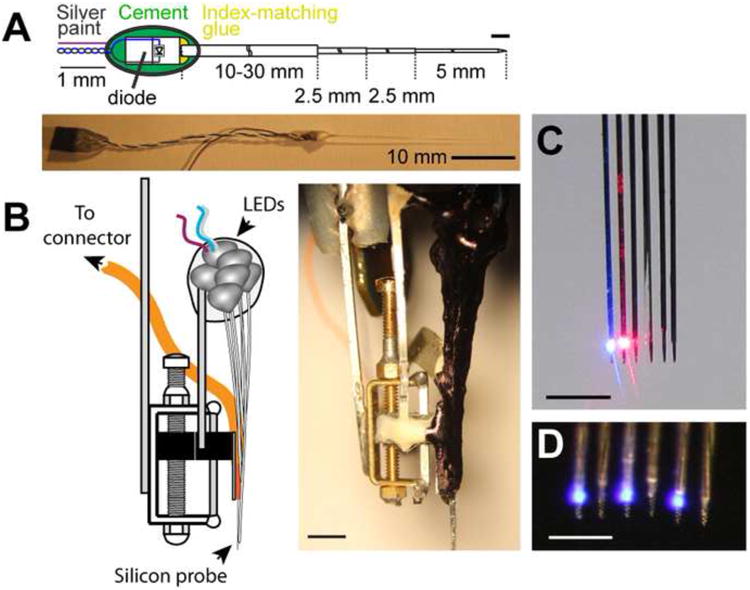
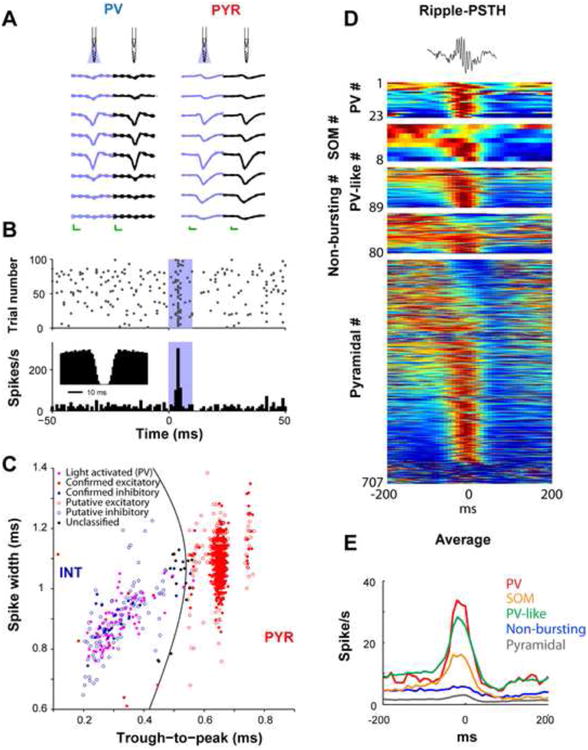
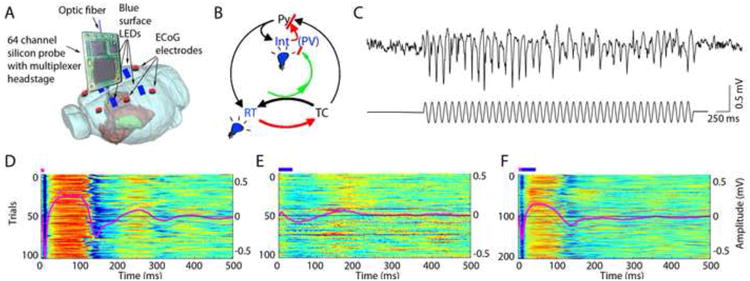
Identification and manipulation of different GABAergic interneuron classes in the behaving animal are important to understand their role in circuit dynamics and behavior. The combination of optogenetics and large-scale neuronal recordings allows specific interneuron populations to be identified and perturbed for circuit analysis in intact animals. A crucial aspect of this approach is coupling electrophysiological recording with spatially and temporally precise light delivery. Focal multisite illumination of neuronal activators and silencers in predetermined temporal configurations or a closed loop manner opens the door to addressing many novel questions. Recent progress demonstrates the utility and power of this novel technique for interneuron research.


Figures

Figure 1
Figure 1. Diode probes for optogenetic identification of interneurons
A. Schematic of a single LED-fiber assembly. The LED is coupled to a 50-μm multimode fiber, etched to a point at the distal (brain) end. B. Left: schematic of a drive equipped with a 6-shank diode probe with LED-fibers mounted on each shank. Etched optical fibers are attached ∼40μm above the recordings sites on the silicon probe shanks. Right: picture of the drive depicted on the left. Scale bar: 3 mm. C-D. Local delivery of light. Magnified frontal view of the 6-shank diode probe equipped with diode-coupled optical fibers. C. Two adjacent shanks illuminated with blue and red light. Scale bar: 1mm. D. Four shanks illuminated with blue light. Scale bar: 0.5 mm (A and C) Reproduced from [49].
Figure 2
Figure 2. Optogenetic identification of interneurons
A. Right: unfiltered spontaneous (black) and light-induced (blue) waveforms of a parvalbumin-expressing interneuron (PV) and a pyramidal cell (PYR) at eight recording sites. Note the similarity of the waveforms with and without illumination. Mean and SD; calibration: 0.25 ms, 50 μV. B. Diode probe-induced unit firing in the hippocampal CA1 region (blue shaded area superimposed on the raster plot -top-and the histogram -bottom-; 4 μW at fiber tip). Inset: autocorrelogram shows a shape typical for fast spiking PV interneurons. C. Clustered units are tagged as excitatory or inhibitory based on monosynaptic peaks/troughs in cross-correlation histograms (filled blue and red symbols) and/or response to locally-delivered 50-70 ms light pulses (filled violet symbols) in transgenic mice expressing ChR2 in PV cells. Untagged units (empty symbols) are classified as putative excitatory pyramidal cells (PYR) or inhibitory interneurons (INT) according to waveform morphology; untagged units with low classification confidence are also shown in black (“unclassified”) [18]. D. Optogenetic identification of interneuron classes, including here PV-and somatostatin (SOM)-expressing interneurons, allows studying their relationships to network patterns such as sharp wave ripple events. Top: single ripple. Each row represents the color-coded peri-ripple histogram of the firing rate computed for individual neurons. E. Average firing rate observed for the different cell categories. (B) Reproduced from [49]. (C) Reproduced from [18]. (D and E) Reproduced from [41].
Figure 3
Figure 3. Controlling thalamocortical circuits by optogenetic activation of interneurons
A. Experimental setup. Optical fiber is placed into the thalamic reticular nucleus in a transgenic mouse expressing ChR2 in PV cells to induce spike-wave seizure-like pattern (shown in C). Blue LEDs (squares) are placed epidurally at two positions in each hemisphere. B. Schematic of the reverberation in the thalamocortical loop. Neurons of the thalamus: reticular nucleus cells (RT), thalamocortical projection neurons (TC). Neurons of the cortex: pyramidal cells (Py) and inhibitory interneurons (Int). D. Light stimulation of the parvalbumin RT neurons alone induces spike-wave discharges, whereas light stimulation of cortical parvalbumin interneurons alone induces rebound excitation in cortical pyramidal cells (Py). Combined and phase shifted stimulation of RT and cortex attenuates the induced spike-wave activity. Reprinted from [62].

Update of

References

    1. Freund TF, Buzsaki G. Interneurons of the hippocampus. Hippocampus. 1996;6:347–470. - PubMed
    1. Klausberger T, Somogyi P. Neuronal diversity and temporal dynamics: the unity of hippocampal circuit operations. Science. 2008;321:53–57. - PMC - PubMed
    1. Fishell G, Rudy B. Mechanisms of inhibition within the telencephalon: “where the wild things are”. Annu Rev Neurosci. 2011;34:535–567. - PMC - PubMed
    1. Isaacson JS, Scanziani M. How inhibition shapes cortical activity. Neuron. 2011;72:231–243. - PMC - PubMed
    1. Monyer H, Markram H. Interneuron Diversity series: Molecular and genetic tools to study GABAergic interneuron diversity and function. Trends Neurosci. 2004;27:90–97. - PubMed

Publication types

LinkOut - more resources