. 2014 Feb 6;53(3):471-83.
doi: 10.1016/j.molcel.2013.12.011. Epub 2014 Jan 16.

Early steps in autophagy depend on direct phosphorylation of Atg9 by the Atg1 kinase

Affiliations

Early steps in autophagy depend on direct phosphorylation of Atg9 by the Atg1 kinase

Daniel Papinski et al. Mol Cell. .

Erratum in

  • Mol Cell. 2014 Feb 6;53(3):515

Abstract

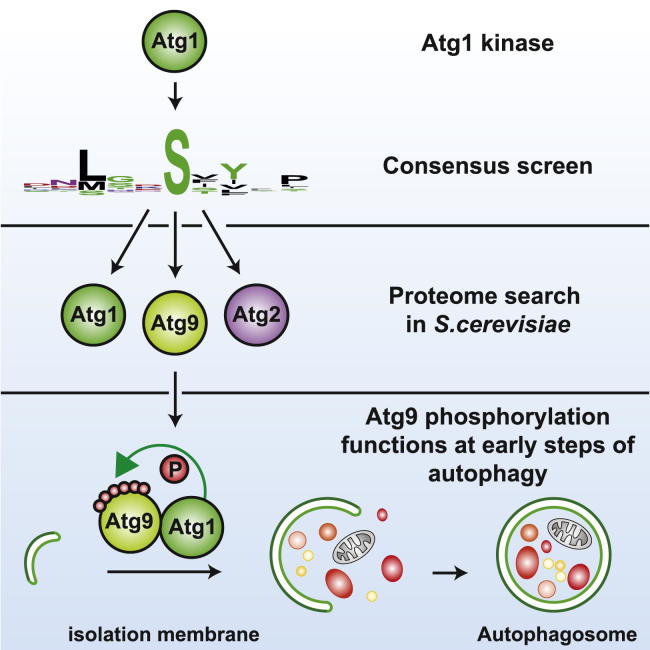
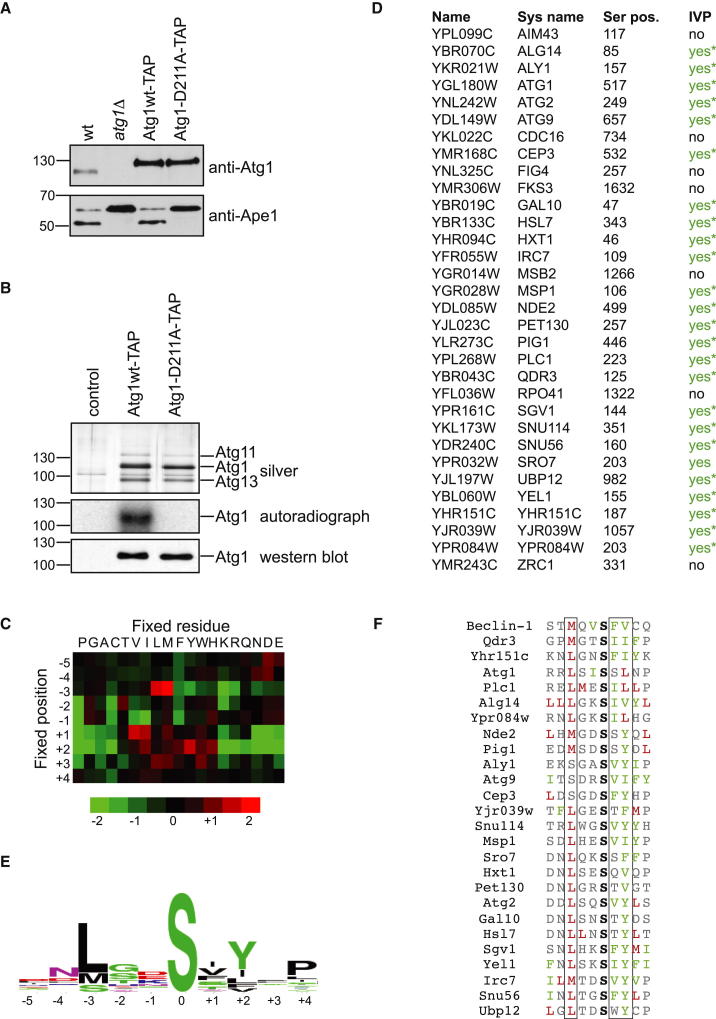
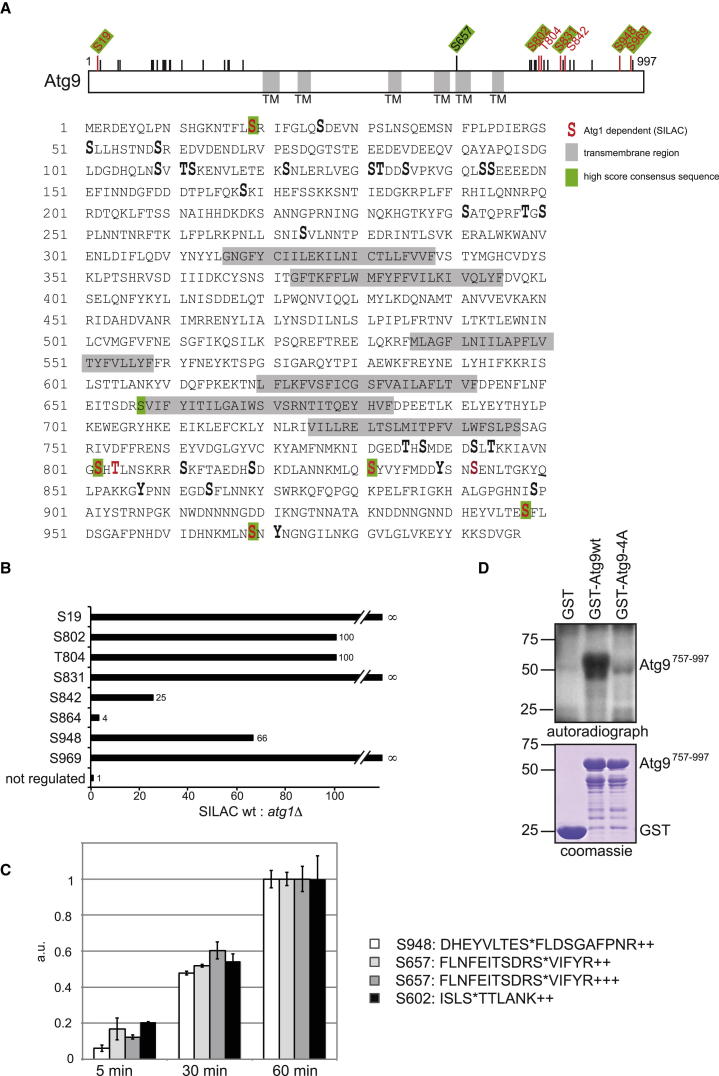
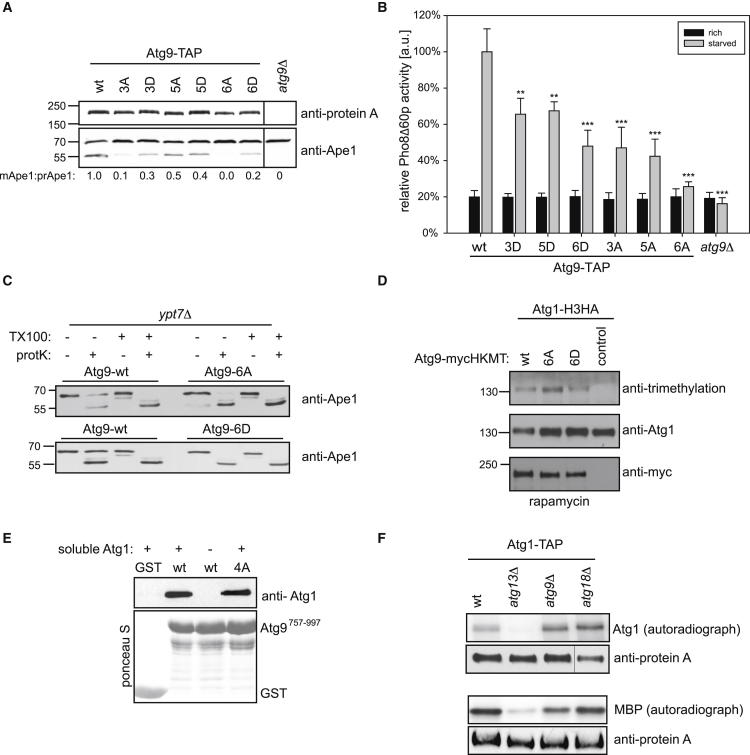
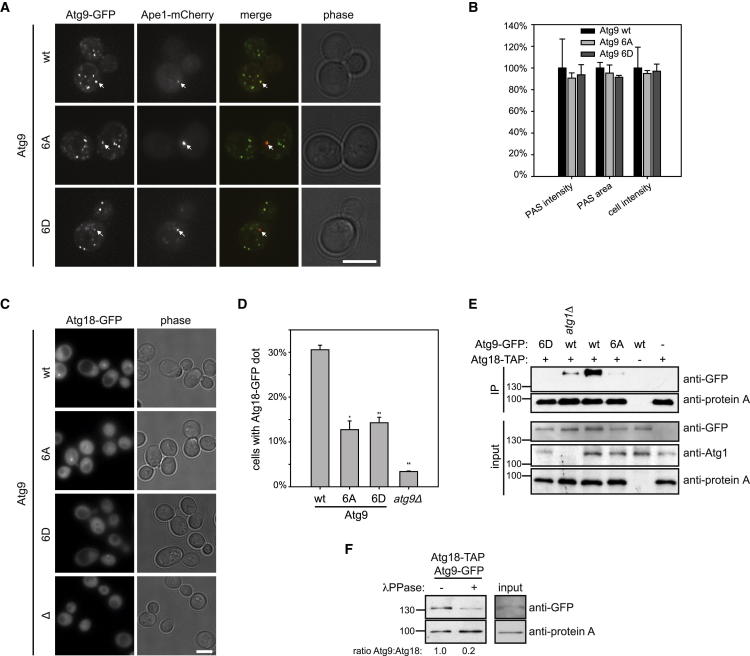
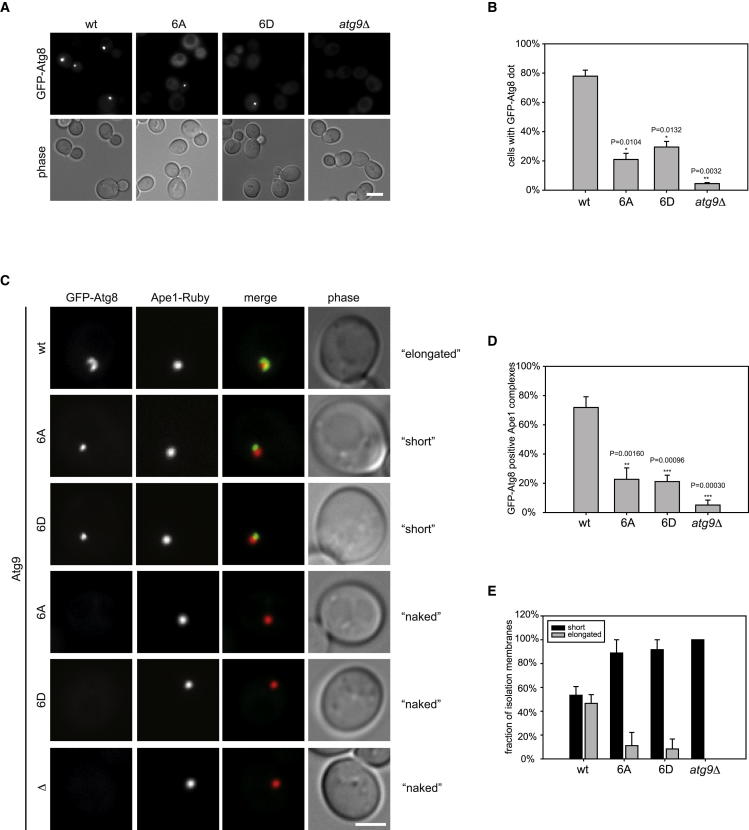
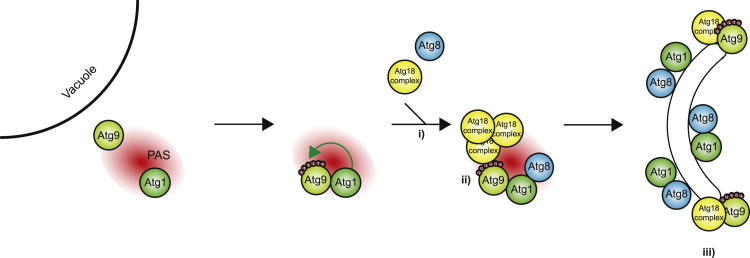
Bulk degradation of cytoplasmic material is mediated by a highly conserved intracellular trafficking pathway termed autophagy. This pathway is characterized by the formation of double-membrane vesicles termed autophagosomes engulfing the substrate and transporting it to the vacuole/lysosome for breakdown and recycling. The Atg1/ULK1 kinase is essential for this process; however, little is known about its targets and the means by which it controls autophagy. Here we have screened for Atg1 kinase substrates using consensus peptide arrays and identified three components of the autophagy machinery. The multimembrane-spanning protein Atg9 is a direct target of this kinase essential for autophagy. Phosphorylated Atg9 is then required for the efficient recruitment of Atg8 and Atg18 to the site of autophagosome formation and subsequent expansion of the isolation membrane, a prerequisite for a functioning autophagy pathway. These findings show that the Atg1 kinase acts early in autophagy by regulating the outgrowth of autophagosomal membranes.


Figures

None
Graphical abstract
Figure 1
Figure 1
Identification of the Atg1 Kinase Consensus Phosphorylation Site (A) Wild-type (wt), atg1Δ, and genomically integrated TAP-tagged wild-type Atg1 (wt) or Atg1 kinase-dead D211A mutant cells were grown to mid-log phase. Cell extracts were prepared by trichloroacetic acid precipitation and analyzed by anti-Atg1 and anti-Ape1 western blotting. Note that TAP-tagged constructs seem more abundant than untagged Atg1 due to additional antibody binding to protein A in western blotting. (B) Wild-type (control), genomically integrated TAP-tagged wild-type Atg1 (Atg1wt), or Atg1 kinase-dead D211A mutant cells were grown to mid-log phase and rapamycin treated for 1 hr. Atg1 was immunoprecipitated and eluted by TEV cleavage. The eluate was analyzed by anti-Atg1 western blotting and silver staining, and autophosphorylation activity was assessed in vitro. The identity of bands corresponding to Atg1, Atg11, and Atg13 on the silver gels was confirmed by mass spectrometry. (C) Peptides (16-mer) containing a central fixed serine phosphoacceptor flanked by degenerate positions and one fixed position as indicated were phosphorylated in vitro using soluble Atg1 complexes, and reactions were spotted on streptavidin-coated membranes followed by autoradiographic quantification. A heat map representing the quantified peptide array is shown. (D) The quantified consensus motif obtained from the peptide array was searched against the S. cerevisiae protein database. Synthetic peptides spanning the consensus region of the top 30 hits and the consensus region of Atg1 and Atg9 were generated and subjected to in vitro phosphorylation with soluble wild-type Atg1 and the D211A mutant, followed by mass spectrometric identification of their phosphorylation state (IVP). Peptides found to be in vitro phosphorylated are marked with “yes.” Asterisks mark accumulation of precursor ion intensity over time, shown in Figure S5. (E) A consensus logo was generated by aligning the 25 verified consensus hits using WebLogo (http://weblogo.berkeley.edu) (Crooks et al., 2004). (F) Alignment of the 25 in vitro verified Atg1 kinase targets with the known ULK1 substrate Beclin-1. M and L are marked in red (position −3 according to the peptide array), and F, V, I, and Y are in green (positions +1 and +2). Note that S can also be found at position −3 and L at position +2. See also Figures S1 and S5.
Figure 2
Figure 2
Atg9 Is an Atg1 Kinase Target In Vivo and In Vitro (A) Wild-type and atg1Δ yeast cells containing endogenously tagged Atg9-HTBeaq were grown to mid-log phase and rapamycin treated for 45 min. Atg9 was affinity purified and subjected to quantitative mass spectrometric phosphorylation mapping by SILAC. Phosphorylation sites are shown enlarged and bold, Atg1-dependent sites are indicated in red, and sites corresponding to the Atg1 consensus are shaded in green. Gray indicates a transmembrane region (TM). (B) Ratios of wild-type (13C/heavy) versus atg1Δ (12C/light) are shown. ∞ indicates that only the heavy variant of the peptide was detected. (C) Synthetic peptides spanning Atg9 (Table S4) were generated and subjected to in vitro phosphorylation with soluble wild-type Atg1 and the D211A mutant, followed by mass spectrometric identification of their phosphorylation state. Peptides that were phosphorylated by wild-type Atg1 in vitro are quantified over the time course of the reaction (0, 5, 30, and 60 min) by label-free quantification using the precursor ion intensities of specific peptides. Note that two different peptides spanning S657 were identified. a.u., arbitrary units. The intensities from the MS1 filtering were normalized to the values from the 60 min reactions. Error bars represent normalized standard deviation of the replicate injections. (D) The C-terminal fragment encompassing amino acids 757–997 of Atg9 or the corresponding 4A mutant (S802A, S831A, S948A, S969A) was expressed in E. coli with a glutathione S-transferase (GST) tag, immobilized on beads, and in vitro phosphorylated with soluble Atg1. Proteins were analyzed by Coomassie staining, and radioactive incorporation was assessed by autoradiography. Note that all highly regulated Atg1 consensus sites are mutated in this 4A mutant, as S19 and S657 are not part of the C-terminal fragment. See also Figures S2, S5, and Table S1.
Figure 3
Figure 3
Atg1-Dependent Phosphorylation of Atg9 Is Required for Cvt and Autophagy Function (A) Endogenously TAP-tagged wild-type Atg9, Atg9 3A or 3D (S657A/D, S831A/E, S948A/D), 5A or 5D (S19A/D, S802A/D, S831A/E, S948A/D, S969A/D), 6A or 6D mutants (S19A/D, S657A/D, S802A/D, S831A/E, S948A/D, S969A/D), or atg9Δ cells were grown to mid-log phase. Processing of endogenous Ape1 was analyzed by western blotting and quantified by calculating the relative ratio of cleaved versus uncleaved Ape1 normalized to the wild-type. Expression of Atg9 proteins was assessed by anti-protein A western blotting. Note that the 5A/D mutants contain all the mutations as the 6A/D mutants except for S657, which is located close to a predicted transmembrane domain. (B) pho8Δ60pho13Δatg9Δ cells expressing TAP-tagged Atg9 wild-type, Atg9-3A, 3D, 5A, 5D, 6A, or 6D mutants, or an empty plasmid were grown to mid-log phase and starved for 5 hr in SD-N medium (starvation medium; 0.17% yeast nitrogen base without amino acids, 2% glucose). Pho8Δ60-specific alkaline phosphatase (ALP) activity (nmol/[min × mg]) was measured in four independent experiments as described in the Experimental Procedures, and the mean was plotted normalized to wild-type ALP activity. Differences from wild-type are statistically significant: ∗∗p < 0.01, ∗∗∗p < 0.001. Error bars represent normalized standard deviation. (C) ypt7Δ Atg9-myc wild-type or 6A or 6D mutant cells were treated with rapamycin and converted to spheroplasts. Total-cell extracts from lysed spheroplasts were centrifuged and the pellet fraction was either not treated or mixed with proteinase K (protK) and/or Triton X-100 (TX100). After protein precipitation, samples were analyzed by western blotting with anti-Ape1 antibodies. The ypt7Δ background was used to inhibit the fusion of autophagosomes with the vacuole to prevent Ape1 processing by vacuolar enzymes, which would complicate the comparison of autophagy mutants to wild-type cells. (D) Histone H3-HA (H3HA)-tagged Atg1 was expressed together with Atg9 wild-type or the Atg9-6A or Atg9-6D mutant fused to 9× myc and Suv39 methyltransferase (HKMT) in atg1Δatg9Δ cells, or as a control with Pbs2-HKMT in atg9Δ cells. Logarithmically growing cultures were treated with rapamycin for 1 hr, and methylation was assessed by western blotting with an anti-trimethylation-specific antibody after preparing cell extracts by freezer milling and HA immunoprecipitation of Atg1-H3HA. Note that HKMT-tagged Atg9 and H3HA-tagged Atg1 are fully functional. (E) GST, GST-Atg9757–997 wild-type, and the 4A mutant were expressed in E. coli, immobilized on beads, and incubated with soluble Atg1. Bound protein was assessed by anti-Atg1 western blotting, and the GST fusion proteins were visualized by Ponceau S staining. (F) Atg1-TAP, Atg1-TAP atg9Δ, Atg1-TAP atg13Δ, and Atg1-TAP atg18Δ cells were grown to mid-log phase and treated for 1 hr with rapamycin. Atg1 was immunoprecipitated and its autophosphorylation and model substrate (MBP) phosphorylation activity was measured by autoradiography in vitro. Anti-protein A blots shown in one panel are from the same blot with the same exposure. See also Figure S2.
Figure 4
Figure 4
Atg9 Mutants Are Defective in PAS Recruitment of and Interaction with Atg18 (A) Localization of Atg9-GFP wild-type, Atg9-6A-GFP, and Atg9-6D-GFP was analyzed after 30 min of rapamycin treatment. PAS accumulation is marked by arrows. The scale bar represents 5 μm. (B) Mean PAS intensity, PAS area, and cell intensity were quantified. No statistically significant difference was found. Error bars represent standard deviation. (C and D) Dot formation of Atg18-GFP was quantified in atg9Δ cells containing Atg9-TAP wild-type, Atg9-6A-TAP, Atg9-6D-TAP, or an empty plasmid after a 1 hr rapamycin treatment. In two individual experiments at least 310 cells per mutant were counted blindly. The statistical significance of the difference from wild-type was calculated: P6A: 0.0148; P6D: 0.0094; Pdelta: 0.0014. p < 0.05, ∗∗p < 0.01. Error bars represent standard deviation. Representative fluorescence images are shown in (C). The scale bar represents 5 μm. (E) atg18Δ Atg9-GFP wild-type, 6A or 6D, and atg18Δatg1Δ Atg9-GFP and atg18Δatg9Δ cells containing Atg18-TAP or an empty plasmid were grown to logarithmic phase and treated with rapamycin for 1 hr. Atg18 was immunoprecipitated, and its association with Atg9 was analyzed by anti-GFP immunoblotting. (F) atg18Δ Atg9-GFP cells containing Atg18-TAP were immunoprecipitated and incubated with or without λ-phosphatase. Bound protein was analyzed by anti-GFP western blotting. The total extracts are shown (input). See also Figures S3 and S4.
Figure 5
Figure 5
Atg9 Mutants Are Defective in Atg8 Recruitment to the PAS and Fail to Form an Isolation Membrane (A and B) Dot formation of Atg8-GFP was quantified in atg9Δ cells containing Atg9-TAP wild-type, Atg9-6A-TAP, Atg9-6D-TAP, or an empty plasmid after a 1 hr rapamycin treatment. In two individual experiments at least 285 cells per mutant were counted. Error bars represent standard deviation. Representative fluorescence images are shown in (A). The scale bar represents 5 μm. (C) GFP-Atg8 Ape1-mRuby2 Atg9-TAP wild-type, 6A, 6D, or atg9Δ strains containing CUP1-Ape1 were grown to logarithmic phase. Overexpression of Ape1 was induced by addition of 250 nM copper sulfate for 3 hr, and autophagy was induced by treating cells for 1 hr with rapamycin. The scale bar represents 2.5 μm. (D and E) The association of Atg8 with Ape1 structures (D) and the number of elongated isolation membranes (E) was quantified. Error bars represent standard deviation. See also Figure S4.
Figure 6
Figure 6
Atg1-Dependent Atg9 Phosphorylation Regulates Autophagy Atg9 vesicles are recruited to the PAS, where Atg9 is phosphorylated by Atg1 on six consensus sites. This allows the efficient recruitment of Atg18 and Atg8 to the PAS (i) and Atg9 binding to Atg18 (ii), which is required for isolation membrane elongation (iii) for autophagy and the Cvt pathway to function.

References

    1. Baskaran S., Ragusa M.J., Boura E., Hurley J.H. Two-site recognition of phosphatidylinositol 3-phosphate by PROPPINs in autophagy. Mol. Cell. 2012;47:339–348. - PMC - PubMed
    1. Chen G.-C., Lee J.Y., Tang H.-W., Debnath J., Thomas S.M., Settleman J. Genetic interactions between Drosophila melanogaster Atg1 and paxillin reveal a role for paxillin in autophagosome formation. Autophagy. 2008;4:37–45. - PubMed
    1. Crooks G.E., Hon G., Chandonia J.-M., Brenner S.E. WebLogo: a sequence logo generator. Genome Res. 2004;14:1188–1190. - PMC - PubMed
    1. Di Bartolomeo S., Corazzari M., Nazio F., Oliverio S., Lisi G., Antonioli M., Pagliarini V., Matteoni S., Fuoco C., Giunta L. The dynamic interaction of AMBRA1 with the dynein motor complex regulates mammalian autophagy. J. Cell Biol. 2010;191:155–168. - PMC - PubMed
    1. Hara T., Takamura A., Kishi C., Iemura S.-I., Natsume T., Guan J.-L., Mizushima N. FIP200, a ULK-interacting protein, is required for autophagosome formation in mammalian cells. J. Cell Biol. 2008;181:497–510. - PMC - PubMed

Publication types

MeSH terms