. 2014 Jan 30;6(2):313-24.
doi: 10.1016/j.celrep.2013.12.032. Epub 2014 Jan 16.

ZFHX4 interacts with the NuRD core member CHD4 and regulates the glioblastoma tumor-initiating cell state

Affiliations

ZFHX4 interacts with the NuRD core member CHD4 and regulates the glioblastoma tumor-initiating cell state

Yakov Chudnovsky et al. Cell Rep. .

Abstract

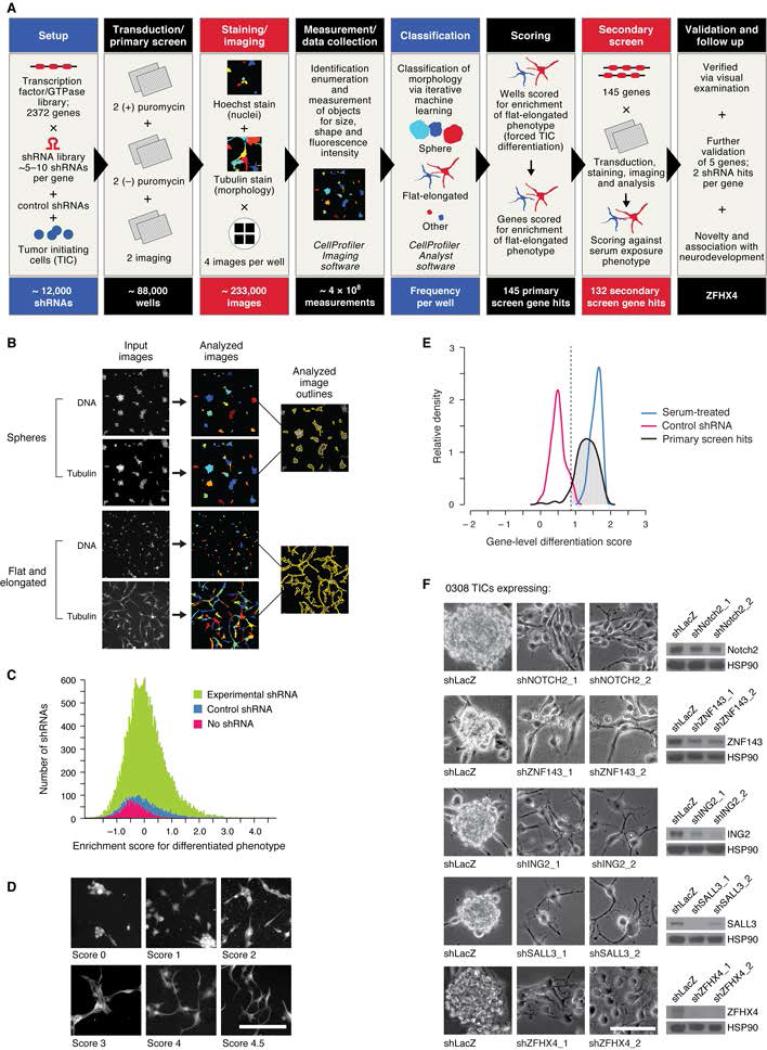
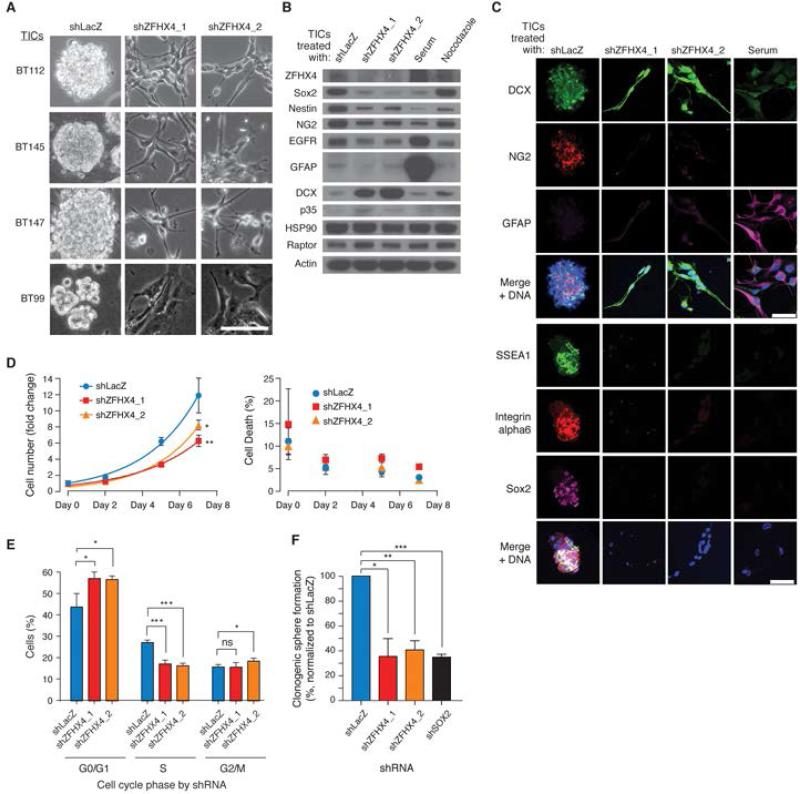
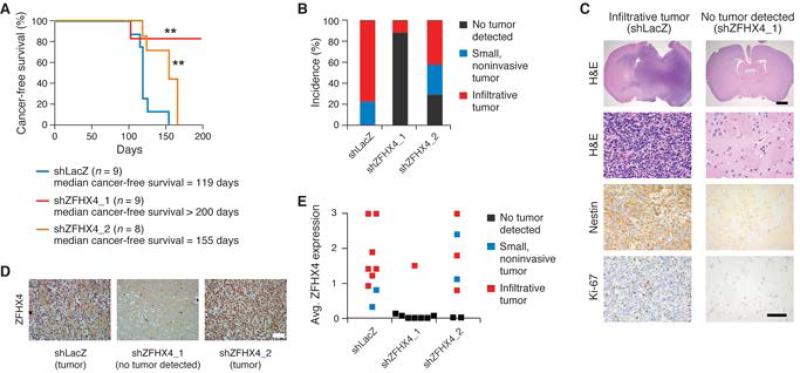
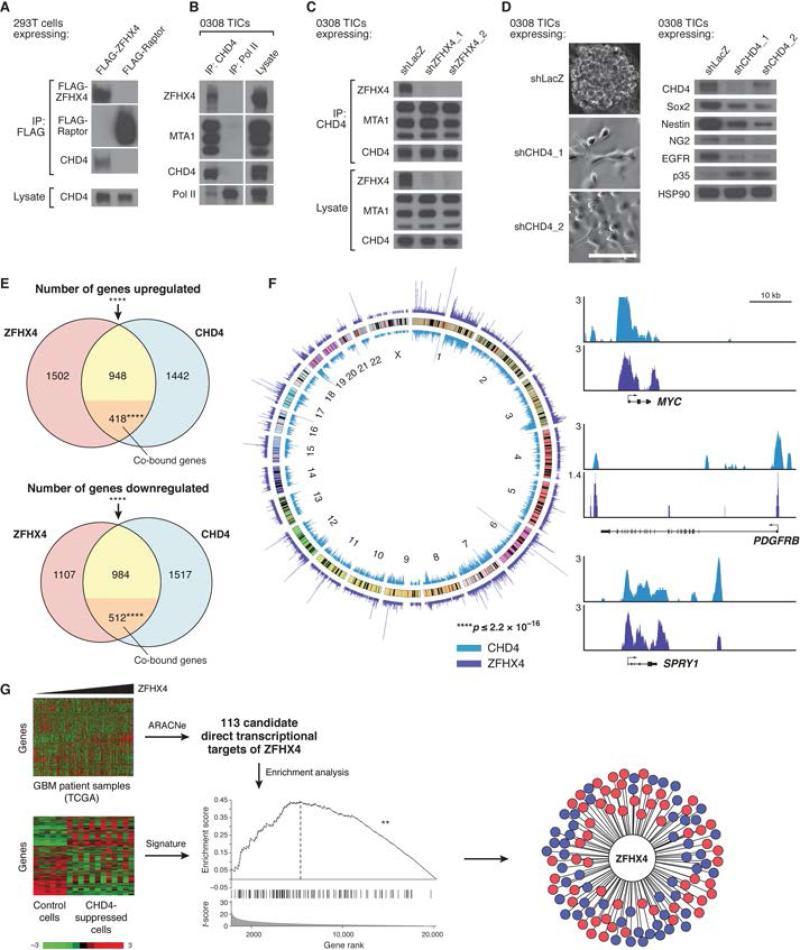
Glioblastoma (GBM) harbors subpopulations of therapy-resistant tumor-initiating cells (TICs) that are self-renewing and multipotent. To understand the regulation of the TIC state, we performed an image-based screen for genes regulating GBM TIC maintenance and identified ZFHX4, a 397 kDa transcription factor. ZFHX4 is required to maintain TIC-associated and normal human neural precursor cell phenotypes in vitro, suggesting that ZFHX4 regulates differentiation, and its suppression increases glioma-free survival in intracranial xenografts. ZFHX4 interacts with CHD4, a core member of the nucleosome remodeling and deacetylase (NuRD) complex. ZFHX4 and CHD4 bind to overlapping sets of genomic loci and control similar gene expression programs. Using expression data derived from GBM patients, we found that ZFHX4 significantly affects CHD4-mediated gene expression perturbations, which defines ZFHX4 as a master regulator of CHD4. These observations define ZFHX4 as a regulatory factor that links the chromatin-remodeling NuRD complex and the GBM TIC state.


Figures

Figure 1
Figure 1
Large-scale loss of function screen, confirmation screen, and validation experiments identify genes that regulate TIC morphology, including ZFHX4. (A) Schematic of high content imaging shRNA screen and follow up. (B) CellProfiler software identified individual cells and multicellular structures and measured 147 different parameters per object. (C) Distribution of enrichment scores of differentiated flat, elongated morphology by gene-targeting shRNA or control in primary screen. (D) Representative screen images with associated enrichment scores from the primary screen. (E) Confirmation screen results for 145 gene hits from the primary screen. Relative frequency histogram of gene-level differentiation scores. Serum-treated wells served as positive controls, and non-targeting shRNA wells served as negative controls. Dashed line indicates score cutoff for genes scoring at least as well as serum treatment; 132 genes (hash marks under the black curve, to the right of the dashed line) met this criteria. (F) Bright-field images (left) and immunoblots (right) of 0308 TICs transduced with a control shRNA or two different shRNAs targeting five validated gene hits from the confirmation screen. Scale bars: 100μm each. See also Figure S1, Table S1.
Figure 2
Figure 2
ZFHX4 suppression causes loss of stem cell-like features and reduces proliferation of GBM TICs. (A) Bright-field images; ZFHX4 suppression induced a differentiated flat, elongated morphology in BT112, BT145, BT147, and BT99 glioma TIC lines. Scale bar: 100μm. (B) Decreased expression of stem cell markers Sox2, Nestin, and NG2 and the GBM oncogene EGFR, and increased expression of neuronal markers DCX and p35 in 0308 TICs in which ZFHX4 was suppressed. Serum treatment served as a positive control for loss of stem cell markers (Lee et al., 2006), whereas nocodazole treatment arrested cell growth. (C) Immunofluorescent images showing downregulation of the stem cell markers NG2, SSEA1, Integrin alpha6, and Sox2, and upregulation of the neuronal marker DCX in 0308 TICs upon ZFHX4 suppression. Scale bars: 50μm. (D) Effects of ZFHX4 suppression on cell growth and viability of 0308 TICs. For fold change at day 7, ** p=0.0025 shLacZ vs. shZFHX4_1, * p=0.0166 shLacZ vs. shZFHX4_2, two-tailed t-tests. Error bars reflect standard deviations; n=4. (E) Effects of ZFHX4 suppression on cell cycle of 0308 TICs. G0/G1: * p= 0.0258 shLacZ vs. shZFHX4_1, * p=0.0237 vs. shZFHX4_2; S: *** p=0.0007 shLacZ vs. shZFHX4_1, *** p=0.0001 shLacZ vs. shZFHX4_2; G2/M: * p=0.0343 shLacZ vs. shZFHX4_2, two-tailed t-tests. Error bars reflect standard deviations; n=3. (F) Effects of ZFHX4 suppression on clonogenic sphere formation by 0308 TICs. shSOX2 served as positive control. * p=0.0160 shLacZ vs. shZFHX4_1, ** p=0.0051 shLacZ vs. shZFHX4_2, and *** p=0.0004 shLacZ vs. shSOX2, two-tailed t-tests. Error bars reflect standard deviations; n=3. See also Figure S2.
Figure 3
Figure 3
ZFHX4 expression is required for TIC-driven tumorigenesis. (A) Kaplan-Meier cancer-free survival curves of mice intracranially injected with BT112 TICs transduced with indicated shRNAs. ** p=0.0057 shLacZ vs. shZFHX4_1 and p=0.0098 shLacZ vs. shZFHX4_2, Mantel-Cox log-rank test. (B) Percent incidence of animals with no tumor detected; small, noninvasive tumors; and infiltrative tumors in the three groups. (C) Representative immunohistochemical (IHC) images of H&E, NESTIN, and Ki-67 staining of infiltrative glioma tissue and tumor-free brain tissue. Scale bars: top row, 500μm; all others, 50μm. (D) Representative images of ZFHX4 IHC of brain tissue from the three groups. Scale bar: 50μm. (E) IHC-based scoring of ZFHX4 expression in all post-mortem tissue samples, on a scale of 0 to 3. A score of 0 indicates absence of 3,3’-diaminobenzidine (DAB) chromogen signal, while 3 indicates saturation of signal within the nuclei. See also Figure S3.
Figure 4
Figure 4
ZFHX4 interacts with CHD4, CHD4 suppression phenocopies ZFHX4 suppression, ZFHX4 and CHD4 regulate overlapping gene sets and co-localize throughout the genome, and ZFHX4 is a master regulator of CHD4. (A) Immunoblots of FLAG immunoprecipitates (IPs) and lysates from HEK 293T cells transfected with FLAG tagged ZFHX4. FLAG tagged Raptor served as negative control. (B) Immunoblots of endogenous CHD4 and RNA Polymerase II (Pol II) IPs and lysate from 0308 TICs. MTA1, a known member of the NuRD complex (Lai and Wade, 2011; Ramirez and Hagman, 2009), was used as a positive control for co-IP with CHD4. (C) Immunoblots of endogenous CHD4 IPs and lysates from 0308 TICs transduced with control (shLacZ) or ZFHX4-targeting shRNAs. (D) Bright-field images in neurosphere culture (left) and immunoblots in adherent culture (right) of 0308 TICs transduced with control or CHD4-targeting shRNAs, showing induction of flat, elongated morphology, decreased expression of SOX2, NESTIN, NG2, and EGFR, and increased expression of p35 upon CHD4 silencing. Scale bar: 100μm. (E) Venn diagrams demonstrating the overlap of genes significantly upregulated or downregulated after ZFHX4 or CHD4 suppression in 0308 TICs, as well as enrichment of upregulated or downregulated intersecting genes for those genes that were shown in ChIP-Seq to be co-bound by ZFHX4 and CHD4 (orange sub-regions). **** p≤2.2×10⁻¹⁶ for significantly upregulated or downregulated intersecting genes, p=1.5×10⁻¹³ for enrichment of upregulated intersecting genes for co-bound genes, p≤2.2×10⁻¹⁶ for enrichment of downregulated intersecting genes for co-bound genes, chi-square tests. (F) ChIP-Seq results from 0308 TICs, showing significant overlap between ZFHX4-bound and CHD4-bound genomic regions. Left: whole-genome plot of mapped reads from CHD4 (blue) and ZFHX4 (purple) ChIP-Seq. Middle circle: chromosomes (labeled in innermost circle), with cytogenetic bands shown. Peaks show reads per million. For overlap of ZFHX4- and CHD4-bound regions, enrichment over expected = 30-fold, p≤2.2×10⁻¹⁶, two-tailed Fisher's exact test. Right: ChIP-Seq binding profiles (reads per million) for CHD4 and ZFHX4 at the MYC, PDGFRB, and SPRY1 loci, with the y-axis floor set to 1. (G) Identification of ZFHX4 as a likely master regulator of CHD4 using ARACNe and GSEA. Left: the ARACNe algorithm was used to identify candidate transcriptional targets of ZFHX4 from 273 microarray expression profiles (top) of primary glioblastoma patient samples. In parallel, microarray analysis (bottom) of control-treated 0308 TICs (expressing an anti-LacZ shRNA) and CHD4-suppressed TICs (both day 3 and day 5 post-transduction, both shRNAs) generated a signature consisting of a ranked list of genes, from most- to least-differentially-expressed, in CHD4-suppressed versus control cells. The heat maps were generated after z-score transforming the expression values for each gene across all samples and capping the values at −3 and 3. Middle: GSEA was used to compute enrichment of candidate ZFHX4 targets in the CHD4 suppression signature. Enrichment scores were computed using a Kolmogorov-Smirnov test. ** p=0.002, non-parametric test with sample shuffling. Right: wheel plot illustrating that ZFHX4 is likely a master regulator of CHD4, with 58 (red) out of the 113 (red and blue) candidate ZFHX4 targets enriched upon CHD4 suppression. See also Figure S4, Tables S2 and S3, and Data S1.

References

    1. Bao S, Wu Q, McLendon RE, Hao Y, Shi Q, Hjelmeland AB, Dewhirst MW, Bigner DD, Rich JN. Glioma stem cells promote radioresistance by preferential activation of the DNA damage response. Nature. 2006;444:756–760. - PubMed
    1. Barrett LW, Fletcher S, Wilton SD. Regulation of eukaryotic gene expression by the untranslated gene regions and other non-coding elements. Cell Mol Life Sci. 2012;69:3613–3634. - PMC - PubMed
    1. Bhat KP, Balasubramaniyan V, Vaillant B, Ezhilarasan R, Hummelink K, Hollingsworth F, Wani K, Heathcock L, James JD, Goodman LD, et al. Mesenchymal differentiation mediated by NF-kappaB promotes radiation resistance in glioblastoma. Cancer Cell. 2013;24:331–346. - PMC - PubMed
    1. Carpenter AE, Jones TR, Lamprecht MR, Clarke C, Kang IH, Friman O, Guertin DA, Chang JH, Lindquist RA, Moffat J, et al. CellProfiler: image analysis software for identifying and quantifying cell phenotypes. Genome Biol. 2006;7:R100. - PMC - PubMed
    1. Carro MS, Lim WK, Alvarez MJ, Bollo RJ, Zhao X, Snyder EY, Sulman EP, Anne SL, Doetsch F, Colman H, et al. The transcriptional network for mesenchymal transformation of brain tumours. Nature. 2010;463:318–325. - PMC - PubMed

Publication types

MeSH terms