. 2014 Apr;22(4):774-85.
doi: 10.1038/mt.2014.3. Epub 2014 Jan 20.

Uncovering and dissecting the genotoxicity of self-inactivating lentiviral vectors in vivo

Affiliations

Uncovering and dissecting the genotoxicity of self-inactivating lentiviral vectors in vivo

Daniela Cesana et al. Mol Ther. 2014 Apr.

Abstract

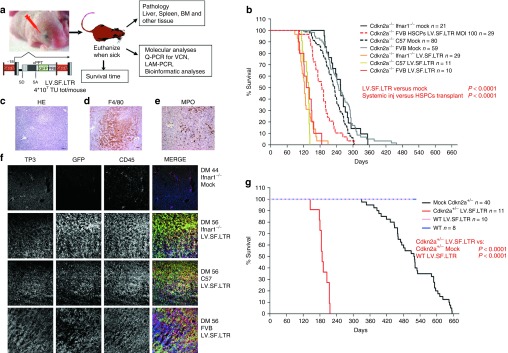
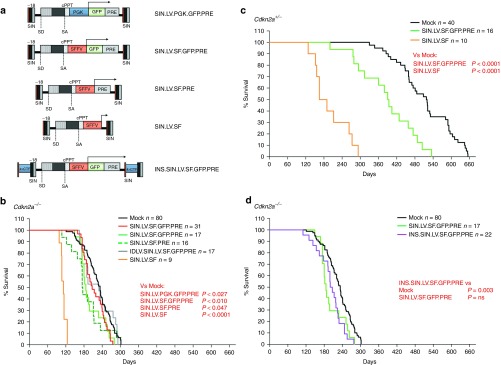
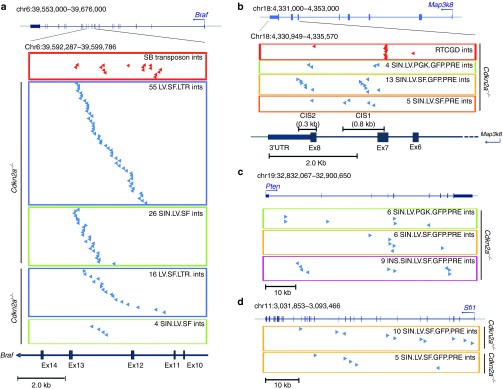
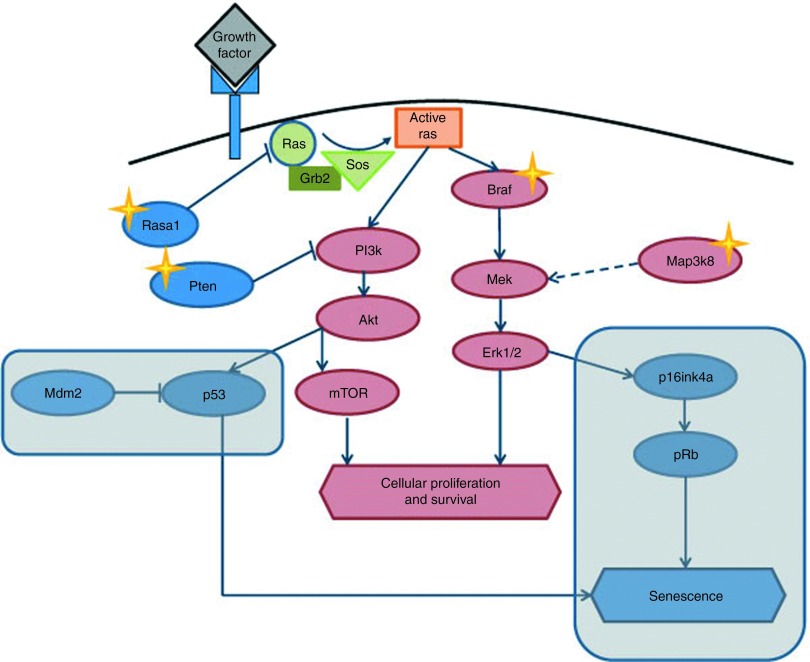
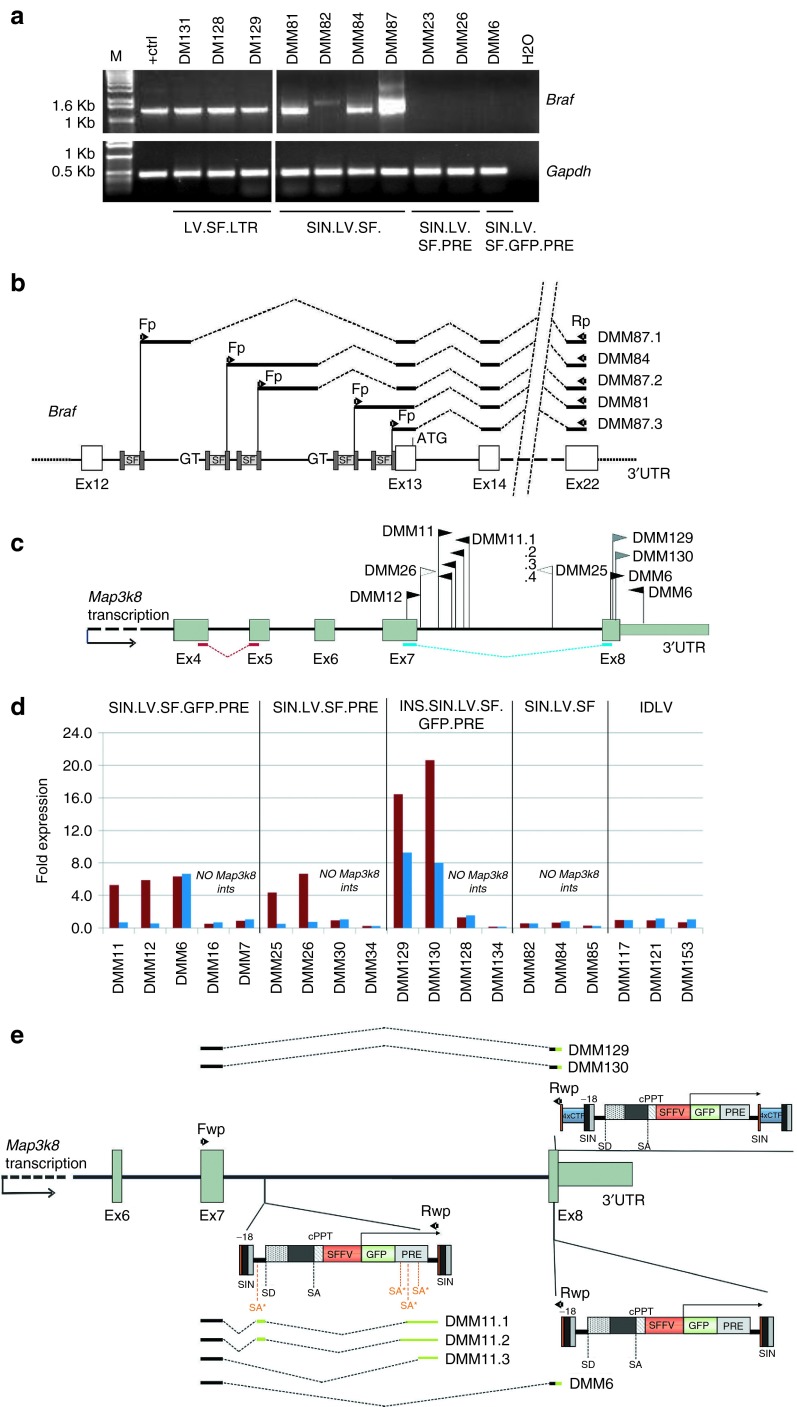
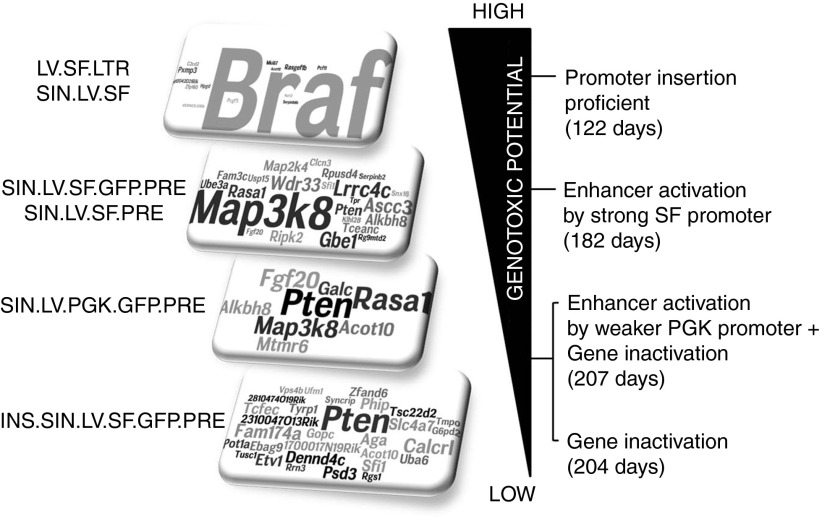
Self-inactivating (SIN) lentiviral vectors (LV) have an excellent therapeutic potential as demonstrated in preclinical studies and clinical trials. However, weaker mechanisms of insertional mutagenesis could still pose a significant risk in clinical applications. Taking advantage of novel in vivo genotoxicity assays, we tested a battery of LV constructs, including some with clinically relevant designs, and found that oncogene activation by promoter insertion is the most powerful mechanism of early vector-induced oncogenesis. SIN LVs disabled in their capacity to activate oncogenes by promoter insertion were less genotoxic and induced tumors by enhancer-mediated activation of oncogenes with efficiency that was proportional to the strength of the promoter used. On the other hand, when enhancer activity was reduced by using moderate promoters, oncogenesis by inactivation of tumor suppressor gene was revealed. This mechanism becomes predominant when the enhancer activity of the internal promoter is shielded by the presence of a synthetic chromatin insulator cassette. Our data provide both mechanistic insights and quantitative readouts of vector-mediated genotoxicity, allowing a relative ranking of different vectors according to these features, and inform current and future choices of vector design with increasing biosafety.


Figures

Figure 1
Figure 1
In vivo experimental strategy and Kaplan–Meier survival curves. (a) Experimental strategy. LV.SF.LTR vector was systemically administered to newborn Cdkn2a−/− mice by temporal vein injection. Mice are sacrificed when they displayed signs of illness, and bone marrow, spleen, liver, and other organs were harvested for blinded histopathology and molecular analyses; see Supplementary Methods for details. Scheme of the proviral forms of the LV.SF.LTR vector tested: SFFV: enhancer/promoter of the spleen focus–forming virus U3 LTR. SD, SA: viral splice donor/acceptor sites; cPPT, central polypurine tract. PRE, posttranscriptional regulatory element from the woodchuck hepatitis virus. Transgene transcript is indicated by arrows. (b) Kaplan–Meier survival curves of mock mice and mice injected with LV.SF.LTR vector (n = number of mice). All mock control mice died, with similar median survivals among the strains: 233 days for Cdkn2a−/− C57, 248 days for 10 Cdkn2a−/− FVB, and 255 days for Cdkn2a−/− Ifnar1−/−. All LV.SF.LTR-treated mice died significantly earlier (median survival: 138 days for Cdkn2a−/− C57, 135 days for 10 Cdkn2a−/− FVB, and 123 days for Cdkn2a−/− Ifnar1−/−) than their untransduced strain-matched controls (mock, P < 0.0001), and their survival was significantly shorter than that of mice transplanted with Cdkn2a−/− hematopoietic stem progenitor cells (HSPCs) transduced with the same vector (Cdkn2a−/− FVB HSPCs LV.SF.LTR MOI 100, red dashed line, 187 days median survival, P < 0.0001). (c) Representative example of hematoxylin-and-eosin-stained sections (original magnification ×10 ) of the liver infiltrated by hematopoietic tumor cells. (d,e) Immunohistochemical analysis (original magnification ×20) reveals that hematopoietic tumor cells infiltrating the liver are (d) F4/80+ and (e) MPO. (f) Representative immunofluorescence-stained sections (original magnification ×20) of tumor-infiltrated liver. Each row represents a single mouse. Immunofluorescence analysis of liver from an untreated Cdkn2a−/−Ifnar−/− mouse (first row) and from tumor-infiltrated liver from the different strains of Cdkn2a−/− mice injected with LV.SF.LTR. In column order, from left to right: TO-PRO3, for nuclei (TP3); green fluorescent protein (GFP) for vector marking, CD45 as pan-leukocyte marker; and merge of the three channels. GFP and CD45 costaining confirmed that the tumor infiltrating the liver in the LV.SF.LTR group of mice was of hematopoietic origin and vector marked. (g) Kaplan–Meier survival curves of Cdkn2a+/− and wild-type (WT) mice injected with LV.SF.LTR vector. Survival of Cdkn2a+/− mice injected with the highly genotoxic vector was significantly shorter (median survival of 188 days) than that of their untransduced strain-matched controls (mock, P < 0.0001); whereas WT mice injected with the same vector did not develop any tumor in the 520 days of observation.
Figure 2
Figure 2
Vectors tested and Kaplan–Meier survival curves of mice treated with Cdkn2a−/− and Cdkn2a+/−. (a) Scheme of the proviral forms of the SIN LVs systemically administered to newborn Cdkn2a−/− or Cdkn2a+/− mice by temporal vein injection. The strategy has been described in Figure 1a; SIN: self-inactivating long terminal repeats; SFFV: enhancer/promoter of the spleen focus–forming virus. SD, SA: viral splice donor/acceptor sites. cPPT, central polypurine tract; PRE, posttranscriptional regulatory element from the woodchuck hepatitis virus. 4xCTF: insulator sequences made by four CAAT-box binding transcription factor (CTF) binding sites. Transgene transcript is indicated by arrows. (b–d) Kaplan–Meier survival curves of (b,d) Cdkn2a−/− and (c) Cdkn2a+/− mice injected with the indicated vector (n = number of injected mice for each group). Survival of SIN.LV.SF-treated mice was significantly shorter than that of their untransduced strain-matched controls (P < 0.0001, for both Cdkn2a−/−- and Cdkn2a+/−-injected mice, median survival: 112 and 178 days, respectively). For SIN LVs, survival of SIN.LV.PGK.GFP.PRE-, SIN.LV.SF.GFP.PRE-, and SIN.LV.SF.PRE-treated mice was shorter than that of their untransduced strain-matched controls (in Cdkn2a−/−, P = 0.027 for SIN.LV.PGK.GFP.PRE and median survival of 207 days; P = 0.01 for SIN.LV.SF.GFP.PRE and 186 days; P = 0.047 for SIN.LV.SF.PRE and 175 days; P = 0.003 for INS.SIN.LV.SF.GFP.PRE and 203 days; and in Cdkn2a+/−, P < 0.0001 for SIN.LV.SF.GFP.PRE and 392 days).
Figure 3
Figure 3
Distribution of vector integrations in the highly targeted genes. (a) Genomic position of 71 LV.SF.LTR and 30 SIN.LV.SF integrations in tumor-infiltrated liver targeting introns 11 and 12 of Braf in Cdkn2a−/− and Cdkn2a+/−. Chromosome number and coordinates of Braf and its genomic structure are indicated on top (blue boxes and vertical bars indicate exons; blue arrows indicate the start site and orientation of transcription). On the bottom, the genomic interval covering the targeted region is enlarged and indicated. In the red boxes, red arrows represent sleeping beauty integrations retrieved from sarcomas in Arf−/− mice. In the blue and green boxes, blue arrows indicate the position and orientation of LV.SF.LTR and SIN.LV.SF integrations with respect to the targeted gene in tumor-infiltrated liver from Cdkn2a−/− and Cdkn2a+/−, as indicated. (b) Genomic position of the vector integrations in tumor-infiltrated liver targeting Map3k8 gene in Cdkn2a−/− (scheme as in a). On the bottom, the genomic interval covering the targeted 3′ portion of the Map3k8 gene is enlarged. In the red boxes, red arrows represented retroviral integrations from the RTCGD database targeting the same genomic regions. In the green, yellow, and orange boxes, blue arrows indicate SIN.LV.PGK.GFP.PRE, SIN.LV.SF.GFP.PRE, and SIN.LV.SF.PRE integrations in tumor-infiltrated liver from Cdkn2a−/−, as indicated. (c) Genomic position of SIN.LV.SF.GFP.PRE integrations in tumor-infiltrated liver targeting Pten gene in Cdkn2a−/− (scheme as in a). In the green, yellow, and pink boxes, blue arrows indicate SIN.LV.PGK.GFP.PRE, SIN.LV.SF.GFP.PRE, and INS.SIN.LV.SF.GFP.PRE integrations in tumor-infiltrated liver from Cdkn2a−/−, as indicated. (d) Genomic position of vector integrations in tumor-infiltrated liver targeting Sfi1 gene in Cdkn2a−/− and in Cdkn2a+/− (scheme as in a). Yellow boxes indicate SIN.LV.SF.GFP.PRE integrations found in tumor-infiltrated liver from Cdkn2a−/− and Cdkn2a+/− and the integrations found in tumors due to SIN.LV.SF.PRE, as indicated.
Figure 4
Figure 4
The receptor tyrosine kinase (RTK) signaling pathway is frequently hit by lentiviral vector (LV) integration. The RTK pathway is frequently activated in human and murine tumors by several mechanisms. Several of the common insertion site (CIS) genes identified in our model, such as Braf, Map3k8, Rasa1, and Pten, belong to the RTK pathway. The LV integration in these genes may collaborate with the genetic lesion of the Cdkn2a−/− mice to activate the RTK pathway and induce tumorigenesis. Genes of the RTK pathway that promote cellular proliferation and survival are indicated in red, whereas genes that promote cell cycle arrest and senescence are indicated in blue. The rounded rectangles highlight the pathways that are deficient in Cdkn2a−/− mice. Stars indicate the genes of the pathway that are CISs in our model.
Figure 5
Figure 5
Mechanism of insertional mutagenesis by SF-containing lentiviral vectors (LVs) with different designs. (a) Reverse transcription–polymerase chain reaction (RT–PCR) on cDNA from tumor-infiltrated liver from the indicated vector-treated mice. Primers on the U5′ LV long terminal repeats (LTR) and exon 22 of Braf were used, and these amplified a 1,500-bp product only in the group of mice that received LV.SF.LTR or SIN.LV.SF vector (M, molecular size markers; + ctrl, LV/Braf–positive control (ref. 2)); tumor cDNA of the indicated mouse. For each sample, RT–PCR using primers complementary to Gapdh was also performed as control. Fp and Rp arrows indicate the position of the primers used for the detection of LV/Braf chimeric transcripts; (b) schematic representation of the sequences of the RT–PCR products obtained in (a) from SIN.LV.SF-treated mice aligned to LV and to Braf exons. Black bars: amplified cDNA sequence; dashed lines: splicing events; Fp and Rp arrows: primers used for cDNA amplification; 3′UTR: 3′ untranslated region of Braf. The cDNA sequences were LV specific up to the end of the LTR and contained different portions of Braf intron 12 depending on the integration site, the cryptic splice donor site of the genome used to fuse the transcript to the splice junction of exon 13 of Braf. (c) Representation of SIN.LV.SF.GFP.PRE (black arrows), INS.SIN.LV.SF.GFP.PRE (blue arrows), and SIN.LV.SF.PRE (white arrows) integrations in the 3′ region of the Map3k8 gene in tumor-infiltrated liver of the mice tested for Map3k8 gene expression. Map3k8 genomic structure of 3′ portion is indicated: grey boxes indicate exons; black arrow indicates the orientation of transcription. Note that we draw the gene in reverse orientation. Arrows above the gene representation indicate the position and the orientation of the vector integrations with respect to gene transcription. Mouse ID is indicated for each integration site. (d) Expression levels of Map3k8 in tumor-infiltrated livers from mice injected with the indicated vector and harboring or not harboring a vector integration into the tested gene. For each mouse, the expression levels of the Map3k8 gene detected by the two probe sets used (probe sets Ex4-5 and Ex7-8) are indicated. The position of the probe set used for gene expression is indicated in c. In samples DMM129 and 130, probe sets Ex4-5 and Ex7-8 show different levels of overexpression of the two cDNA portions. It is unclear if these differences are caused by an effect of the integrations on Map3k8 mRNA splicing or interference with the qPCR assay. (e) Schematic representation of the Map3k8/LV aberrant transcript sequences obtained by RT–PCR from SIN.LV.SF.GFP.PRE- and INS.SIN.LV.SF.GFP.PRE-induced tumors with Map3k8 integrations and aligned to Map3k8 gene. For the RT–PCR, primers on the exon 7 of Map3k8 (Fp) and on ∆U3′ LV LTR (Rp) were used. The aberrant Map3k8 transcripts contain the exon 7 of the targeted gene spliced into internal portions of the SIN vector or fused with portions of the Map3k8 exon 8 colinear with the 5′ SIN LTR of the vector. Scheme as in b.
Figure 6
Figure 6
Summary of the vector-specific mechanisms of insertional mutagenesis and levels of vector genotoxicity in Cdkn2a−/− mice. Specific culprits of insertional mutagenesis were predominant when specific lentiviral vector (LV) designs were used to treat Cdkn2a−/− mice. For each vector design, we indicated the word cloud representation of the CIS gene identified and the major mechanism of insertional mutagenesis used with the relative median survival indicated into the brackets. In the word cloud representation (rectangles on the left), the most targeted genes are represented by larger letter size. The genotoxic potential of each vector varied from high (top), to moderate and low (bottom). The most genotoxic vectors were those capable of efficiently performing promoter insertion, such as LV.SF.LTR and SIN.LV.SF, leading to Braf activation (average of the median survival of the two groups is indicated). Vectors containing strong enhancer/promoters, such as SIN.LV.SF.GFP.PRE and SIN.LV.SF.PRE, efficiently performed enhancer-mediated activation of oncogenes as the main mechanism of insertional mutagenesis, leading to Map3k8 activation in our in vivo model (average of the median survival of the two groups is indicated). When SIN vectors contained moderate enhancer/promoters such as SIN.LV.PGK.GFP.PRE, both enhancer-mediated activation of oncogenes and gene inactivation are used as insertional mechanisms, promoting Map3k8 activation and inactivation of Pten and Rasa1 genes. Finally, when the activity of enhancers is shielded by the presence of insulator sequences, vector genotoxicity relies only on gene inactivation mechanisms.

References

    1. Montini E, Cesana D, Schmidt M, Sanvito F, Bartholomae CC, Ranzani M, et al. The genotoxic potential of retroviral vectors is strongly modulated by vector design and integration site selection in a mouse model of HSC gene therapy. J Clin Invest. 2009;119:964–975. - PMC - PubMed
    1. Montini E, Cesana D, Schmidt M, Sanvito F, Ponzoni M, Bartholomae C, et al. Hematopoietic stem cell gene transfer in a tumor-prone mouse model uncovers low genotoxicity of lentiviral vector integration. Nat Biotechnol. 2006;24:687–696. - PubMed
    1. Modlich U, Navarro S, Zychlinski D, Maetzig T, Knoess S, Brugman MH, et al. Insertional transformation of hematopoietic cells by self-inactivating lentiviral and gammaretroviral vectors. Mol Ther. 2009;17:1919–1928. - PMC - PubMed
    1. Arumugam PI, Higashimoto T, Urbinati F, Modlich U, Nestheide S, Xia P, et al. Genotoxic potential of lineage-specific lentivirus vectors carrying the beta-globin locus control region. Mol Ther. 2009;17:1929–1937. - PMC - PubMed
    1. Zychlinski D, Schambach A, Modlich U, Maetzig T, Meyer J, Grassman E, et al. Physiological promoters reduce the genotoxic risk of integrating gene vectors. Mol Ther. 2008;16:718–725. - PubMed

Publication types