. 2014 Apr;10(4):572-87.
doi: 10.4161/auto.27649. Epub 2014 Jan 14.

Autophagy is essential for cardiac morphogenesis during vertebrate development

Affiliations

Autophagy is essential for cardiac morphogenesis during vertebrate development

Eunmyong Lee et al. Autophagy. 2014 Apr.

Abstract

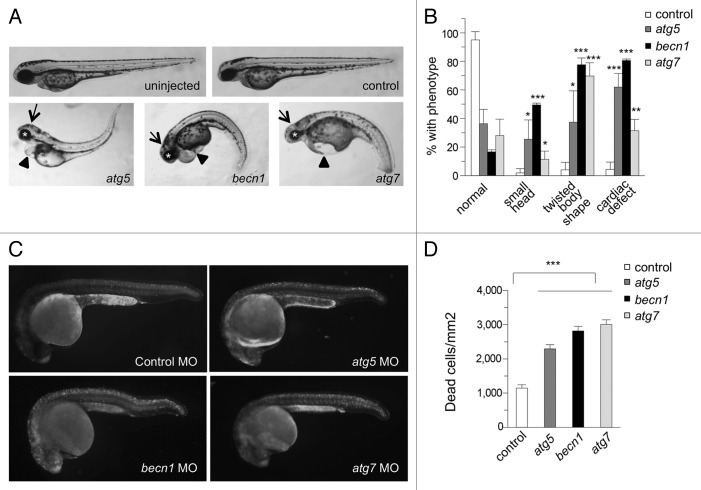
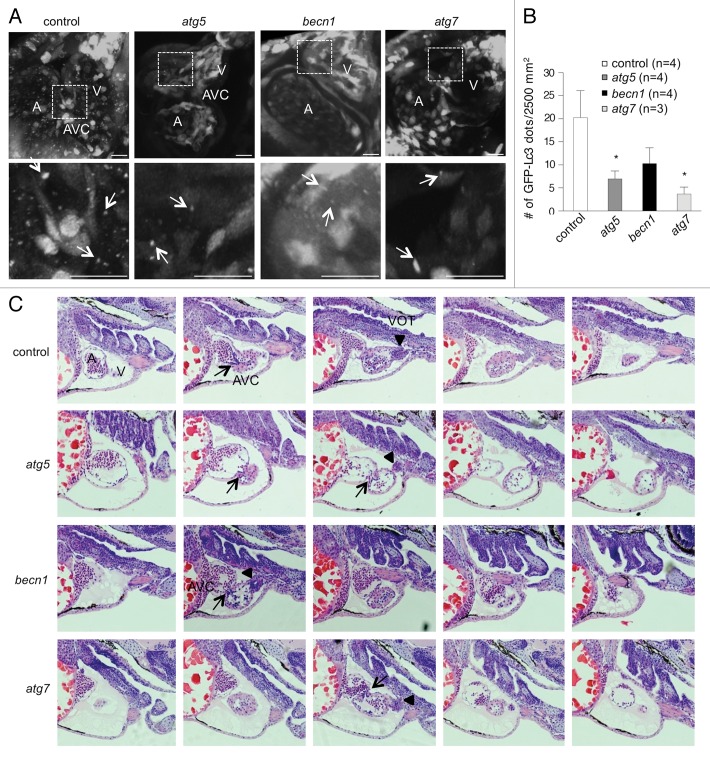
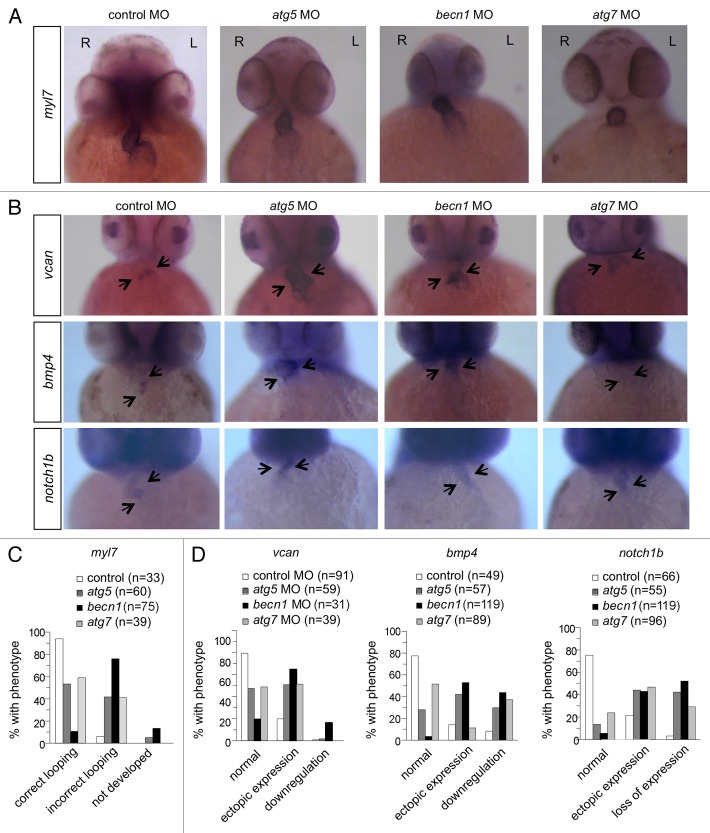
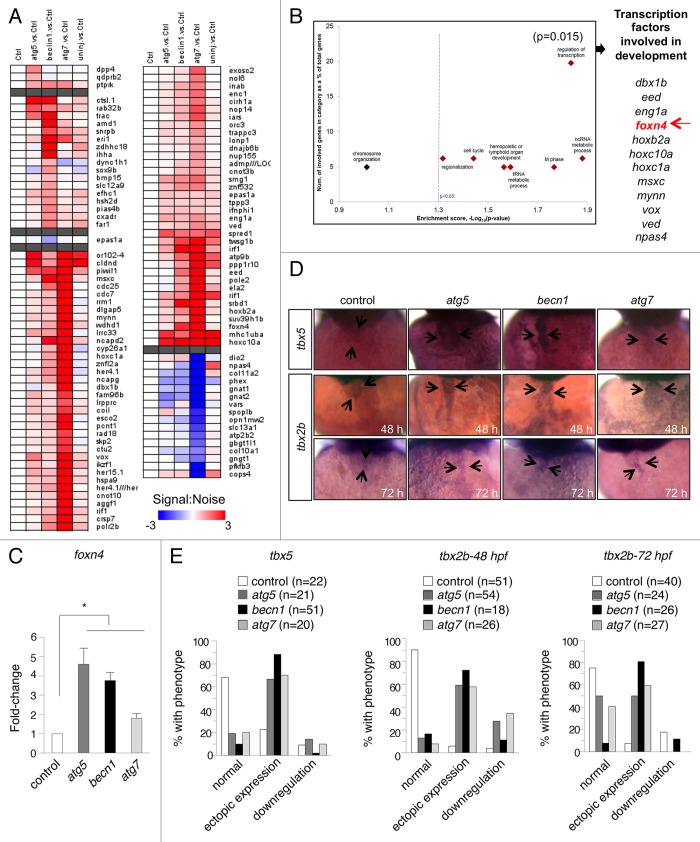
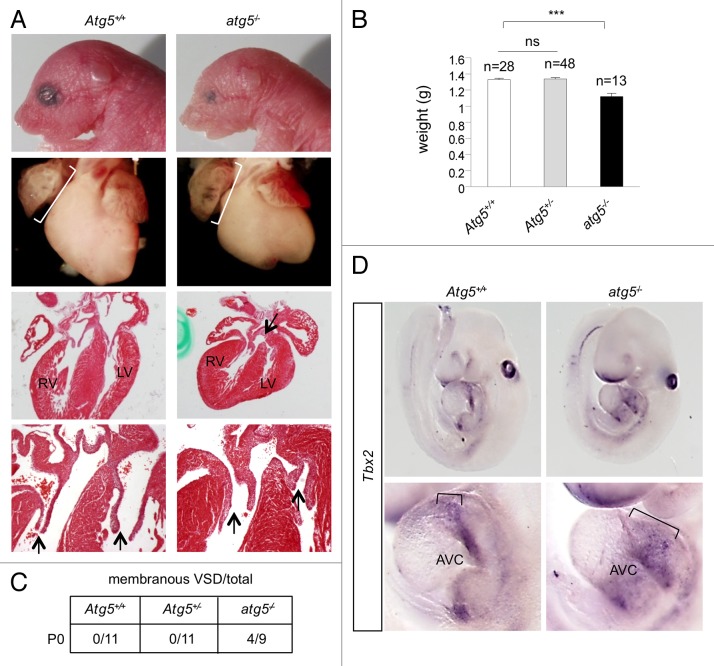
Genetic analyses indicate that autophagy, an evolutionarily conserved lysosomal degradation pathway, is essential for eukaryotic differentiation and development. However, little is known about whether autophagy contributes to morphogenesis during embryogenesis. To address this question, we examined the role of autophagy in the early development of zebrafish, a model organism for studying vertebrate tissue and organ morphogenesis. Using zebrafish that transgenically express the fluorescent autophagy reporter protein, GFP-LC3, we found that autophagy is active in multiple tissues, including the heart, during the embryonic period. Inhibition of autophagy by morpholino knockdown of essential autophagy genes (including atg5, atg7, and becn1) resulted in defects in morphogenesis, increased numbers of dead cells, abnormal heart structure, and reduced organismal survival. Further analyses of cardiac development in autophagy-deficient zebrafish revealed defects in cardiac looping, abnormal chamber morphology, aberrant valve development, and ectopic expression of critical transcription factors including foxn4, tbx5, and tbx2. Consistent with these results, Atg5-deficient mice displayed abnormal Tbx2 expression and defects in valve development and chamber septation. Thus, autophagy plays an essential, conserved role in cardiac morphogenesis during vertebrate development.

Keywords: atg5; atg7; autophagy; becn1; heart development; tbx2; zebrafish.


Figures

None
Figure 1. Autophagy is present during early zebrafish development and efficiently inhibited by autophagy gene knockdown. (A) Autophagy transcripts are expressed during early development in zebrafish. RT-PCR was performed using RNA isolated from 1-cell, sphere, germ ring, 5-somite, 24 hpf, and 2 dpf stage wild-type embryos using gene-specific primers. nRT, no-RT negative control. (B) Early autophagosomes (left) and autolysosomes (right) were detected in 10-somite stage embryos by electron microscopy. Scale bars, left: 200 nm, right: 500 nm. (C) GFP-Lc3 puncta were visualized by confocal microscopy in 15-somite stage embryos from Tg(cmv::GFP-lc3) fish. Left, z-stack images of somites. Right, GFP-Lc3 puncta in somites merged with bright-field image. Scale bars, left: 30 μm, right: 30 μm. (D) Expression of autophagy proteins after autophagy morpholino (MO) injection. Embryos were injected at the 1-cell stage with control or autophagy-specific MOs, and lysates were prepared for immunoblot analysis at 48 hpf. Top panel, immunoblot with anti-Atg5 antibody. Bottom panel, immunoblot with anti-Becn1 antibody. Actin is shown as a loading control. (E and F) Autophagy gene knockdown impairs autophagy in zebrafish. Primary cells were prepared from Tg(cmv:GFP-lc3) after MO injection and GFP-Lc3 puncta were visualized with confocal microscopy. (E) Representative images of GFP-Lc3 puncta in embryos injected with autophagy gene-specific and control MOs. (F) Quantification of data shown in (E). Representative results from one of 3 separate experiments, expressed as the mean ± SEM of 50 to 100 cells in each group. ***P < 0.001, **P < 0.01, *P < 0.05 for autophagy morphants vs. control morphants; one-tailed t test. (G) Representative immunoblots to detect Lc3 levels in control- and autophagy MO-injected fish. Lysates were prepared from primary cells for immunoblot after MO injection. Actin is shown as a loading control. Similar results were observed in 3 independent experiments. (H) Quantification of the ratio of Lc3-II/Actin for 3 independent experiments, including representative results shown in (G). Bars represent mean ± SEM. **P < 0.01, *P < 0.05 for autophagy morphants vs. control morphants; 2-tailed t test.
None
Figure 2. Autophagy gene knockdown in zebrafish results in developmental defects and increased numbers of dead cells. (A and B) Morphology of autophagy morphants at 2 dpf. (A) Representative images of autophagy morphants, which displayed small heads (arrows), abnormal eyes (asterisks), twisted body shapes and cardiac defects (arrowheads) at 2 dpf. (B) Quantification of phenotypes depicted in (A). Results represent the mean ± SEM of 3 independent experiments. ***P < 0.001, **P < 0.01, *P < 0.05 for autophagy morphants vs. control morphants; one-tailed t test. (C and D) Acridine orange (AO) staining of control and autophagy gene morphants at 1 dpf. AO-positive cells were counted in an area spanning from the end of the yolk extension to the end of tail. (D) Quantification of data shown in (C). Results represent the mean ± SEM of more than 40 embryos in each group. ***P < 0.001 for autophagy morphants vs. control morphants; one-tailed t test.
None
Figure 3. Autophagy gene knockdown results in abnormal cardiac development. (A and B) Autophagy is active during normal cardiac development and impaired by autophagy MOs. (A) Tg(cmv:GFP-lc3) embryos were injected with either control or autophagy MOs and imaged at 3 dpf using confocal microscopy. Representative images showing GFP-Lc3 puncta (white arrows) in atrium (A), ventricle (V) and AV canal (AVC). The areas delineated by the white dashed lines are shown at higher magnification in the bottom panel. (B) Quantification of data shown in (A). Results represent the mean ± SEM of more than 3 embryos in each group. *P < 0.05 vs. control morphants; one-tailed t test. (C) Hematoxylin and eosin staining of serial sagittal sections of hearts from representative control or autophagy morphants at 3 dpf. The head is positioned to the right. In the control morphant heart, the atrium, AV canal (arrow), ventricle, and ventricular outflow tract (arrow head) (from left to right) are visualized. All autophagy morphant hearts display pericardial edema. The atg5 and becn1 morphant hearts shown have enlarged atria compared with those from the control morphant. The becn1 morphant heart displays an accumulation of blood cells in the atrium. All autophagy morphant hearts shown contain the atrium and ventricle in the same plane indicating incorrect cardiac looping. VOT, ventricular outflow tract.
None
Figure 4. Autophagy gene knockdown results in abnormal cardiac looping and valve development. (A and C) In situ hybridization with a myl7 probe of morphant hearts at 48 hpf. (A) Representative images of a control morphant showing correct looping with the atrium placed left and caudal, and the ventricle right and rostral, and of autophagy morphants, showing linearized hearts without looping. (C) Quantification of data shown in (A). More than 30 embryos were analyzed in each group. (B and D) In situ hybridization of morphants with probes that detect cardiac valve markers at 2 dpf. (B) Representative images of vcan, bmp4, and notch1b expression in the hearts of control and autophagy mutants. (D) Quantification of data shown in (B). More than 30 embryos in each group were analyzed. R, right; L, left.
None
Figure 5. Autophagy gene knockdown results in upregulation of transcription factors that are involved in development. (A) Heat map of altered transcripts from the hearts of autophagy morphants at 3 dpf. 109 genes were identified which are informative and predictive of various altered autophagy states. (B) Enrichment analysis of biological processes overrepresented in genes that are differentially expressed and informative of the altered autophagy state. Of interest is the set of transcription factors that are involved in development, including foxn4 (arrow). (C) Real-time PCR measurement of foxn4 mRNA levels in purified hearts of autophagy morphants at 3 dpf. Results represent the mean ± SEM of triplicate samples. *P < 0.05 vs. control morphants; one-tailed t test. (D and E) In situ hybridization to detect tbx5 and tbx2b expression in morphant hearts. (D) Representative images of control and autophagy morphants, with the autophagy morphants showing stronger expression of tbx5 and tbx2b throughout the heart (arrows). (E) Quantification of data shown in (D). More than 18 embryos in each group were analyzed.
None
Figure 6.atg5−/− mice exhibit defective cardiac development. (A) Representative images of atg5−/− and Atg5+/+ mice (at d P0). Top row, photomicrographs of heads and eyes; second row from top, photomicrographs of hearts; third and fourth rows, hematoxylin and eosin sections of hearts. Brackets in third row denote enlarged right atrium; arrow in third row denotes ventricular septal defect. Arrows in the fourth row denote AV valve thickening. (B) Body weights of atg5−/−, Atg5+/− and Atg5+/+ mice. Results represent mean ± SEM ***P < 0.005 for indicated comparison; one-tailed t test. (C) Summary of prevalence of membranous ventricular septal defect in mice of the indicated genotype at d P0. (D) In situ hybridization to detect Tbx2 expression in atg5−/− and Atg5+/+ mice (at d E9.5). Top panels, photomicrographs of Tbx2 expression in the whole embryo; lower panels, photomicrographs of Tbx2 expression in hearts. Brackets in lower panel denote expanded Tbx2 expression in atrioventricular cushion (AVC). Results shown are representative of results from at least 4 embryos per genotype.

Similar articles

Cited by

References

    1. Mizushima N. Autophagy in protein and organelle turnover. Cold Spring Harb Symp Quant Biol. 2011;76:397–402. doi: 10.1101/sqb.2011.76.011023. - DOI - PubMed
    1. Levine B, Kroemer G. Autophagy in the pathogenesis of disease. Cell. 2008;132:27–42. doi: 10.1016/j.cell.2007.12.018. - DOI - PMC - PubMed
    1. Mizushima N, Levine B, Cuervo AM, Klionsky DJ. Autophagy fights disease through cellular self-digestion. Nature. 2008;451:1069–75. doi: 10.1038/nature06639. - DOI - PMC - PubMed
    1. Levine B, Klionsky DJ. Development by self-digestion: molecular mechanisms and biological functions of autophagy. Dev Cell. 2004;6:463–77. doi: 10.1016/S1534-5807(04)00099-1. - DOI - PubMed
    1. Cecconi F, Levine B. The role of autophagy in mammalian development: cell makeover rather than cell death. Dev Cell. 2008;15:344–57. doi: 10.1016/j.devcel.2008.08.012. - DOI - PMC - PubMed

Publication types

MeSH terms

Substances