

Optimization and evaluation of magnetic bead separation combined with matrix-assisted laser desorption/ionization time-of-flight mass spectroscopy (MALDI-TOF MS) for proteins profiling of peritoneal dialysis effluent
- PMID: 24441570
- PMCID: PMC3907861
- DOI: 10.3390/ijms15011162
Optimization and evaluation of magnetic bead separation combined with matrix-assisted laser desorption/ionization time-of-flight mass spectroscopy (MALDI-TOF MS) for proteins profiling of peritoneal dialysis effluent
Abstract
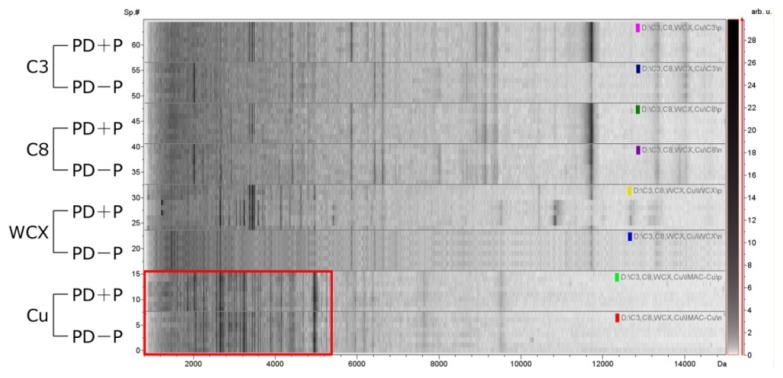
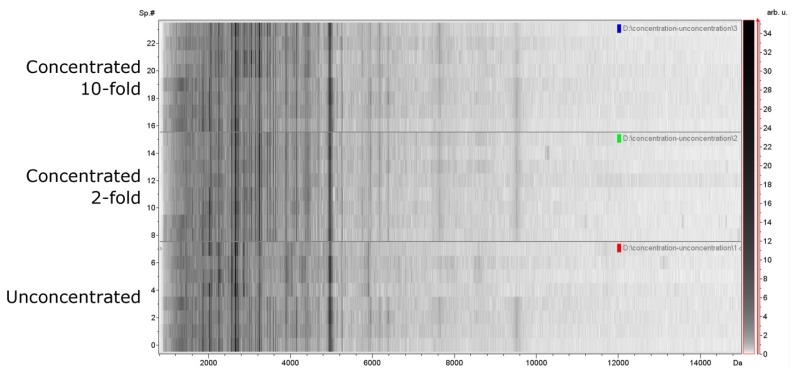
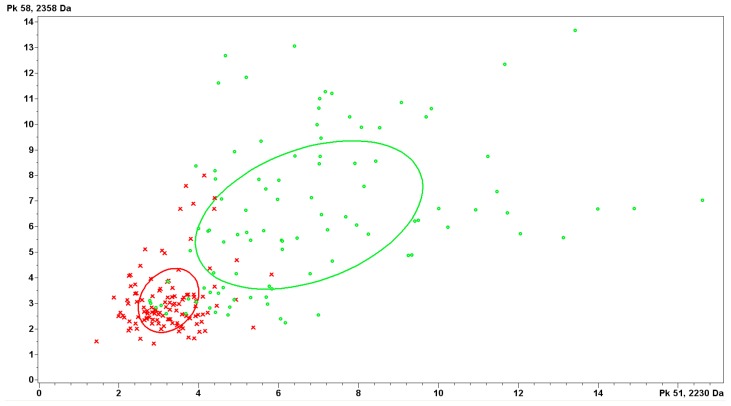
Peritoneal dialysis effluent (PDE) potentially carries an archive of peptides relevant to pathological processes in abdominal and surrounding tissues. Magnetic beads and matrix-assisted laser desorption/ionization time-of-flight mass spectrometry is one such approach that offers a unique tool for profiling of peptides, but this approach has not been used in the PDE analysis. In this study, we developed a strategy for screening PDE proteins <15 kDa and applied this technique to identify potential biomarkers for peritonitis. We examined four kinds of magnetic beads, including a carbon series (C3, C8), weak cation exchange (WCX) and immobilized metal-affinity chromatography (IMAC-Cu) beads. Samples processed with IMAC-Cu magnetic beads consistently showed more MS signals across all beads within the measured mass range. Moreover, there was no difference in the number and morphology of MS signals between concentrated and unconcentrated samples. The PDE peptidome pattern, based on a panel of 15 peaks, accurately recognized peritonitis PD patients from peritonitis-free patients with sensitivity of 90.5% and specificity of 94.7% respectively. Therefore, IMAC-Cu magnetic beads and unconcentrated samples can be used as a fast and cost-effective approach for sample preparation prior to more in-depth discovery of predictive biomarkers of disease in patients on dialysis.
Figures
Similar articles
-
Proteomic Profiling of Invasive Ductal Carcinoma (IDC) using Magnetic Beads-based Serum Fractionation and MALDI-TOF MS.J Clin Lab Anal. 2015 Jul;29(4):321-7. doi: 10.1002/jcla.21773. Epub 2014 Aug 17. J Clin Lab Anal. 2015. PMID: 25130542 Free PMC article.
-
Reproducibility of serum protein profiling by systematic assessment using solid-phase extraction and matrix-assisted laser desorption/ionization mass spectrometry.Rapid Commun Mass Spectrom. 2008;22(3):291-300. doi: 10.1002/rcm.3364. Rapid Commun Mass Spectrom. 2008. PMID: 18181248
-
[Analyzing urinary proteome patterns of metabolic syndrome patients with early renal injury by magnet bead separation and matrix-assisted laser desorption ionization time-of-flight mass spectrometry].Zhongguo Yi Xue Ke Xue Yuan Xue Bao. 2011 Oct;33(5):511-6. Zhongguo Yi Xue Ke Xue Yuan Xue Bao. 2011. PMID: 22338134 Chinese.
-
The MALDI-TOF mass spectrometric view of the plasma proteome and peptidome.Clin Chem. 2006 Jul;52(7):1223-37. doi: 10.1373/clinchem.2006.069252. Epub 2006 Apr 27. Clin Chem. 2006. PMID: 16644871 Review.
-
Current Status of Matrix-Assisted Laser Desorption/Ionization-Time-of-Flight Mass Spectrometry (MALDI-TOF MS) in Clinical Diagnostic Microbiology.Molecules. 2020 Oct 17;25(20):4775. doi: 10.3390/molecules25204775. Molecules. 2020. PMID: 33080897 Free PMC article. Review.
Cited by
-
Association between Venom Immunotherapy and Changes in Serum Protein-Peptide Patterns.Vaccines (Basel). 2021 Mar 12;9(3):249. doi: 10.3390/vaccines9030249. Vaccines (Basel). 2021. PMID: 33809001 Free PMC article.
-
Diagnostic model of saliva peptide finger print analysis of oral squamous cell carcinoma patients using weak cation exchange magnetic beads.Biosci Rep. 2015 May 12;35(3):e00211. doi: 10.1042/BSR20150023. Biosci Rep. 2015. PMID: 26182373 Free PMC article.
-
Proteomic Research in Peritoneal Dialysis.Int J Mol Sci. 2020 Jul 31;21(15):5489. doi: 10.3390/ijms21155489. Int J Mol Sci. 2020. PMID: 32752018 Free PMC article. Review.
-
Proteomic features characterization of Hymenoptera venom allergy.Allergy Asthma Clin Immunol. 2019 Nov 27;15:77. doi: 10.1186/s13223-019-0387-5. eCollection 2019. Allergy Asthma Clin Immunol. 2019. PMID: 31798646 Free PMC article.
References
-
- Blake P.G. Integrated end-stage renal disease care: The role of peritoneal dialysis. Nephrol. Dial. Transplant. 2001;16:61–66. - PubMed
-
- Van Biesen W., Vanholder R., Lameire N. The role of peritoneal dialysis as the first-line renal replacement modality. Perit. Dial. Int. 2000;20:375–383. - PubMed
-
- Nolph K.D., Popovich R.P., Ghods A.J., Twardowski Z. Determinants of low clearances of small solutes during peritoneal dialysis. Kidney Int. 1978;13:117–123. - PubMed
-
- Zemel D., Krediet R.T. Cytokine patterns in the effluent of continuous ambulatory peritoneal dialysis: relationship to peritoneal permeability. Blood Purif. 1996;14:198–216. - PubMed
-
- Szeto C.C., Chow K.M., Wong T.Y., Leung C.B., Wang A.Y., Lui S.F., Li P.K. Feasibility of resuming peritoneal dialysis after severe peritonitis and Tenckhoff catheter removal. J. Am. Soc. Nephrol. 2002;13:1040–1045. - PubMed
Publication types
MeSH terms
Substances
LinkOut - more resources
Full Text Sources
Other Literature Sources
Miscellaneous
