. 2014 Jan 16;15(1):1176-88.
doi: 10.3390/ijms15011176.

Leptin activates RhoA/ROCK pathway to induce cytoskeleton remodeling in nucleus pulposus cells

Affiliations

Leptin activates RhoA/ROCK pathway to induce cytoskeleton remodeling in nucleus pulposus cells

Zheng Li et al. Int J Mol Sci. .

Abstract

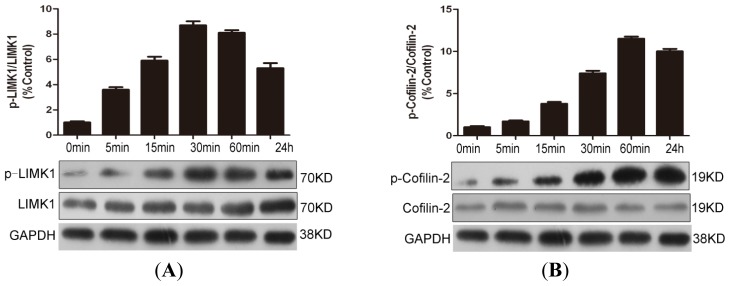
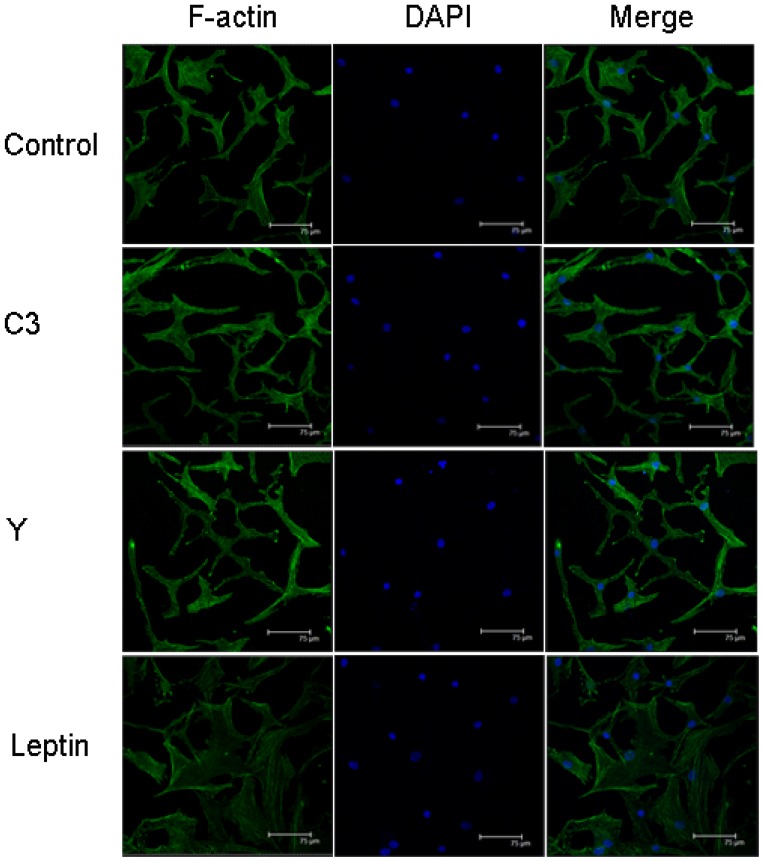
Hyperleptinemia is implicated in obesity-associated lumbar disc degeneration. Nevertheless, the effect of leptin on the intracellular signaling of nucleus pulposus cells is not clear. The current study sought to delineate the possible involvement of the RhoA/ROCK pathway in leptin-mediated cytoskeleton reorganization in nucleus pulposus cells. Nucleus pulposus cells isolated from scoliosis patients were treated with 10 ng/mL of leptin. Fluorescent resonance energy transfer analysis was used to determine the activation of RhoA signaling in nucleus pulposus cells. The protein expression of LIMK1 and cofilin-2 were analyzed by western blot analysis. F-actin cytoskeletal reorganization was assessed by rhodamine-conjugated phalloidin immunoprecipitation. Leptin induced F-actin reorganization and stress fiber formation in nucleus pulposus cells, accompanied by localized RhoA activation and phosphorylation of LIMK1 and cofilin. The RhoA inhibitor C3 exoenzyme or the ROCK inhibitor Y-27632 potently attenuated the effects of leptin on F-actin reorganization and stress fiber formation. Both inhibitors also prevented leptin-induced phosphorylation of LIMK1 and cofilin-2. Our study demonstrated that leptin activated the RhoA/ROCK/LIMK/cofilin-2 cascade to induce cytoskeleton reorganization in nucleus pulposus cells. These findings may provide novel insights into the pathogenic mechanism of obesity-associated lumbar disc degeneration.


Figures

Figure 1.
Figure 1.
Leptin activated RhoA in human NP cells. (A) Human NP cells expressing pRaichu-1237 were imaged as in this figure. The corrected FRET images were pseudo-colored to visualize the localization of active RhoA and FRET intensity. In the color scale, red represents a high FRET signal and blue represents a low signal; (B) The YFP/CFP emission ratio was measured by taking the mean intensity of a ROI of the corrected FRET image, divided by the mean intensity of the same region on the CFP image. An average of one cell was quantified for each time point and each image is representative of multiple cells. For each experiment, human NP cells expressing pRaichu 1237× were imaged from 18 h post-transfection. * p < 0.05; ** p < 0.01, values obtained in the presence of leptin (10 ng/mL) versus control (0 min). Scale bars represent 10 μm. Error bars represent SEM.
Figure 1.
Figure 1.
Leptin activated RhoA in human NP cells. (A) Human NP cells expressing pRaichu-1237 were imaged as in this figure. The corrected FRET images were pseudo-colored to visualize the localization of active RhoA and FRET intensity. In the color scale, red represents a high FRET signal and blue represents a low signal; (B) The YFP/CFP emission ratio was measured by taking the mean intensity of a ROI of the corrected FRET image, divided by the mean intensity of the same region on the CFP image. An average of one cell was quantified for each time point and each image is representative of multiple cells. For each experiment, human NP cells expressing pRaichu 1237× were imaged from 18 h post-transfection. * p < 0.05; ** p < 0.01, values obtained in the presence of leptin (10 ng/mL) versus control (0 min). Scale bars represent 10 μm. Error bars represent SEM.
Figure 2.
Figure 2.
Leptin phosphorylated LIMK1 and confilin-2 in NP cells. After 1-day serum deprivation, leptin (10 ng/mL) was added into the serum-free medium of NP cells for 5 min, 15 min, 30 min, 60 min and 24 h, and then the protein amounts of phosphorylated forms of LIMK1 (p-LIMK1) (A) and confilin-2 (p-confilin-2) (B) were detected with Western blotting analysis. GAPDH was also detected as a loading control. The signal in each lane was quantified using ImageJ software (v. 2.1.4.7; National Institutes of Health, Boston, MA, USA) and the ratios of p-LIMK1/LIMK1 and p-confilin-2/confilin-2 to GAPDH were determined.
Figure 3.
Figure 3.
Fluorescence microscopy images showing arrangement of rhodamine-phalloidin-stained (green) F-actin filaments in primary human NP cells treated without or with leptin (10 ng/mL). Nuclei were stained with DAPI, shown in blue. Images were acquired using laser scanning confocal microscopy under a 10× and 40× objectives. Control NP cells exhibited diffuse cytoplasmic and perinuclear staining of F-actin while leptin-stimulated NP cells showed strong cytoplasmic filamentous structures. Scale bars represent 75 or 37.5 μm.
Figure 4.
Figure 4.
Pharmacological inhibitors of Rho and ROCK prevented phosphorylation of LIMK1 and confilin-2 induced by leptin. NP cells were serum-starved for 24 h, and then pre-treated with C3 (C3 exoenzyme) or Y (Y-276320) for 30 min. The cells were then treated with vehicle (−) or 10 ng/mL leptin (+) in serum-free media for another 30 min. the protein amounts of phosphorylated forms of LIMK1 (p-LIMK1) (A) and confilin-2 (p-confilin-2) (B) were detected with Western blotting analysis. GAPDH was also detected as a loading control. The signal in each lane was quantified using ImageJ software (v. 2.1.4.7; National Institutes of Health, Boston, MA, USA) and the ratios of p-LIMK1/LIMK1 and p-confilin-2/confilin-2 to GAPDH were determined.
Figure 5.
Figure 5.
Pharmacological inhibitors of Rho and ROCK prevented F-actin remodeling in human NP cells treated with leptin. NP cells were treated with vehicle (control), specific C3 exoenzyme (C3), or Y-276320 (Y) and incubated in the presence or absence of leptin (10 ng/mL). Fluorescence microscopy images showing both C3 exoenzyme and Y-27632 inhibited leptin-induced actin cytoskeletal reorganization and actin stress fiber formation. Scale bars represent 75 μm.

References

    1. Haslam D.W., James W.P. Obesity. Lancet. 2005;366:1197–1209. - PubMed
    1. Guh D.P., Zhang W., Bansback N., Amarsi Z., Birmingham C.L., Anis A.H. The incidence of co-morbidities related to obesity and overweight: A systematic review and meta-analysis. BMC Public Health. 2009;9:88. - PMC - PubMed
    1. Samartzis D., Karppinen J., Mok F., Fong D.Y., Luk K.D., Cheung K.M. A population-based study of juvenile disc degeneration and its association with overweight and obesity, low back pain, and diminished functional status. J. Bone Joint Surg. Am. 2011;93:662–670. - PubMed
    1. Bostman O.M. Prevalence of obesity among patients admitted for elective orthopaedic surgery. Int. J. Obes. Relat. Metab. Disord. 1994;18:709–713. - PubMed
    1. L’Allemand D., Schmidt S., Rousson V., Brabant G., Gasser T., Gruters A. Associations between body mass, leptin, IGF-I and circulating adrenal androgens in children with obesity and premature adrenarche. Eur. J. Endocrinol. 2002;146:537–543. - PubMed

Publication types

LinkOut - more resources