. 2014 Feb;17(2):248-53.
doi: 10.1038/nn.3625. Epub 2014 Jan 19.

Medial prefrontal D1 dopamine neurons control food intake

Affiliations

Medial prefrontal D1 dopamine neurons control food intake

Benjamin B Land et al. Nat Neurosci. 2014 Feb.

Abstract

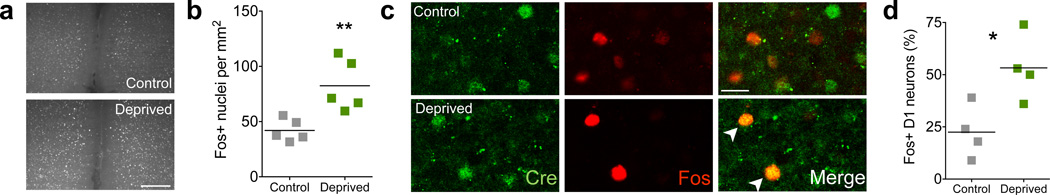
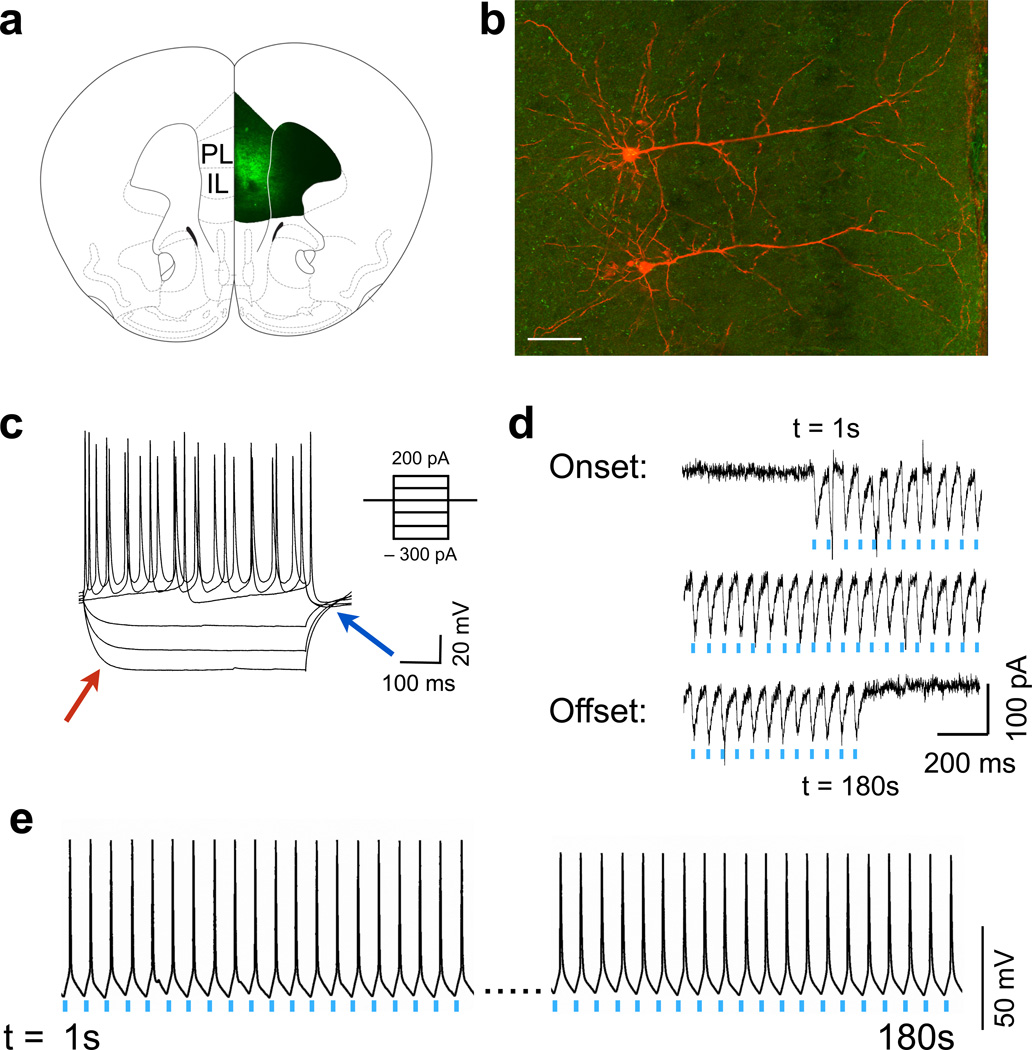
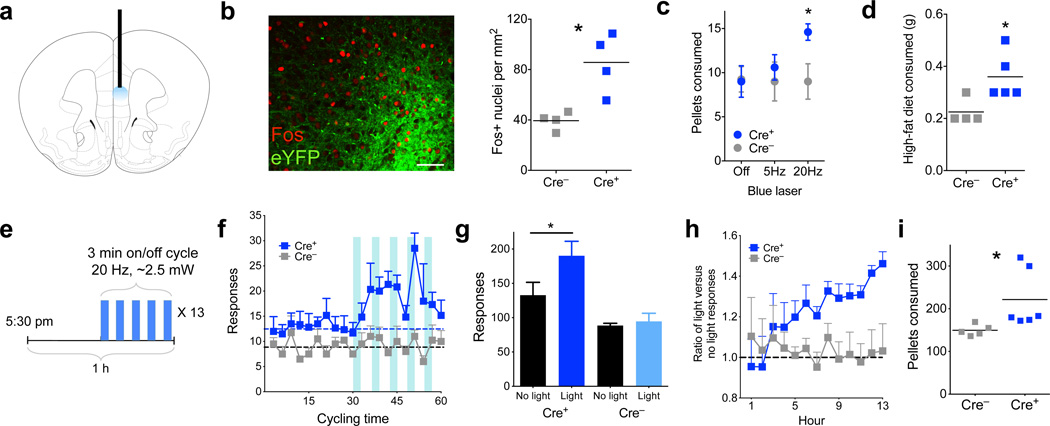
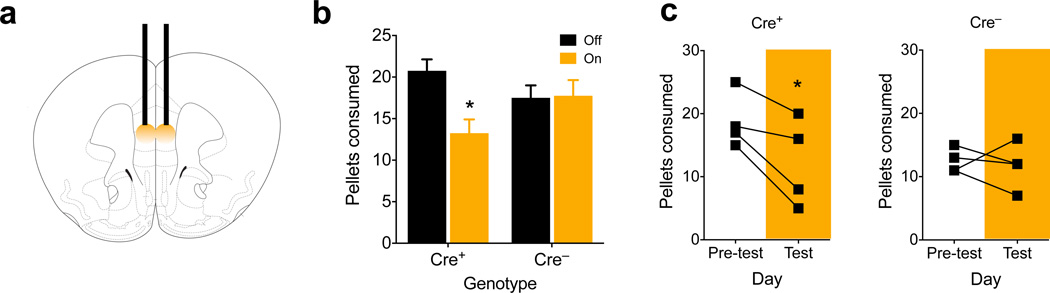
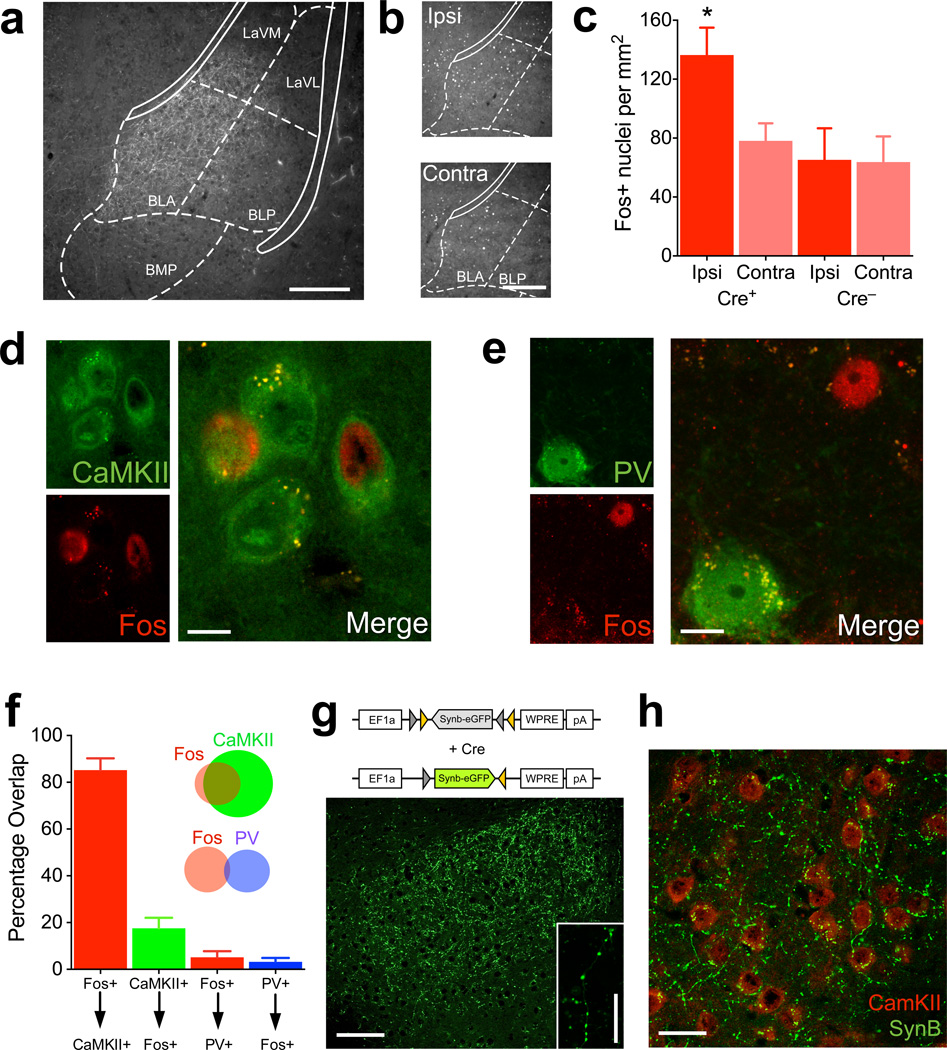
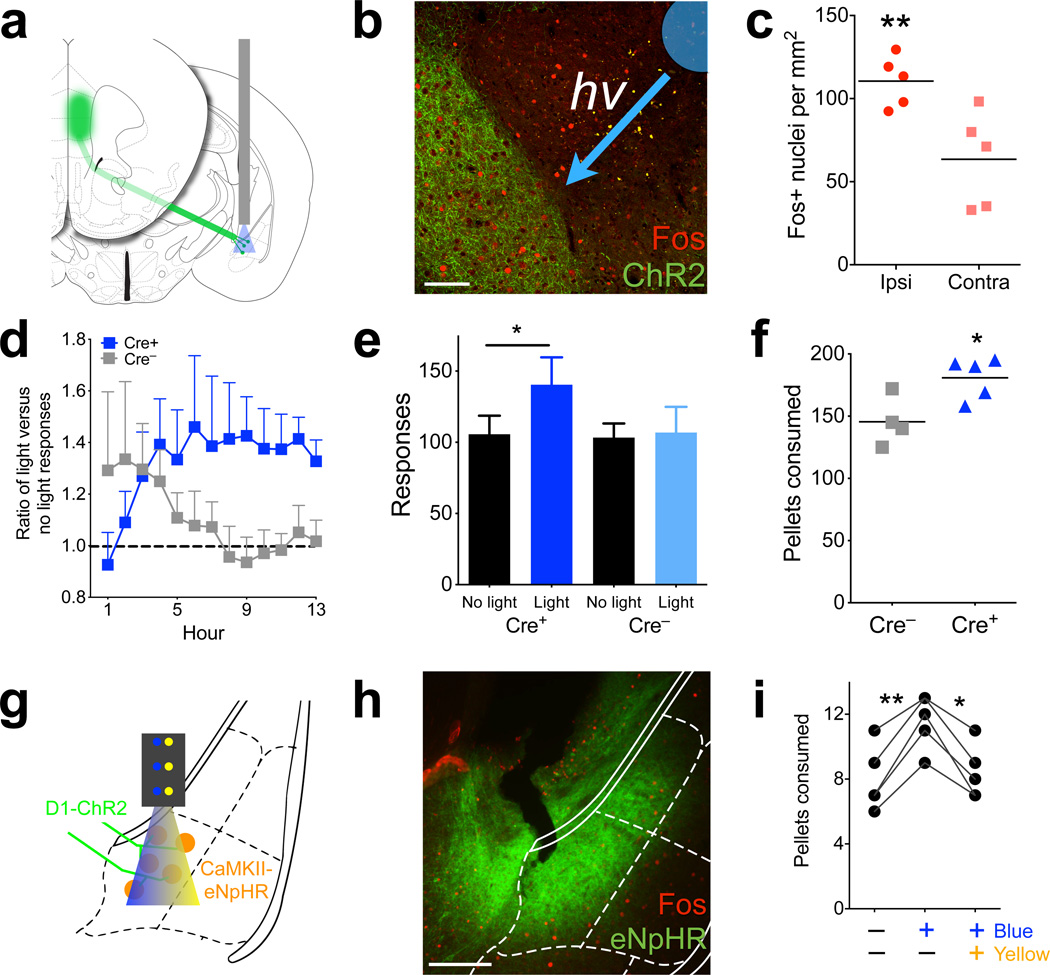
Although the prefrontal cortex influences motivated behavior, its role in food intake remains unclear. Here, we demonstrate a role for D1-type dopamine receptor-expressing neurons in the medial prefrontal cortex (mPFC) in the regulation of feeding. Food intake increases activity in D1 neurons of the mPFC in mice, and optogenetic photostimulation of D1 neurons increases feeding. Conversely, inhibition of D1 neurons decreases intake. Stimulation-based mapping of prefrontal D1 neuron projections implicates the medial basolateral amygdala (mBLA) as a downstream target of these afferents. mBLA neurons activated by prefrontal D1 stimulation are CaMKII positive and closely juxtaposed to prefrontal D1 axon terminals. Finally, photostimulating these axons in the mBLA is sufficient to increase feeding, recapitulating the effects of mPFC D1 stimulation. These data describe a new circuit for top-down control of food intake.


Figures

Figure 1
Figure 1
Characterization of prefrontal neurons activated during feeding. (a) Representative micrographs showing prefrontal Fos nuclei in control and deprived Drd1a-cre+ mice after 90 m access to food (scale bar = 200 µm). (b) Quantification of Fos positive nuclei in the prefrontal cortex of control and deprived/re-fed animals (n = 5,5 animals, t8 = 3.6, P = 0.007, 2-tailed t-test; control = 51.6± 5.1; deprived = 101.4± 12.3, mean ± s.e.m.). (c) Representative single channel and overlay confocal micrographs of Cre (green) and Fos (red) for control and deprived mice. Note examples of overlap (white arrowheads) in the deprived condition (scale bar = 20 µm). (d) Quantification of the percentage of Drd1a-cre+ nuclei that were also Fos positive (n = 4,4 animals, t6 = 3.1, P = 0.022, 2-tailed t-test; control = 22.5± 6.5; deprived = 53.3± 7.8, mean ± s.e.m.). * P < 0.05, ** P < 0.01.
Figure 2
Figure 2
Physiological responses to prefrontal D1 photoactivation. (a) ChR2 expression in prefrontal D1 neurons after viral injection in Drd1a-cre+ mice. Strong staining is seen in layer 2/3 and layer 5 of both the prelimbic (PL) and infralimbic (IL) prefrontal cortex. (b) Representative micrograph of two D1 positive layer 5 pyramidal neurons filled with biotin (red; background eYFP in green, scale bar = 60 µm). (c) Physiological properties of a D1 neuron in response to depolarizing and hyperpolarizing currents. Note a lack of voltage sag (red arrow) or rebound depolarization (blue). (d) Inward currents induced by 20 Hz blue light demonstrates high fidelity over the course of 3 m. (e) Representative voltage trace showing high fidelity action potentials in response to 20 Hz blue light over the course of 3 m.
Figure 3
Figure 3
Prefrontal D1 photostimulation leads to increased food intake. (a) Schematic showing placement of optical fiber within medial prefrontal cortex. (b) Left, confocal micrograph showing dense eYFP expression in layer 5 (green), along with Fos (red, scale bar = 60 µm). Right, quantification of Fos+ nuclei in the mPFC of Drd1a-cre+ and Drd1a-cre animals after photostimulation (n = 4,4 animals, t6 = 3.8, P = 0.01, 2-tailed t-test; Cre– = 30.5± 2.7; Cre+ = 66.25± 9.1, mean ± s.e.m.). (c) Number of grain pellets consumed in 1 h with no photostimulation, 5 Hz, or 20 Hz stimulation (n = 4,5 animals, 20 Hz t7 = 2.7, P = 0.029, 2-tailed t-test; 5 Hz t7 = 0.6, P = 0.55, 2-tailed t-test). (d) Amount, in grams, of high-fat (45%) chow consumed in 1 h with 20Hz photostimulation (n = 4,5 animals, t7 = 2.7, P = 0.032, 2-tailed t-test; Cre– = 0.23± 0.03; Cre+ = 0.36± 0.04, mean ± s.e.m.). (e) Schematic describing the overnight feeding paradigm. Thirteen 1 h cycles are divided into ‘no light’ and ‘light’ epochs. (f) Histogram of responding in Drd1a-cre+ and Drd1a-cre animals over the thirteen 1 h cycles, summated and overlayed onto 1 hour. Dashed lines represent average responses during ‘no light’ epoch (n = 6,4 animals F(1,8) = 7.6, P = 0.025, 2-way ANOVA, main effect of genotype). (g) Total number of responses in ‘light’ and ‘no light’ epochs over the 13 h test in Drd1a-cre+ and Drd1a-cre animals (n = 6,4, t5 = 9.2, P = 0.0003, 2-tailed, paired t-test, overall interaction of genotype × light, F(1,8) = 14.2, P = 0.006, 2-way ANOVA. (h) Response ratio over 13 hours of cumulative ‘light’ divided by ‘no light’ responses. Values over 1.0 (dashed line) represent more responding during the ‘light’ epoch (n = 6,5 animals, F(12,108) = 1.9, P = 0.04, 2-way ANOVA, interaction of hour × genotype). (i) Total number of grain pellets consumed overnight in Drd1a-cre+ and Drd1a-cre animals (n = 6,5 animals, t9 = 2.3, P = 0.049, 2-tailed t-test; Cre– = 149.6± 5.8; Cre+ = 221.5± 28.2, mean ± s.e.m.). Graphs represent mean ± s.e.m. * P < 0.05.
Figure 4
Figure 4
Photoinhibition of prefrontal D1 neurons reduces food intake. (a) Schematic showing placement of bilateral optical fibers within the mPFC. (b) Number of pellets consumed in 1 h during light on and light off periods for food restricted Drd1a-cre+ and Drd1a-cre animals (n = 4,4 animals, t3 = 3.3, P = 0.045, 2-tailed, paired t-test; overall interaction of light × genotype, F(1,12) = 5.8, P = 0.034, 2-way ANOVA. (c) Number of pellets consumed on the pre-test and test (photoinhibition) days for ad-lib fed Drd1a-cre+ and Drd1a-cre animals (n = 4,4 animals, Cre+ t3 = 3.5, P = 0.039, 2-tailed, paired t-test; Cre– t3 = 0.4, P = 0.73, 2-tailed, paired t-test; Cre+ pre-test = 18.8± 2.2, test = 12.3± 3.5; Cre– pre-test = 12.5± 1.0, test = 11.8± 1.8, mean ± s.e.m.). Graphs represent mean ± s.e.m. * P < 0.05.
Figure 5
Figure 5
Prefrontal D1 neurons project to and activate the medial basolateral amygdala. (a) Representative micrograph of eYFP/ChR2-positive axons of D1 PFC neurons in the BLA. Overlay from corresponding coronal slice in mouse brain atlas (scale bar = 250µm). (b) Fos immunofluorescence on the ipsilateral (ipsi) and contralateral (contra) BLA of a Drd1a-cre+ animal 90 min after photostimulation (scale bar = 250µm). (c) Quantification of Fos immunofluorescence on the ipsilateral and contralateral BLA of Drd1a-cre+ and Drd1a-cre animals 90 min after photostimulation (n = 6,4 animals, interaction between genotype × side, F(1,8) = 17.1, P = 0.003, 2-way ANOVA). (d) Representative single channel and overlay micrographs demonstrating co-staining of Fos and CaMKII, a marker for glutamatergic neurons (scale bar = 10µm). (e) Representative single channel and overlay micrographs showing lack of overlap between Fos and parvalbumin (PV, scale bar = 10µm). (f) Quantification of overlap between Fos and CaMKII and PV. X-axis refers to the percentage of above-arrow positive neurons that are also below-arrow positive. Inset: Venn diagram visually depicting the amount of overlap between the two neuronal types with Fos (not to scale; n = 3). (g) Above, AAV construct for flox-eGFP-synaptobrevin fusion. Below, Micrograph showing eGFP labeled, pre-synaptic terminals in the BLA following PFC viral infusion into Drd1a-cre+ mice (scale bar = 100µm). Inset: High-magnification showing synaptic boutons (scale bar = 18µm). (h) Micrograph of D1 PFC neuron terminals (green) with CaMKII immunodetection (red), demonstrating close apposition between the two (scale bar = 30µm). Graphs represent mean ± s.e.m. * P < 0.05. BLA- Basolateral amygdala-anterior, BLP- Basolateral amygdala-posterior, BMP- Basomedial amygdala, LaVL- Lateral amygdala-ventrolateral, LaVM-Lateral amygdala, ventromedial.
Figure 6
Figure 6
Photostimulation of prefrontal D1 terminals in the mBLA increases intake. (a) Schematic representing the terminal targeting and photostimulation. (b) Micrograph depicting Fos in the D1-prefrontal terminal region of the mBLA in a Drd1a-cre+ animal. Overlay depicts cannula tip and direction of incoming blue light (scale bar = 100µm). (c) Quantification of Fos in Drd1a-cre+, mBLA targeted photostimulation, showing that light increases Fos (n = 5 animals, t4 = 4.9, P = 0.008, 2-tailed, paired t-test; Ipsi = 20.6± 3.2; Contra = 11.8± 3.5, mean ± s.e.m.). (d) Response ratio of ‘light’ divided by ‘no light’ cumulative responses in Drd1a-cre+ and Drd1a-cre mice. Values over 1.0 (dashed line) represent more responding during the ‘light’ epoch (n = 5,4 animals, overall interaction of genotype × time, F(1,12) = 2.5, P = 0.007, 2-way ANOVA). (e) Total number of responses over the 13 hour test in Drd1a-cre+ and Drd1a-cre animals (n = 5,4 animals, t7 = 3.9, P = 0.018, 2-tailed, paired t-test; overall interaction of genotype × light, F(1,7) = 5.7, P = 0.048, 2-way ANOVA). (f) Total number of grain pellets consumed in Drd1a-cre+ and Drd1a-cre animals (n = 5,4 animals, t7 = 2.8, P = 0.021, 2-tailed t-test; Cre– = 152.0± 7.0; Cre+ = 180.8± 7.3, mean ± s.e.m.). (g) Schematic depicting incoming ChR2 axons from D1 neurons of the PFC, expression of CaMKII-promoted eNpHR in mBLA neurons, and fiberoptic cannula delivering both blue and yellow light to the region. (h) Representative micrograph showing eNpHR in the mBLA and CeA. (i) Number of pellets consumed in 1 h by Drd1a-cre+ animals with prefrontal ChR2 and mBLA eNpHR, during no stimulation, blue light only, and blue and yellow light simultaneously (n = 5 animals, F(2,8) = 35.1, P = 0.002, One-way ANOVA, Bonferroni post-hoc). Graphs represent mean ± s.e.m. * P < 0.05, ** P < 0.01.

References

    1. Rangel A, Camerer C, Montague PR. A framework for studying the neurobiology of value-based decision making. Nat. Rev. Neurosci. 2008;9:545–556. - PMC - PubMed
    1. Miller EK, Cohen JD. An integrative theory of prefrontal cortex function. Annu. Rev. Neurosci. 2001;24:176–202. - PubMed
    1. Ikeda M, Brown J, Holland AJ, Fukuhara R, Hodges JR. Changes in appetite, food preference, and eating habits in frontotemporal dementia and Alzheimer's disease. J. Neurol. Neurosurg. Psychiatr. 2002;73:371–376. - PMC - PubMed
    1. Ochner CN, Green D, van Steenburgh JJ, Kounios J, Lowe MR. Asymmetric prefrontal cortex activation in relation to markers of overeating in obese humans. Appetite. 2009;53:44–49. - PMC - PubMed
    1. de Araujo IE, Rolls E, Kringelbach M, Mcglone F, Phillips N. Taste-olfactory convergence, and the representation of the pleasantness of flavour, in the human brain. Eur. J. Neurosci. 2003;18:2059–2068. - PubMed

Publication types

MeSH terms

Substances