. 2014 Feb;20(2):175-83.
doi: 10.1038/nm.3450. Epub 2014 Jan 19.

Mfge8 promotes obesity by mediating the uptake of dietary fats and serum fatty acids

Affiliations

Mfge8 promotes obesity by mediating the uptake of dietary fats and serum fatty acids

Amin Khalifeh-Soltani et al. Nat Med. 2014 Feb.

Abstract

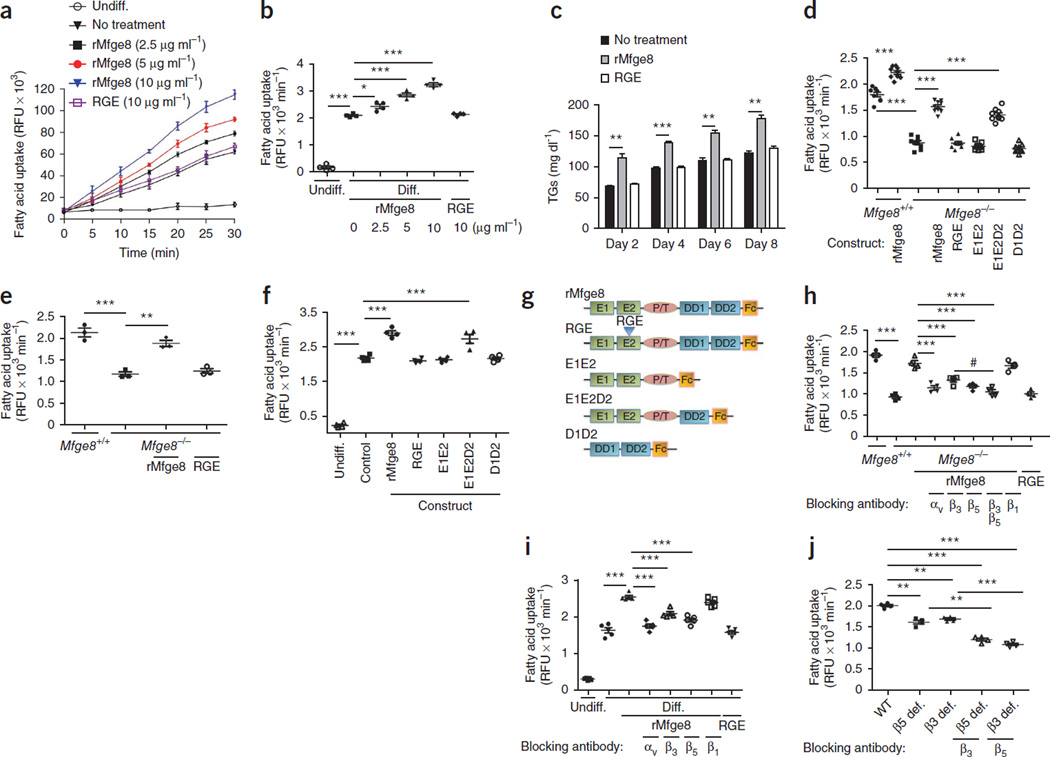
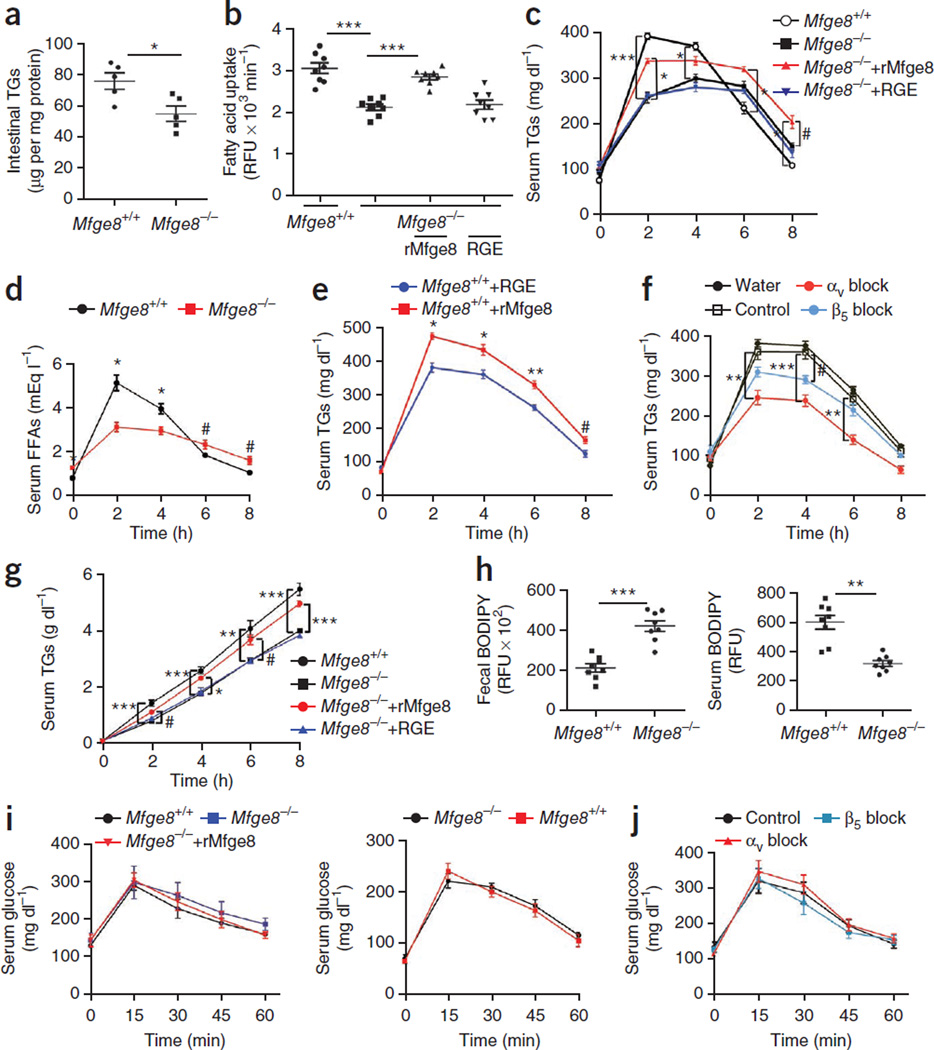
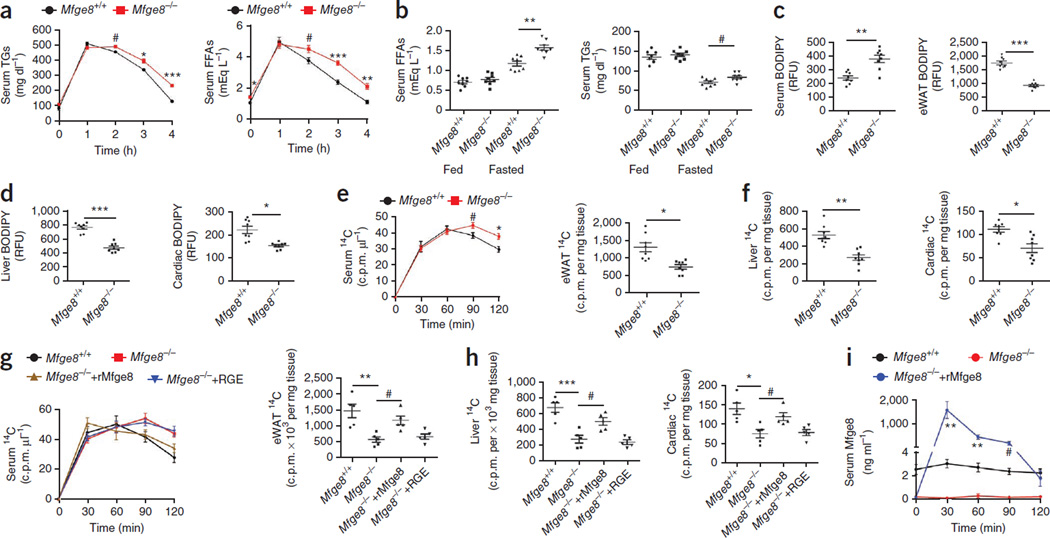
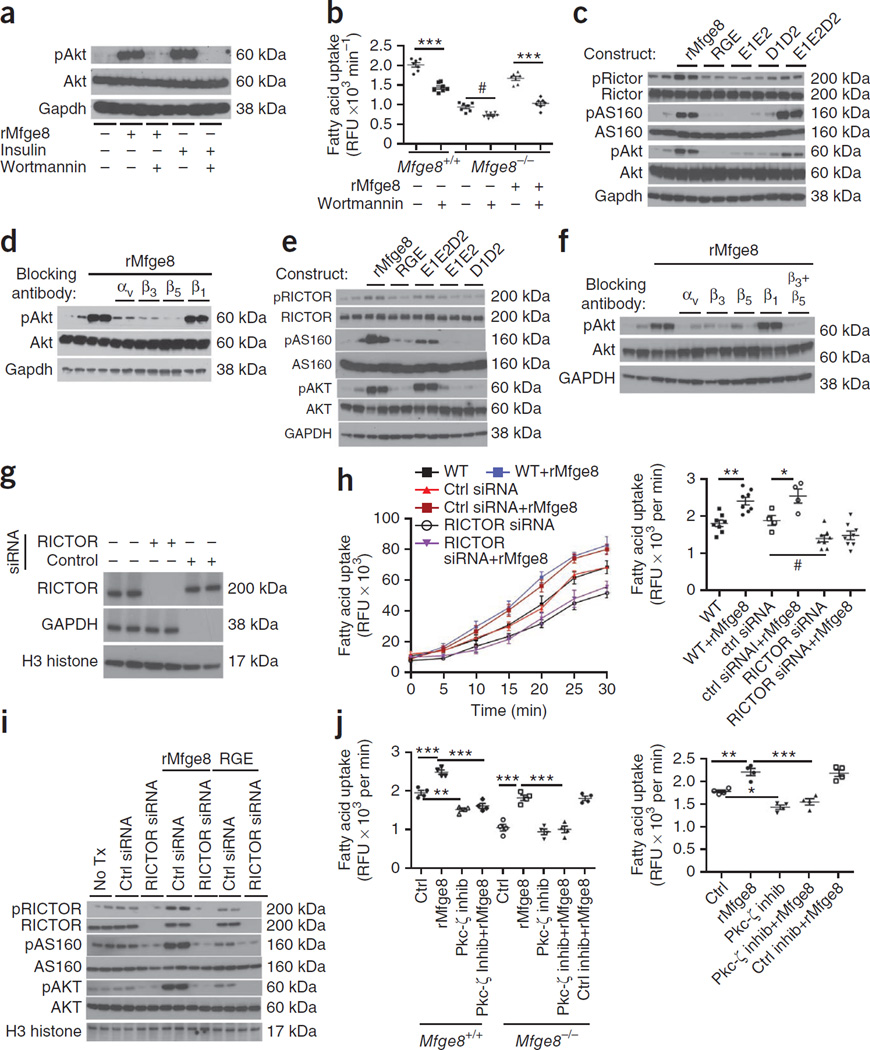
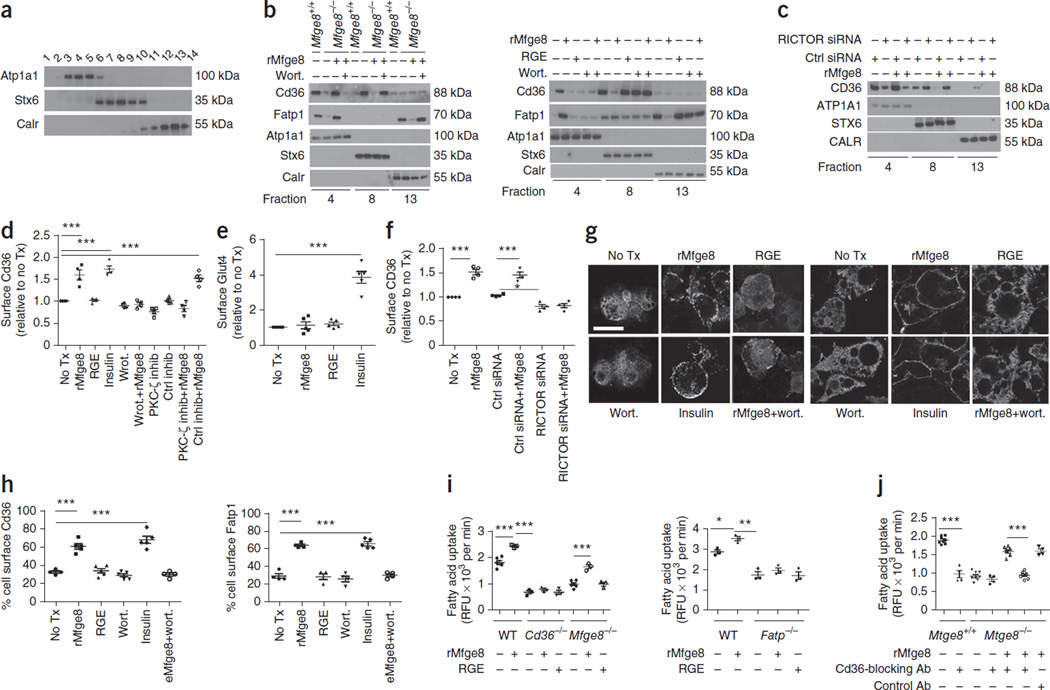
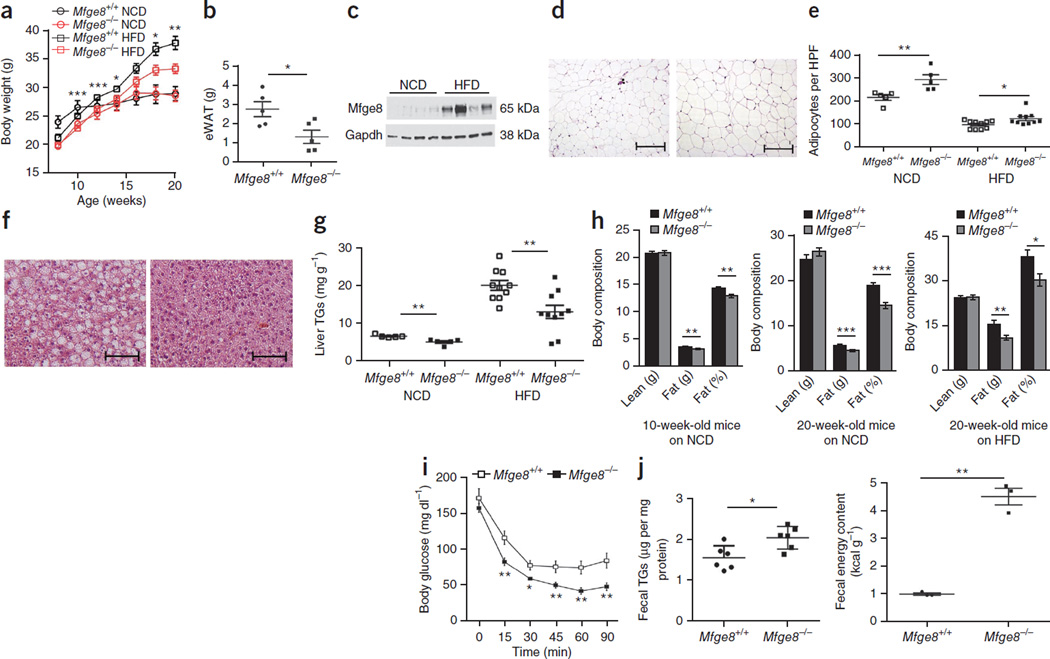
Fatty acids are integral mediators of energy storage, membrane formation and cell signaling. The pathways that orchestrate uptake of fatty acids remain incompletely understood. Expression of the integrin ligand Mfge8 is increased in human obesity and in mice on a high-fat diet, but its role in obesity is unknown. We show here that Mfge8 promotes the absorption of dietary triglycerides and the cellular uptake of fatty acid and that Mfge8-deficient (Mfge8(-/-)) mice are protected from diet-induced obesity, steatohepatitis and insulin resistance. Mechanistically, we found that Mfge8 coordinates fatty acid uptake through αvβ3 integrin- and αvβ5 integrin-dependent phosphorylation of Akt by phosphatidylinositide-3 kinase and mTOR complex 2, leading to translocation of Cd36 and Fatp1 from cytoplasmic vesicles to the cell surface. Collectively, our results imply a role for Mfge8 in regulating the absorption and storage of dietary fats, as well as in the development of obesity and its complications.


Figures

Figure 1
Figure 1
Mfge8 mediates fatty acid uptake. (a,b) Time course (a) and rate (b) of fatty acid uptake in undifferentiated (Undiff.) 3T3-L1 fibroblasts and differentiated (Diff.) 3T3-L1 adipocytes treated with rMfge8 or RGE construct. n = 4. (c) 3T3-L1 adipocyte TG content over time after treatment with rMfge8 or RGE construct (10 µg ml−1). n = 3. (d–f) Fatty acid uptake in Mfge8−/− and Mfge8+/+ primary adipocytes (d, n = 9), differentiated primary Mfge8−/− and Mfge8+/+ adipocyte progenitor cells (e, n = 3) and 3T3-L1 adipocytes (f, n = 4) with and without treatment with mutated Mfge8 constructs (g). Human Fc–tagged Mfge8 constructs: full-length protein (rMfge8), protein with a mutation in the RGD integrin binding sequence that inhibits binding (RGE), protein lacking both discoidin domains (E1E2), protein with only the second discoidin domains (E1E2D2) and protein lacking both EGF-like domains (D1D2). (h,i) Effect of integrin-blocking antibodies on fatty acid uptake in Mfge8−/− adipocytes (h, n = 3 or 4) and in 3T3-L1 adipocytes (i, n = 5) treated with rMfge8. (j) Fatty acid uptake in β5-deficient (β5 def.) and β3-deficient (β3 def.) primary adipocytes with and without the addition of integrin-blocking antibodies. n = 4. Male mice were used for all experiments. *P < 0.01, **P < 0.001, ***P < 0.0001. Data are expressed as mean ± s.e.m. Each replicate represents an independent experiment. One-way analysis of variance (ANOVA) with post hoc Bonferroni t-test was used for all statistical analyses except c, where a Student’s t-test was used. RFU, relative fluorescence unit.
Figure 2
Figure 2
Mfge8 mediates absorption of dietary fats. (a) TG content of small intestinal tissue from Mfge8+/+ and Mfge8−/− mice. n = 5. (b) Fatty acid uptake in primary Mfge8+/+ and Mfge8−/− enterocytes and Mfge8−/− enterocytes treated with rMfge8. n = 8. Each replicate represents an independent experiment. (c) Serum TG after oral gavage of Mfge8+/+ and Mfge8−/− mice with olive oil or olive oil mixed with rMfge8. n = 6 (rMfge8 treated), 7 (RGE treated) and 8 (Mfge8+/+ and Mfge8−/−). Results represent 2 independent experiments. (d) Serum FFA concentrations in Mfge8+/+ and Mfge8−/− mice after olive oil gavage. n = 5. (e) Effect of rMfge8 on serum TG concentrations after olive oil gavage in Mfge8+/+ mice. n = 5. (f) Effect of oral integrin-blocking antibodies before olive oil gavage on serum TG concentrations. n = 4 for all except β5 block, where n = 5. (g) Serum TG concentrations after olive oil gavage and i.p. administration of Triton WR-1339. n = 8. (h) Fecal and serum BODIPY concentrations in Mfge8+/+ and Mfge8−/− mice after gavage with a mixture of BODIPY fatty acid analog and a nonabsorbable rhodamine-PEG. n = 8. Results represent 3 independent experiments. (i) Serum glucose concentrations after a 4-h (left) and 18-h (right) fast in Mfge8+/+ and Mfge8−/− mice gavaged with a glucose bolus and in Mfge8−/− mice gavaged with glucose mixed with rMfge8. n = 5. (j) Effect of integrin-blocking or control antibodies on glucose absorption by Mfge8+/+ mice after glucose gavage. Male mice were used in a, b, d and e, and female mice were used for all remaining panels. In vivo experiments were performed once in e, f, i, and j, 2 independent times in c, d and g and 3 independent times in h. #P < 0.05, *P < 0.01, **P < 0.001, ***P < 0.0001. Data are expressed as mean ± s.e.m. One-way ANOVA with post hoc Bonferroni t-test was used for all statistical analyses except a and h, where a Student’s t-test was used.
Figure 3
Figure 3
Mfge8 mediates fatty acid clearance from serum and deposition in peripheral organs. (a) Serum TG and FFA concentrations after i.p. injection of olive oil. n = 8. Data represent 2 independent experiments. (b) Serum FFA and TG concentrations in fed mice and mice fasted for 24 h. n = 8. Data represent 3 independent experiments. (c,d) Quantification of serum, eWAT (c), liver and cardiac (d) BODIPY concentrations 3 h after i.p. injection. n = 8. Data represent 3 independent experiments. (e,f) Quantification of serum and eWAT (e) and liver and cardiac (f) 14C radioactivity after i.p. injection of [14C]oleic acid. Tissue concentrations were measured 2 h after injection. n = 8. Data represent 2 independent experiments. (g,h) Quantification of serum, eWAT (g), liver and cardiac (h) 14C radioactivity after i.p. injection of [14C]oleic acid and i.p. rMfge8. n = 5. Data represent 1 experiment. (i) Serum Mfge8 after i.p. rMfge8 in Mfge8−/− mice. n = 5. Data represent 1 experiment. Female mice were used for all experiments except for those in i. #P < 0.05, *P < 0.01, **P < 0.001, ***P < 0.0001. Data are expressed as mean ± s.e.m. A Student’s t-test was used for all statistical analyses except for that in g and h, where an one-way ANOVA with post hoc Bonferroni t-test was used.
Figure 4
Figure 4
Mfge8 increases fatty acid uptake through PI3K. (a) Effect of rMfge8 (10 µg ml−1) or insulin (1 µM) with and without wortmannin (100 nM) on phosphorylation of Akt (pAkt). Gapdh, glyceraldehyde 3-phosphate dehydrogenase (loading control). (b) Effect of wortmannin on fatty acid uptake in primary Mfge8+/+ and Mfge8−/− adipocytes and on Mfge8−/− adipocytes treated with rMfge8. n = 7. (c) Effect of mutated Mfge8 constructs on Akt, Rictor and As160 phosphorylation in 3T3-L1 adipocytes. (d) Effect of integrin-blocking antibodies on Akt phosphorylation in 3T3-L1 adipocytes treated with rMfge8. (e) The effect of mutated Mfge8 constructs on phosphorylation of AKT, RICTOR and AS160 in HepG2 cells. (f) The effect of rMfge8 on AKT phosphorylation in the presence of integrin-blocking antibodies in HepG2 cells. αv, β3, β5, β1, and β3 + β5 blocking antibodies. (g) Western blot showing efficiency of RICTOR-targeting siRNA and control siRNA (GAPDH) in HepG2 cells. (h) Time course (left) and rate (right) of fatty acid uptake in HepG2 cells treated with siRNA targeting RICTOR with or without rMfge8. n = 8 for WT and RICTOR siRNA–treated cells and n = 4 for control siRNA–treated HepG2 cells. Ctrl, control. (i) Western blot for pAKT and pAS160 in HepG2 cells treated with RICTOR siRNA and rMfge8. Tx, treatment. (j) Effect of Pkc-ζ or control inhibitor (inhib) on fatty acid uptake in primary Mfge8+/+ and Mfge8−/− adipocytes from female mice (left) and HepG2 cells (right). n = 4. #P < 0.05, *P < 0.01, **P < 0.001, ***P < 0.0001. Data are expressed as mean ± s.e.m. Each replicate represents an independent experiment. One-way ANOVA with post hoc Bonferroni t-test was used for all statistical analyses. For western blots, n = 2 for each condition, and each blot is representative of 3 independent experiments.
Figure 5
Figure 5
Mfge8 induces cell surface translocation of Cd36 and Fatp1. (a) Western blot of membrane fractions probed for expression of Atp1a1, Stx6 and Calr after cell fractionation. (b,c) Membrane fractions probed for Cd36 and Fatp1 in primary Mfge8−/− and Mfge8+/+ adipocytes and Mfge8−/− adipocytes (left) and 3T3-L1 adipocytes (right) treated with rMfge8 with or without wortmannin (Wort.) (b) and in HepG2 cells treated with siRNA targeting RICTOR or control siRNA and rMfge8 (c). Each western blot represents 3 independent experiments. (d) Cell surface Cd36 expression in 3T3-L1 adipocytes in response to rMfge8. n = 4. (e) Glut4 translocation in 3T3-L1 adipocytes in response to rMfge8. n = 5. (f) CD36 translocation assay in HepG2 cells treated with siRNA targeting RICTOR or control siRNA and rMfge8. n = 4. (g,h) Confocal images showing cell surface expression (g) of Cd36 (left) and Fatp1 (right) and quantification (h) of Cd36 and Fatp1 expression after treatment with rMfge8 with or without wortmannin. Scale bar, 50 µm. (Left, no treatment and wortmannin n = 4, and rMfge8, RGE, and insulin n = 5. Right, n = 4 except insulin n = 5). (i) Effect of rMfge8 on fatty acid uptake in WT and Cd36−/− adipocytes (left, n = 3 except Mfge8−/− and WT, where n = 5) and Fatp1−/− primary adipocytes (right, n = 3). (j) Effect of Cd36-blocking or control antibody on fatty acid uptake in primary Mfge8−/− and Mfge8+/+ adipocytes treated with rMfge8. n = 4 for experiments with antibodies and 8 for experiments with and without rMfge8. *P < 0.05, **P < 0.001, ***P < 0.0001. Data are expressed as mean ± s.e.m. For functional assays, each replicate represents an independent experiment. One-way ANOVA with post hoc Bonferroni t-test was used for all statistical analyses except for that in e, where a Student’s t-test was used. For western blots, n = 1 for each condition and each blot is representative of 3 independent experiments. Male mice were used for these experiments.
Figure 6
Figure 6
Mfge8−/− mice are protected from DIO. (a) Weight gain in Mfge8−/− and Mfge8+/+ mice on a normal chow diet (NCD) (n = 5) or HFD (n = 10). Statistical analysis compares Mfge8−/− and Mfge8+/+ mice on a HFD. (b) eWAT weights in 20-week-old Mfge8−/− and Mfge8+/+ mice on a HFD. n = 5. (c) eWAT Mfge8 expression in 20-week-old Mfge8+/+ mice on a NCD or HFD. (d) Adipocyte size in 20-week-old Mfge8+/+ (left) and Mfge8−/− (right) mice on HFD. Scale bars, 200 µm. (e) Adipocyte number per high-powered field (HPF) in 20-week-old mice on a NCD (n = 5) or HFD (n = 10). (f) H&E stain of liver sections from 20-week-old Mfge8+/+ (left) and Mfge8−/− (right) mice on a HFD. Scale bars, 100 µm. (g) Liver TG concentrations in 20-week-old mice on a NCD (n = 5) or HFD (n = 10). (h) Body composition of Mfge8+/+ and Mfge8−/− mice aged 10 weeks on a NCD (left, n = 23 and n = 24, respectively), aged 20 weeks on a NCD (middle, n = 5) or aged 20 weeks on a HFD (right, n = 10) for 12 weeks. (i) Insulin tolerance tests in 20-week-old Mfge8+/+ and Mfge8−/− mice on a HFD. n = 10. (j) Fecal TG (left, n = 6) and energy content (right, n = 3) in Mfge8+/+ and Mfge8−/− mice on a HFD. Each sample represents stool combined from 2 mice. Male mice were used for all experiments. For all in vivo experiments, each group of 5 mice represents 1 independent experiment. *P < 0.05, **P < 0.01, ***P < 0.001. Data are expressed as mean ± s.e.m. A Student’s t-test was used for statistical analyses.

References

    1. Berk PD, et al. Selective up-regulation of fatty acid uptake by adipocytes characterizes both genetic and diet-induced obesity in rodents. J. Biol. Chem. 1999;274:28626–28631. - PubMed
    1. Berk PD, et al. Uptake of long chain free fatty acids is selectively up-regulated in adipocytes of Zucker rats with genetic obesity and non-insulin-dependent diabetes mellitus. J. Biol. Chem. 1997;272:8830–8835. - PubMed
    1. Stump DD, Fan X, Berk PD. Oleic acid uptake and binding by rat adipocytes define dual pathways for cellular fatty acid uptake. J. Lipid Res. 2001;42:509–520. - PubMed
    1. Anderson CM, Stahl A. SLC27 fatty acid transport proteins. Mol. Aspects Med. 2013;34:516–528. - PMC - PubMed
    1. Stahl A, Evans JG, Pattel S, Hirsch D, Lodish HF. Insulin causes fatty acid transport protein translocation and enhanced fatty acid uptake in adipocytes. Dev. Cell. 2002;2:477–488. - PubMed

Publication types

MeSH terms