

Auditory brainstem responses in Cope's gray treefrog (Hyla chrysoscelis): effects of frequency, level, sex and size
- PMID: 24442647
- PMCID: PMC3961062
- DOI: 10.1007/s00359-014-0880-8
Auditory brainstem responses in Cope's gray treefrog (Hyla chrysoscelis): effects of frequency, level, sex and size
Abstract
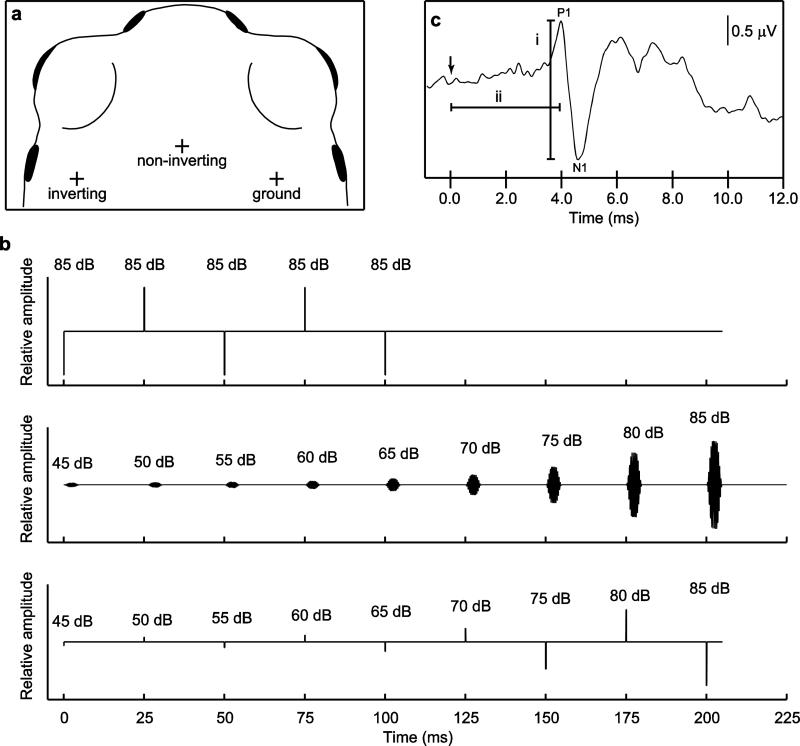
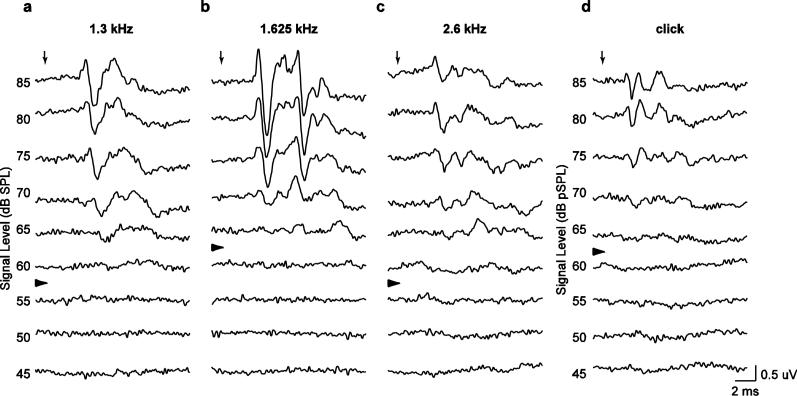
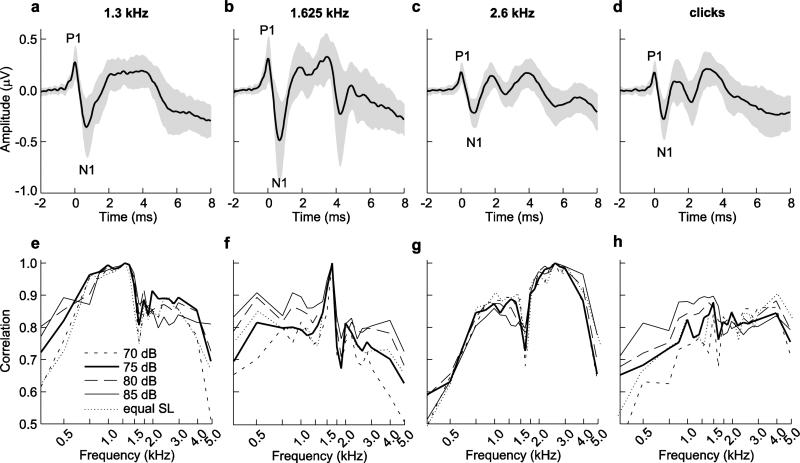
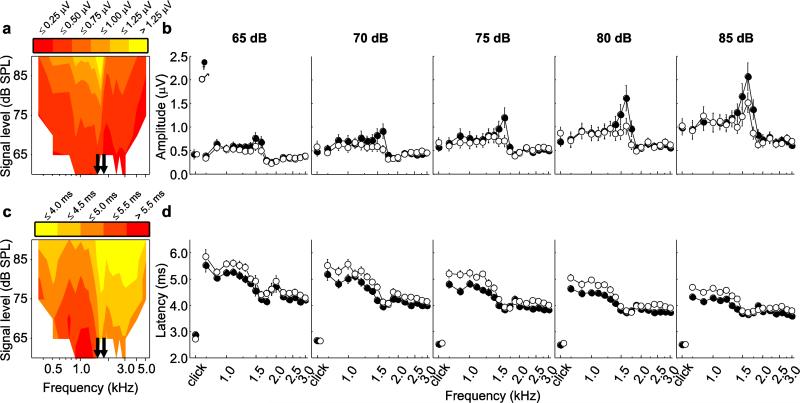
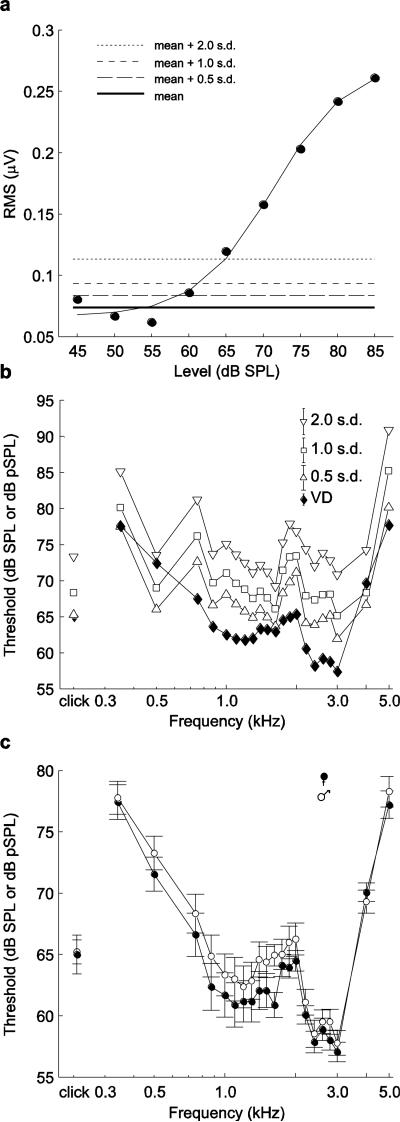
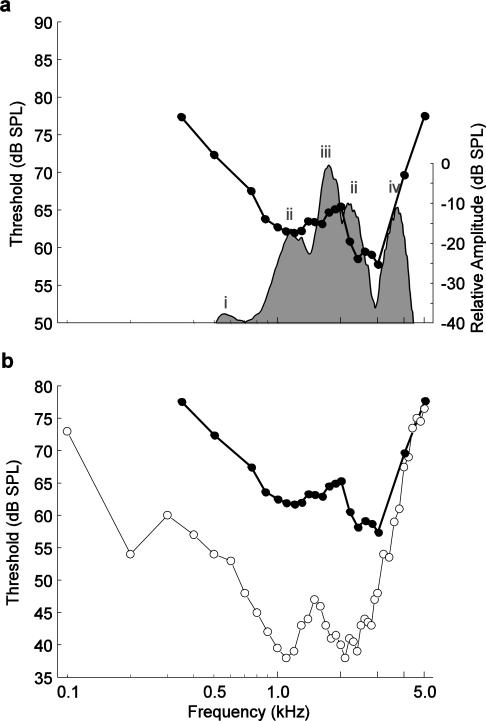
Our knowledge of the hearing abilities of frogs and toads is largely defined by work with a few well-studied species. One way to further advance comparative work on anuran hearing would be greater use of minimally invasive electrophysiological measures, such as the auditory brainstem response (ABR). This study used the ABR evoked by tones and clicks to investigate hearing in Cope's gray treefrog (Hyla chrysoscelis). The objectives were to characterize the effects of sound frequency, sound pressure level, and subject sex and body size on ABRs. The ABR in gray treefrogs bore striking resemblance to ABRs measured in other animals. As stimulus level increased, ABR amplitude increased and latency decreased, and for responses to tones, these effects depended on stimulus frequency. Frequency-dependent differences in ABRs were correlated with expected differences in the tuning of two sensory end organs in the anuran inner ear (the amphibian and basilar papillae). The ABR audiogram indicated two frequency regions of increased sensitivity corresponding to the expected tuning of the two papillae. Overall, there was no effect of subject size and only small effects related to subject sex. Together, these results indicate the ABR is an effective method to study audition in anurans.
Figures
Similar articles
-
The paradox of hearing at the lek: auditory sensitivity increases after breeding in female gray treefrogs (Hyla chrysoscelis).J Comp Physiol A Neuroethol Sens Neural Behav Physiol. 2019 Aug;205(4):629-639. doi: 10.1007/s00359-019-01354-0. Epub 2019 Jun 21. J Comp Physiol A Neuroethol Sens Neural Behav Physiol. 2019. PMID: 31227859
-
Assessing stimulus and subject influences on auditory evoked potentials and their relation to peripheral physiology in green treefrogs (Hyla cinerea).Comp Biochem Physiol A Mol Integr Physiol. 2014 Dec;178:68-81. doi: 10.1016/j.cbpa.2014.08.005. Epub 2014 Aug 20. Comp Biochem Physiol A Mol Integr Physiol. 2014. PMID: 25151643 Free PMC article.
-
Spatial hearing in Cope's gray treefrog: II. Frequency-dependent directionality in the amplitude and phase of tympanum vibrations.J Comp Physiol A Neuroethol Sens Neural Behav Physiol. 2014 Apr;200(4):285-304. doi: 10.1007/s00359-014-0883-5. Epub 2014 Feb 7. J Comp Physiol A Neuroethol Sens Neural Behav Physiol. 2014. PMID: 24504183 Free PMC article.
-
Frequency specificity of the auditory brainstem response elicited by 1,000-Hz filtered clicks.Audiology. 1990;29(4):181-95. doi: 10.3109/00206099009072849. Audiology. 1990. PMID: 2222287 Review.
-
The Physiological Basis and Clinical Use of the Binaural Interaction Component of the Auditory Brainstem Response.Ear Hear. 2016 Sep-Oct;37(5):e276-e290. doi: 10.1097/AUD.0000000000000301. Ear Hear. 2016. PMID: 27232077 Free PMC article. Review.
Cited by
-
Masking release in temporally fluctuating noise depends on comodulation and overall level in Cope's gray treefrog.J Acoust Soc Am. 2018 Oct;144(4):2354. doi: 10.1121/1.5064362. J Acoust Soc Am. 2018. PMID: 30404526 Free PMC article.
-
Stress and Auditory Responses of the Otophysan Fish, Cyprinella venusta, to Road Traffic Noise.PLoS One. 2015 Sep 23;10(9):e0137290. doi: 10.1371/journal.pone.0137290. eCollection 2015. PLoS One. 2015. PMID: 26398211 Free PMC article.
-
Better than fish on land? Hearing across metamorphosis in salamanders.Proc Biol Sci. 2015 Mar 7;282(1802):20141943. doi: 10.1098/rspb.2014.1943. Proc Biol Sci. 2015. PMID: 25652830 Free PMC article.
-
Treefrogs as animal models for research on auditory scene analysis and the cocktail party problem.Int J Psychophysiol. 2015 Feb;95(2):216-37. doi: 10.1016/j.ijpsycho.2014.01.004. Epub 2014 Jan 11. Int J Psychophysiol. 2015. PMID: 24424243 Free PMC article.
-
Sex differences and endocrine regulation of auditory-evoked, neural responses in African clawed frogs (Xenopus).J Comp Physiol A Neuroethol Sens Neural Behav Physiol. 2016 Jan;202(1):17-34. doi: 10.1007/s00359-015-1049-9. Epub 2015 Nov 14. J Comp Physiol A Neuroethol Sens Neural Behav Physiol. 2016. PMID: 26572136 Free PMC article.
References
-
- Aitkin L, Nelson J, Shepherd R. Development of hearing and vocalization in a marsupial, the Northern Quoll, Dasyurus hallucatus. J Exp Zool. 1996;276:394–402. - PubMed
-
- Amoser S, Ladich F. Are hearing sensitivities of freshwater fish adapted to the ambient noise in their habitats? J Exp Biol. 2005;208:3533–3542. - PubMed
-
- Bartol SM, Musick JA, Lenhardt ML. Auditory evoked potentials of the loggerhead sea turtle (Caretta caretta). Copeia. 1999;1999:836–840.
-
- Bibikov NG. Addition of noise enhances neural synchrony to amplitude-modulated sounds in the frog's midbrain. Hear Res. 2002;173:21–28. - PubMed
Publication types
MeSH terms
Grants and funding
LinkOut - more resources
Full Text Sources
Other Literature Sources
Research Materials
