. 2014 Mar;55(3):375-84.
doi: 10.1194/jlr.M039719. Epub 2014 Jan 17.

Follistatin promotes adipocyte differentiation, browning, and energy metabolism

Affiliations

Follistatin promotes adipocyte differentiation, browning, and energy metabolism

Melissa Braga et al. J Lipid Res. 2014 Mar.

Abstract

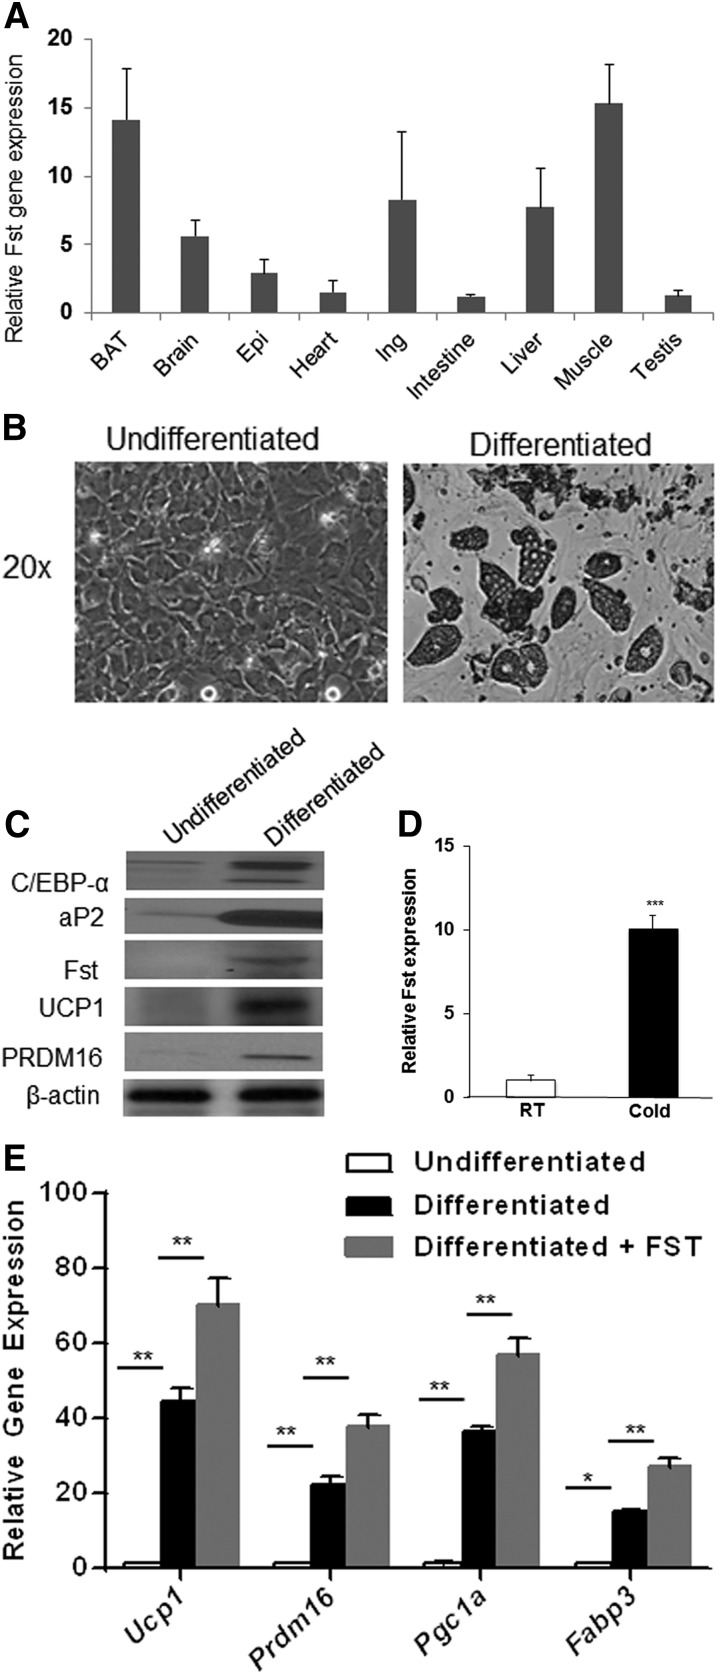
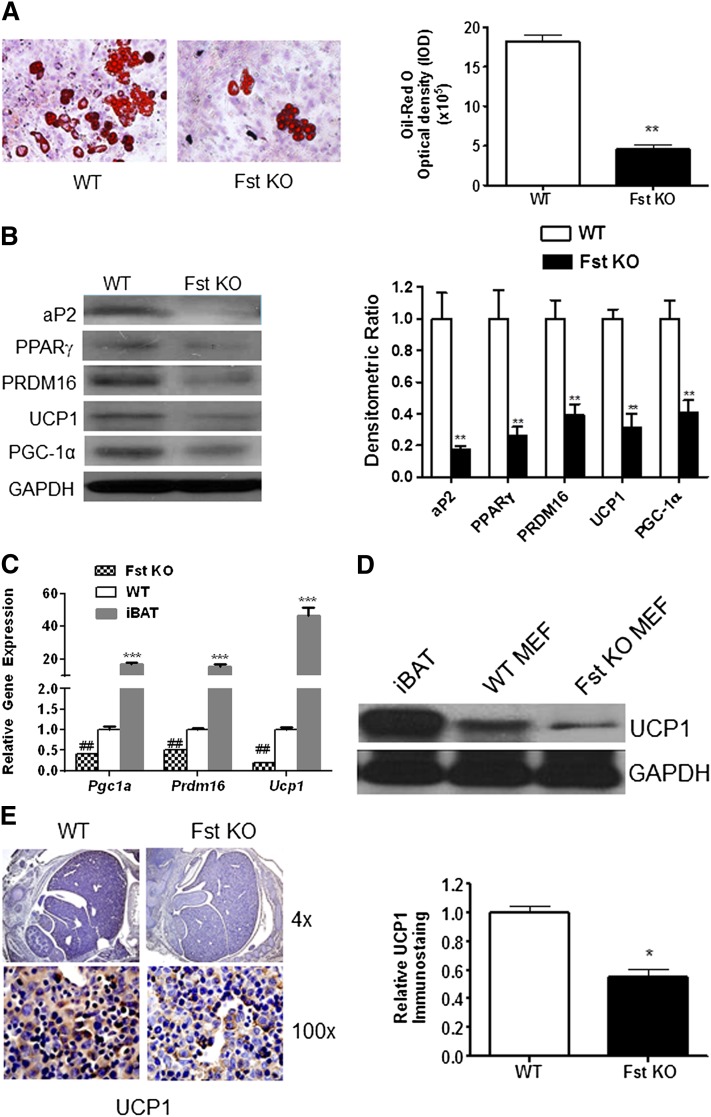
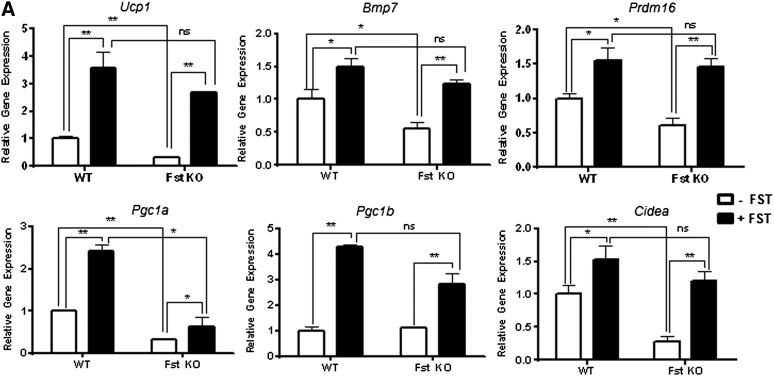
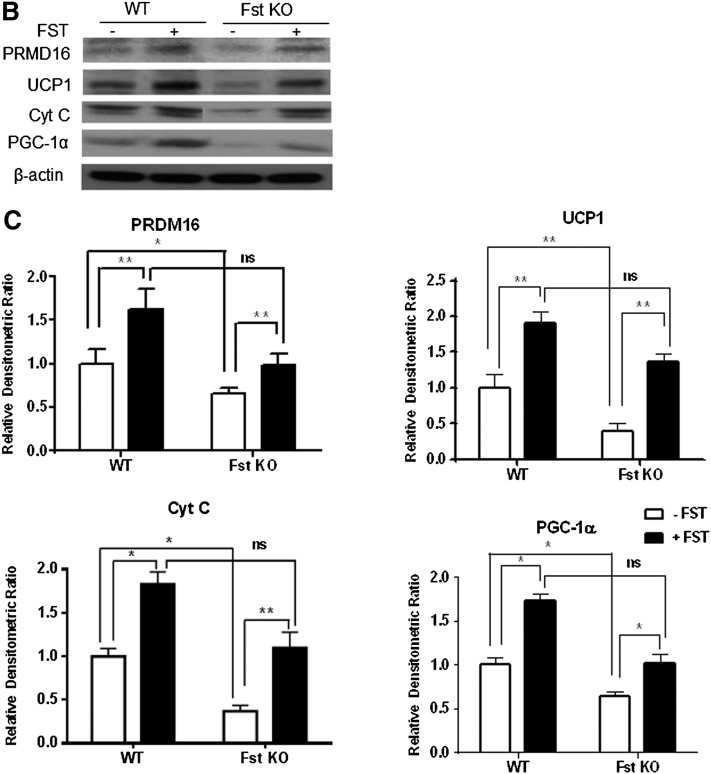
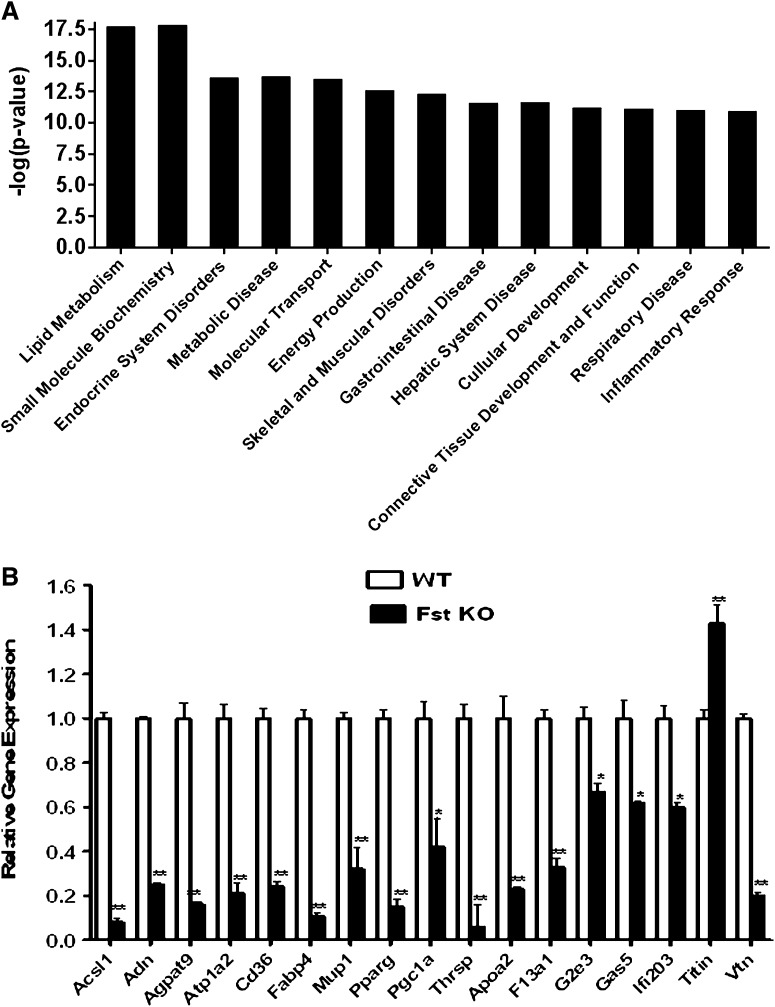
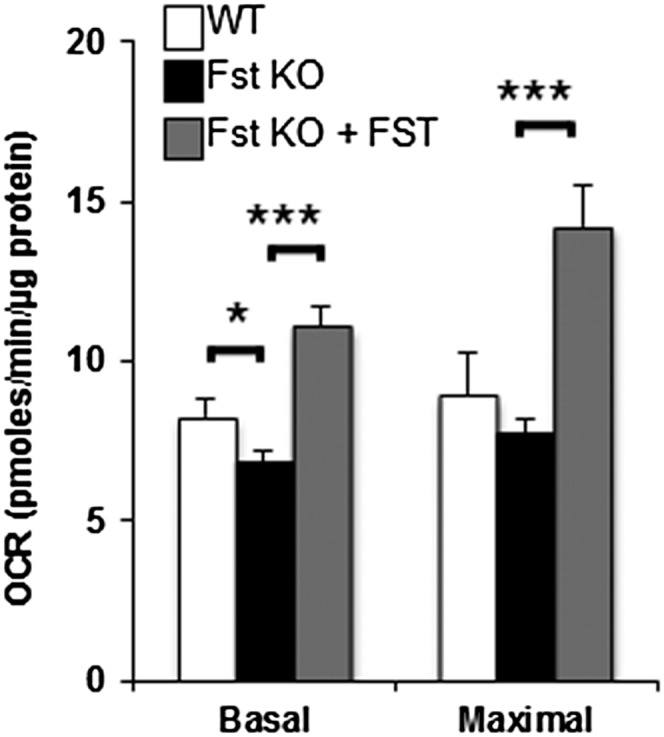
Follistatin (Fst) functions to bind and neutralize the activity of members of the transforming growth factor-β superfamily. Fst has a well-established role in skeletal muscle, but we detected significant Fst expression levels in interscapular brown and subcutaneous white adipose tissue, and further investigated its role in adipocyte biology. Fst expression was induced during adipogenic differentiation of mouse brown preadipocytes and mouse embryonic fibroblasts (MEFs) as well as in cold-induced brown adipose tissue from mice. In differentiated MEFs from Fst KO mice, the induction of brown adipocyte proteins including uncoupling protein 1, PR domain containing 16, and PPAR gamma coactivator-1α was attenuated, but could be rescued by treatment with recombinant FST. Furthermore, Fst enhanced thermogenic gene expression in differentiated mouse brown adipocytes and MEF cultures from both WT and Fst KO groups, suggesting that Fst produced by adipocytes may act in a paracrine manner. Our microarray gene expression profiling of WT and Fst KO MEFs during adipogenic differentiation identified several genes implicated in lipid and energy metabolism that were significantly downregulated in Fst KO MEFs. Furthermore, Fst treatment significantly increases cellular respiration in Fst-deficient cells. Our results implicate a novel role of Fst in the induction of brown adipocyte character and regulation of energy metabolism.

Keywords: brown fat; energy expenditure; mitochondria; mouse embryonic fibroblast; myostatin; uncoupling protein 1.


Figures

Fig. 1.
Fig. 1.
Tissue distribution of Fst and its induction during adipogenic differentiation of mouse brown preadipocyte cells. A: Real-time qPCR analysis of Fst gene expression in mouse tissue panel (n = 3). B: Photomicrographs of mouse brown preadipocyte cells grown either in regular growth medium (undifferentiated) or in BAT-specific adipogenic medium (differentiated) for 8 days. C: Analysis of key adipogenic markers in cell lysates obtained from undifferentiated and differentiated brown preadipocyte cells. Representative data from three independent experiments are shown. D: Fst mRNA levels in BAT from room temperature (RT) and 8 h cold-exposed (4–6°C) (Cold) mice (n = 3). E: Effect of recombinant FST protein (0.5 μg/ml) on selected genes in mouse brown preadipocyte cells during adipogenic differentiation (n = 3). Data are presented as mean ± SEM. *P ≤ 0.05; **P ≤ 0.01; ***P ≤ 0.001. Epi, epididymal fat; Ing, inguinal fat.
Fig. 2.
Fig. 2.
Inhibition of key thermogenic markers in differentiating Fst KO MEF cultures compared with the WT group. A: Left panel, Oil Red O staining. Right panel, quantitative image analysis showing relative Oil Red O OD expressed as IOD (IOD = total intensity × area of staining) of differentiated WT and Fst KO MEF cultures (n = 3). B: Left panel, Western blot analysis. Right panel, densitometric analysis of key adipogenic proteins expressed in WT and Fst KO MEF cultures undergoing adipogenic differentiation (n = 3). C: Real-time qPCR analysis comparing key thermogenic genes expressed in differentiated MEFs and interscapular BAT (iBAT) in vivo (n = 3). D: Comparison of UCP1 protein expression in differentiated WT and Fst KO MEFs and iBAT. Representative data from three independent experiments are shown. E: Left panel, immunohistochemical staining of UCP1 protein in WT and Fst KO embryo sections (day 14) is visible as brown colored regions. Right panel, quantitation of UCP1 staining density in stained sections as performed by computerized densitometry (see Materials and Methods for more detail) (n = 3). Data are presented as mean ± SEM. *P ≤ 0.05; **P ≤ 0.01; ***P ≤ 0.001; ##P ≤ 0.01 compared with WT group.
Fig. 3.
Fig. 3.
Analysis of key BAT-related genes and proteins in WT and Fst KO MEF cultures allowed to differentiate either in the presence or the absence of recombinant FST protein. A: Real-time qPCR analysis in WT and Fst KO MEF cultures after treatment with recombinant FST protein (0.5 μg/ml) after 4 days (n = 3). Western blot (B) and densitometric analysis (C) of PRDM16, UCP1, Cyt C, and PGC-1α proteins in differentiating MEF cultures from WT and Fst KO groups (n = 3). Data are presented as mean ± SEM. *P ≤ 0.05; **P ≤ 0.01. ns, nonsignificant.
Fig. 3.
Fig. 3.
Analysis of key BAT-related genes and proteins in WT and Fst KO MEF cultures allowed to differentiate either in the presence or the absence of recombinant FST protein. A: Real-time qPCR analysis in WT and Fst KO MEF cultures after treatment with recombinant FST protein (0.5 μg/ml) after 4 days (n = 3). Western blot (B) and densitometric analysis (C) of PRDM16, UCP1, Cyt C, and PGC-1α proteins in differentiating MEF cultures from WT and Fst KO groups (n = 3). Data are presented as mean ± SEM. *P ≤ 0.05; **P ≤ 0.01. ns, nonsignificant.
Fig. 4.
Fig. 4.
A: Ingenuity pathway analysis demonstrating lipid metabolism as the most significantly altered pathway between WT versus Fst KO groups (n = 1). B: Validation of Affymetrix gene expression analysis by qPCR using gene-specific primers (n = 3). Data are presented as mean ± SEM. *P ≤ 0.05; **P ≤ 0.01.
Fig. 5.
Fig. 5.
Measurements of OCR in differentiated WT and Fst KO MEFs. Eight day-differentiated MEFs were activated with 10 nM CL 316,243 for 2 h prior to OCR measurements. Basal respiration and maximal respiration capacity were obtained before and after FCCP injection, respectively (n = 3). Data are expressed as mean ± SEM. *P ≤ 0.05; ***P ≤ 0.001.

References

    1. Tseng Y-H., Cypess A. M., Kahn C. R. 2010. Cellular bioenergetics as a target for obesity therapy. Nat. Rev. Drug Discov. 9: 465–482 - PMC - PubMed
    1. Haslam D. W., James W. P. 2005. Obesity. Lancet. 366: 1197–1209 - PubMed
    1. Bhatia L. S., Curzen N. P., Byrne C. D. 2012. Nonalcoholic fatty liver disease and vascular risk. Curr. Opin. Cardiol. 27: 420–428 - PubMed
    1. Isidro M. L., Cordido F. 2009. Drug treatment of obesity: established and emerging therapies. Mini Rev. Med. Chem. 9: 664–673 - PubMed
    1. Grundy S. M. 2006. Drug therapy of the metabolic syndrome: minimizing the emerging crisis in polypharmacy. Nat. Rev. Drug Discov. 5: 295–309 - PubMed

Publication types

MeSH terms

Substances