. 2014 Jan 21:11:10.
doi: 10.1186/1742-2094-11-10.

Cell-selective knockout and 3D confocal image analysis reveals separate roles for astrocyte-and endothelial-derived CCL2 in neuroinflammation

Affiliations

Cell-selective knockout and 3D confocal image analysis reveals separate roles for astrocyte-and endothelial-derived CCL2 in neuroinflammation

Debayon Paul et al. J Neuroinflammation. .

Abstract

Background: Expression of chemokine CCL2 in the normal central nervous system (CNS) is nearly undetectable, but is significantly upregulated and drives neuroinflammation during experimental autoimmune encephalomyelitis (EAE), an animal model of multiple sclerosis which is considered a contributing factor in the human disease. As astrocytes and brain microvascular endothelial cells (BMEC) forming the blood-brain barrier (BBB) are sources of CCL2 in EAE and other neuroinflammatory conditions, it is unclear if one or both CCL2 pools are critical to disease and by what mechanism(s).

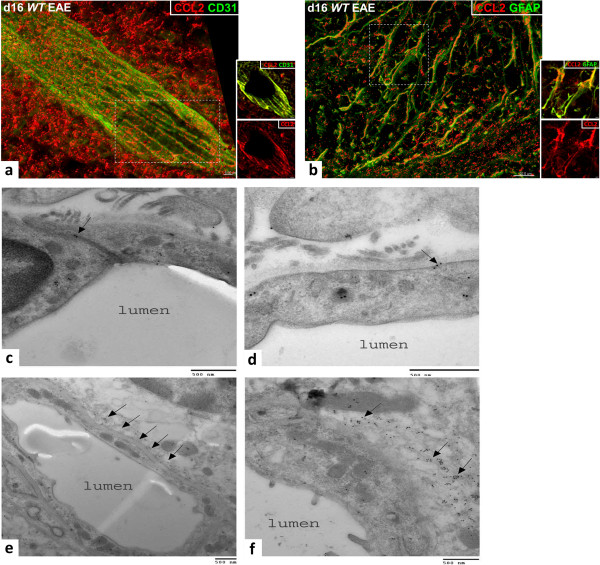
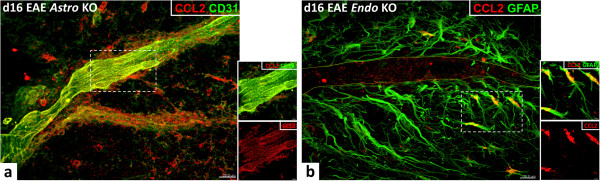
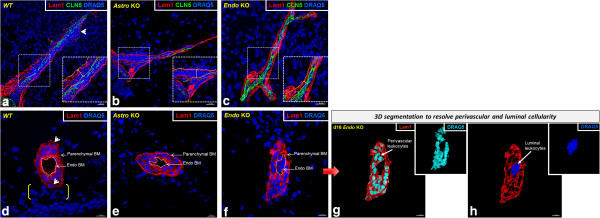
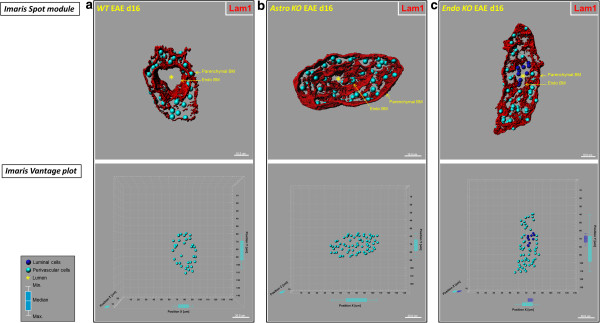
Methods: Mice with selective CCL2 gene knockout (KO) in astrocytes (Astro KO) or endothelial cells (Endo KO) were used to evaluate the respective contributions of these sources to neuroinflammation, i.e., clinical disease progression, BBB damage, and parenchymal leukocyte invasion in a myelin oligodendrocyte glycoprotein peptide (MOG35-55)-induced EAE model. High-resolution 3-dimensional (3D) immunofluorescence confocal microscopy and colloidal gold immuno-electron microscopy were employed to confirm sites of CCL2 expression, and 3D immunofluorescence confocal microscopy utilized to assess inflammatory responses along the CNS microvasculature.

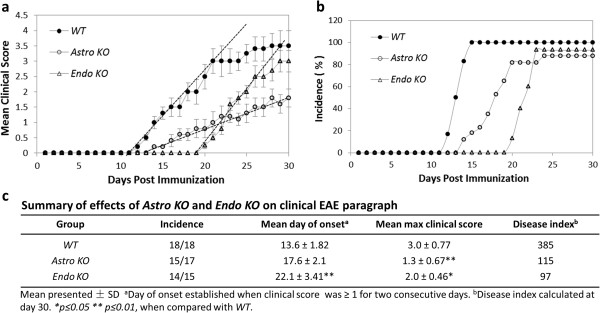
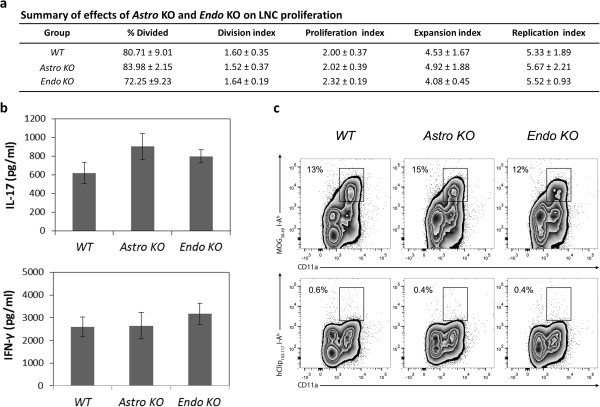
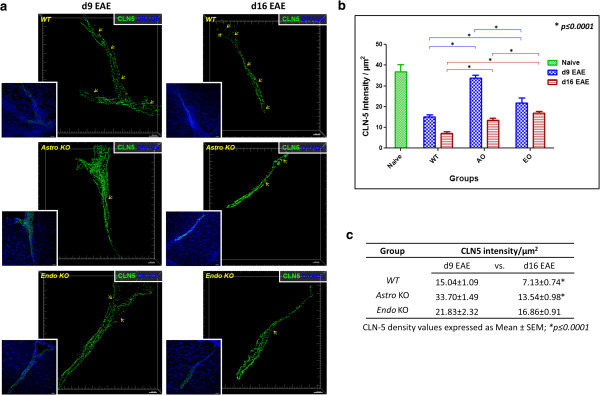
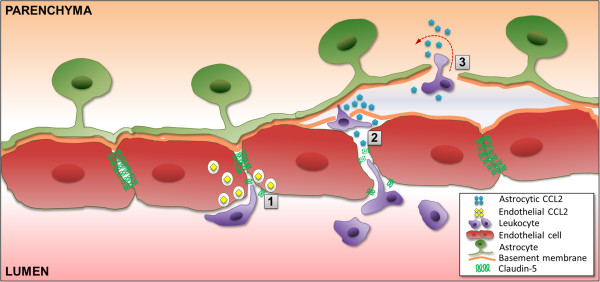
Results: Cell-selective loss of CCL2 immunoreactivity was demonstrated in the respective KO mice. Compared to wild-type (WT) mice, Astro KO mice showed reduced EAE severity but similar onset, while Endo KO mice displayed near normal severity but significantly delayed onset. Neither of the KO mice showed deficits in T cell proliferation, or IL-17 and IFN-γ production, following MOG35-55 exposure in vitro, or altered MOG-major histocompatibility complex class II tetramer binding. 3D confocal imaging further revealed distinct actions of the two CCL2 pools in the CNS. Astro KOs lacked the CNS leukocyte penetration and disrupted immunostaining of CLN-5 at the BBB seen during early EAE in WT mice, while Endo KOs uniquely displayed leukocytes stalled in the microvascular lumen.

Conclusions: These results point to astrocyte and endothelial pools of CCL2 each regulating different stages of neuroinflammation in EAE, and carry implications for drug delivery in neuroinflammatory disease.


Figures

Figure 1
Figure 1
CCL2 expression in spinal cord of WT mice during EAE. (a–b) z-stack confocal images from spinal cord cryosections of WT mice at d16 EAE are shown, revealing staining of CCL2 (red), and CD31 or GFAP (green) to delineate the endothelial cells and astrocytes, respectively. CCL2 staining was isosurface rendered for enhanced spatial perspective. (a)WT mice express CCL2 both along the CD31+ microvascular endothelium, where staining appears aligned along the endothelial junctions, and within the perivascular space (left). (b) CCL2 staining is also associated with GFAP+ astrocytes (right). Insets show co-localization of CCL2 with CD31 or GFAP (yellow) in a single z-slice from the respective regions marked by the hatched white boxes, or CCL2 (red) channel alone. (c–f) Colloidal gold immuno-EM localization of CCL2 localization along microvessels in sections of spinal cord from mice at d16 EAE. (c) CCL2 immunoreactivity is localized within the inter-endothelial junction (arrow) and scattered throughout the endothelial cytoplasm. (d) A cluster of CCL2 immunoreactivity (arrow) is shown in close apposition to an endothelial vesicular structure that is near the plasma membrane. (e) Low magnification showing cross-section of a microvessel (possibly a postcapillary venule or small venule) and punctate distribution of CCL2 immunoreactivity in the perivascular space (arrows). (f) Higher magnification, revealing a high density of CCL2 immunoreactivity in and around what may represent astrocyte endfeet (arrows). Results are representative of 5–7 sections sampled from three mice in each group and two independent experiments. Scale bars are noted on the respective images.
Figure 2
Figure 2
CCL2 expression in spinal cord of Astro KO and Endo KO during EAE. Representative z-stack confocal images from spinal cord cryosections of KO mice at d16 EAE are depicted. Cell-specific CCL2-KO mice display loss of CCL2 staining in respective targeted cell types. (a) Astro KO mice show venule-associated CCL2 staining, but lack staining in the parenchymal astrocytes (left). (b) In contrast, Endo KO mice are deficient in vessel-associated CCL2 staining, but maintain astrocyte staining (right). The endothelial boundary is marked with yellow lines. Insets show co-localization of CCL2 with CD31 or GFAP (yellow) in a single z-slice from the respective regions marked by the hatched white boxes, or CCL2 (red) channel alone. Results are representative of 5–7 sections sampled from three mice in each group and two independent experiments.
Figure 3
Figure 3
Astro KO and Endo KO mice show different patterns of clinical EAE. EAE was induced in WT, Astro KO, and Endo KO mice by MOG35-55 immunization; all mice were observed daily and scored for clinical disease for 30 days. Each group consisted of 5–6 mice, and analysis was performed in triplicate. Graphs represent mean data points from all three analyses ± standard error. (a) Mean clinical EAE scores. Astro KO mice do not attain as severe disease as WT during the evaluation period, while Endo KO mice approach WT disease severity but do so only after significantly delayed onset. The rate of rise of clinical disease, as reflected by the slope of each regression line (hatched lines) through the respective ascending disease scores for the different mice, is similar in both WT and Endo KO mice, but notably less in Astro KO mice. (b) Disease incidence. All mice show a similar incidence of disease but, compared to WT mice, Astro KO mice show only a mild delay while Endo KO mice show a prolonged delay in disease onset. (c) Summary of various clinical disease parameters among the three mouse groups.
Figure 4
Figure 4
LNCs from MOG35-55-immunized WT, Astro KO, and Endo KO mice show similar responses to MOG35-55restimulation in vitro. LNCs were prepared from MOG35-55-immunized mice on d12, and restimulated with MOG35-55 for 72 h in culture, after which time different responses were measured. (a) T cell proliferation. LNC were pulse-labeled with 2 μΜ CFSE for 5 min at the beginning of culture and analyzed after 72 h by FACS, gating on CD3, CD4, CD11a. (b) Cytokine production. The concentrations of IL-17 and IFN-γ were determined in supernatants of LNC after 72 h in culture. (c) Binding of MOG38-49 MHC class II tetramer-PE. Binding was determined after 72 h in culture, and hCLIP103-117 tetramer-PE served as a control for non-specific binding. Plots were gated on CD4+ T lymphocytes. The frequency of MOG38-49 I-Ab tetramer+ CD4+ T cells is similar among WT, Astro KO, and Endo KO groups, while hCLIP103-117 I-Ab tetramer does not bind cultured T cells. The data shown are representative of at least two independent experiments; data in (a) and (b) reflect mean value ± standard error.
Figure 5
Figure 5
Astro KO and Endo KO mice show differential loss of CLN-5 staining in spinal venules during EAE. (a) Isosurface-rendered images were generated from confocal z-stacks of 60 μm thick thoraco-lumbar spinal cord cryosections at d9 and d16 EAE, as described in Materials and Methods. Staining of CLN-5 (green isosurface) and nuclei/DRAQ5 (blue) is shown. Larger images displaying 3D perspective projection views of confocal reconstructions show CLN-5 channel only, to emphasize the fragmented pattern of TJ protein staining. Inserts depict both CLN-5 and nuclei, highlighting the close association of altered CLN-5 staining with dense perivascular cellularity representing infiltrating leukocytes. Arrows demark overt gaps in CLN-5 staining, where the TJ pattern is clearly disrupted. Notably, CLN-5 staining pattern during EAE appears most intact in Astro KO mice, least so in WT mice, and intermediate in Endo KO mice. (b) Quantification of CLN-5 staining as intensity per unit surface area of the endothelium. CLN-5 density in naïve WT mice is included as a reference for the normal state, wherein the pattern of CLN-5 junctional staining is continuous [30]. Statistical comparisons are between groups and within days. (c) Summary of CLN-5 changes. Statistical comparisons are within groups and between days. A total of 12 venules were analyzed in each group sampled from three mice. Data reflect mean value ± standard error. Scale = 20 μm.
Figure 6
Figure 6
Astro KO and Endo KO mice display differences in perivascular cellularity associated with spinal venules during EAE. Isosurface-rendered images were generated from confocal z-stacks of 60 μm cryosections at d16 EAE. Staining of BM Lam 1 (red), CLN-5 (green), and nuclei/DRAQ5 (blue) is shown. (a, b, c) Longitudinal sections reveal the extent of vessel-associated leukocytes. CLN-5 staining is presented to highlight the endothelial boundary. Insets represent enlarged view of areas highlighted in white hatched boxes, while double-headed arrows denote the space between the endothelial and parenchymal BMs. All extravasated leukocytes within this space are considered “perivascular”. In WT mice, a dense accumulation of DRAQ5+ perivascular cells (representing leukocytes) is seen, a few apparently penetrating the fragmented parenchymal BM (arrowhead). In Astro KO mice, a similar dense perivascular cellularity is observed, with visibly intact parenchymal BM and lack of parenchymal leukocyte migration. In Endo KO mice, the BM is also apparently intact, with minimal perivascular cellularity. Scale = 20 μm. (d, e, f) Cross-sections highlight the spatial distribution of vessel-associated leukocytes. In WT mice, the vessel lumen (demarked by white dashes) appears empty and cells are seen in the perivascular space. A few cells are visibly penetrating the parenchymal BM (arrowheads), alongwith dense parenchymal cellularity (brackets). In Astro KO mice, the lumen again appears empty; congregated cells are evident in the perivascular space, with a few parenchymal clusters. In Endo KO mice, cells are clearly present in the lumen, with apparently fewer cells in the perivascular space as compared to WT and Astro KO mice. Parenchymal clustering is seemingly absent. The diffuse DRAQ5+ cells are likely parenchymal neural cells. (g-h) The red arrow designates the same Endo KO image subject to contour-based 3D segmentation (see Materials and Methods) to further resolve luminal (blue) from perivascular (turquoise) cells. Results are representative of 5–6 microvessels sampled from three mice in each group and two independent experiments. Scale = 10 μm.
Figure 7
Figure 7
Astro KO and Endo KO mice display differences in 3D distribution profiles of luminal and perivascular cells. Isosurface-rendered images were generated from confocal z-stacks of 60-μm thick cryosections from WT, Astro KO, and Endo KO mice at d16 EAE. The BM is highlighted by staining of Lam1 (red). (Top row) DRAQ5+ nuclei in luminal and perivascular compartments were optically isolated using 3D contour based segmentation (as described in Materials and Methods), and pseudo-colored blue (luminal) and turquoise (perivascular), respectively. Using Imaris® spot creation module, each of these nuclei is shown in the 3D dataset (volume) as a “spot object,” designating its luminal or perivascular location. Scale = 10 μm. (Bottom row) Imaris® vantage plots showing the 3D distributions of luminal and perivascular cells along microvascular x, y, and z-axes in the corresponding vessels from the top row. Scale = 20 μm. (a) Representative WT vessel showing an empty lumen (*). (b) The lumen in the Astro KO vessel also appears empty (*) but partially collapsed, possibly owing to accumulation of perivascular cells that are missing guidance cues from deleted astrocyte-derived CCL2. (c) In contrast, Endo KO vessel shows evidence of congregation of cells in the lumen (blue), possibly reflecting stalled leukocyte transmigration in absence of endothelial-derived CCL2. Box-and-whisker plots are shown indicating the maximum and minimum spread from the median, in μm, of luminal or perivascular nuclei along the x, y, and z-axes.
Figure 8
Figure 8
Differential actions of astrocyte-derived and endothelial cell-derived CCL2 at CNS venules. Based on observations with Astro KO and Endo KO mice during EAE, the schematic depicts endothelial-derived CCL2 facilitating migration across the endothelium (1), a step post-adhesion. Astrocyte-derived CCL2 is shown promoting both breakdown of endothelial tight junctions (2), and penetration of leukocytes across the parenchymal BM into the CNS parenchyma (3).

Similar articles

Cited by

References

    1. Leonard EJ, Skeel A, Yoshimura T. Biological aspects of monocyte chemoattractant protein-1 (MCP-1) Adv Exp Med Biol. 1991;305:57–64. doi: 10.1007/978-1-4684-6009-4_7. - DOI - PubMed
    1. Mantovani A, Sozzani S, Bottazzi B, Peri G, Sciacca FL, Locati M, Colotta F. Monocyte chemotactic protein-1 (MCP-1): signal transduction and involvement in the regulation of macrophage traffic in normal and neoplastic tissues. Adv Exp Med Biol. 1993;351:47–54. doi: 10.1007/978-1-4615-2952-1_6. - DOI - PubMed
    1. Bennett JL, Elhofy A, Canto MC, Tani M, Ransohoff RM, Karpus WJ. CCL2 transgene expression in the central nervous system directs diffuse infiltration of CD45(high)CD11b(+) monocytes and enhanced Theiler’s murine encephalomyelitis virus-induced demyelinating disease. J Neurovirol. 2003;9:623–636. - PMC - PubMed
    1. Toft-Hansen H, Buist R, Sun XJ, Schellenberg A, Peeling J, Owens T. Metalloproteinases control brain inflammation induced by pertussis toxin in mice overexpressing the chemokine CCL2 in the central nervous system. J Immunol. 2006;177:7242–7249. - PubMed
    1. Yadav A, Saini V, Arora S. MCP-1: chemoattractant with a role beyond immunity: a review. Clin Chim Acta. 2010;411:1570–1579. doi: 10.1016/j.cca.2010.07.006. - DOI - PubMed

Publication types

MeSH terms

Substances