. 2014 Jan 20:8:7.
doi: 10.1186/1752-0509-8-7.

Improvement of experimental testing and network training conditions with genome-wide microarrays for more accurate predictions of drug gene targets

Affiliations

Improvement of experimental testing and network training conditions with genome-wide microarrays for more accurate predictions of drug gene targets

Lisa M Christadore et al. BMC Syst Biol. .

Abstract

Background: Genome-wide microarrays have been useful for predicting chemical-genetic interactions at the gene level. However, interpreting genome-wide microarray results can be overwhelming due to the vast output of gene expression data combined with off-target transcriptional responses many times induced by a drug treatment. This study demonstrates how experimental and computational methods can interact with each other, to arrive at more accurate predictions of drug-induced perturbations. We present a two-stage strategy that links microarray experimental testing and network training conditions to predict gene perturbations for a drug with a known mechanism of action in a well-studied organism.

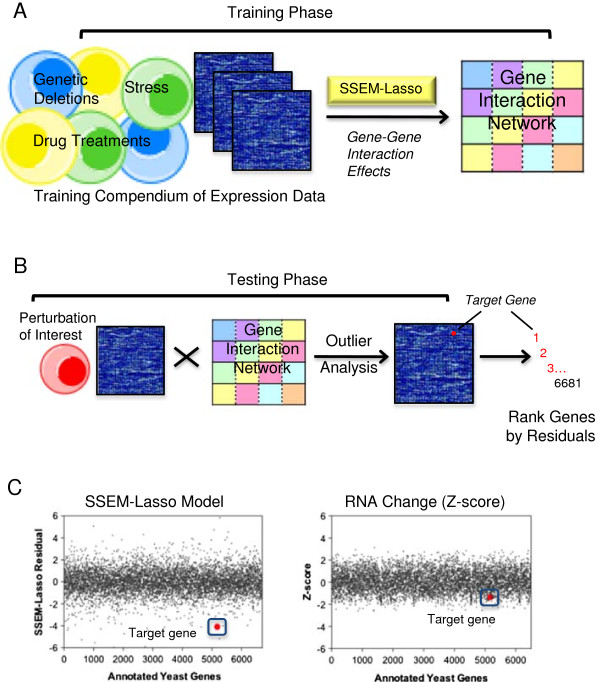
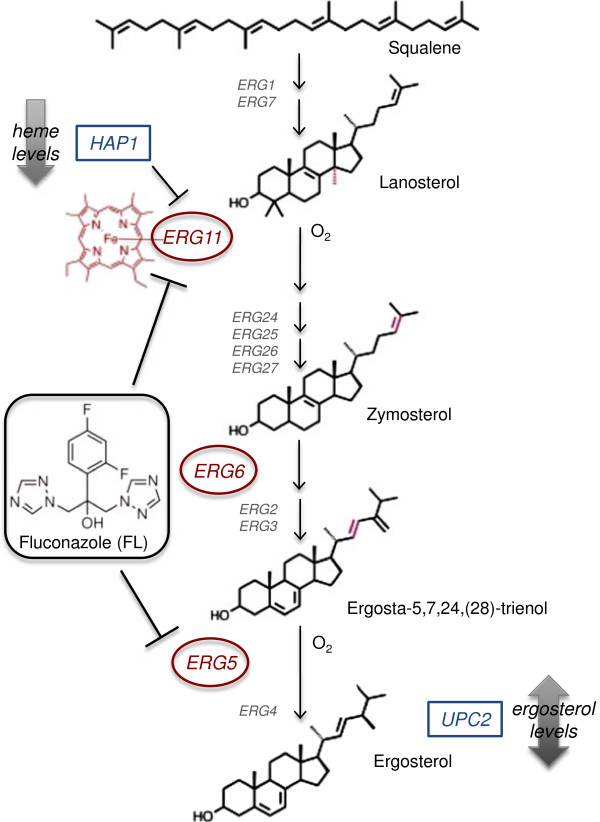
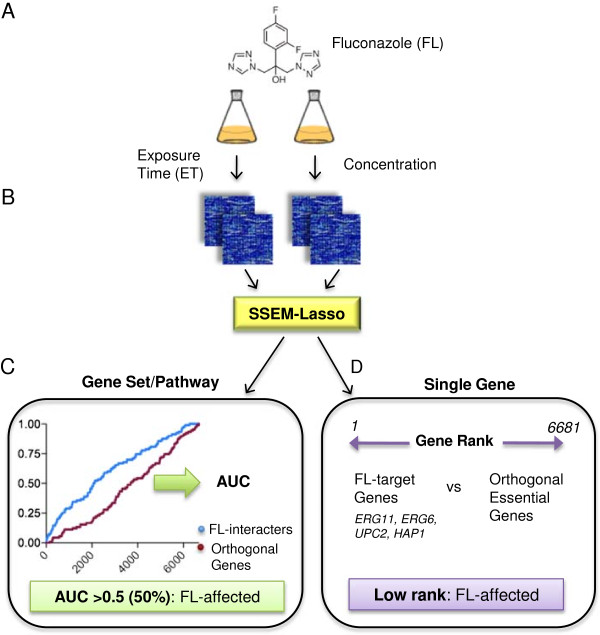
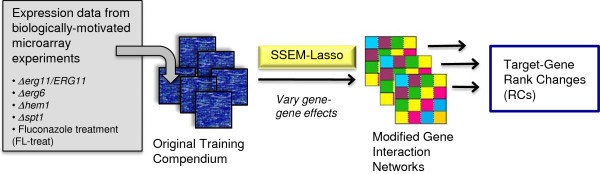
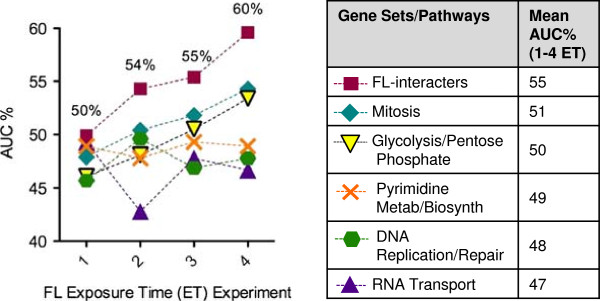
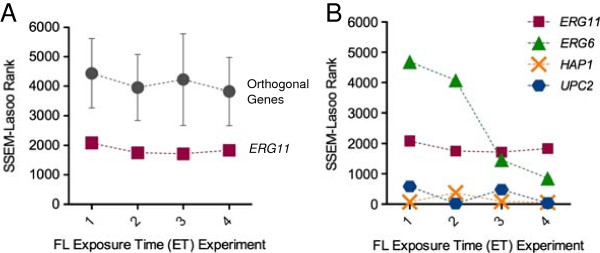
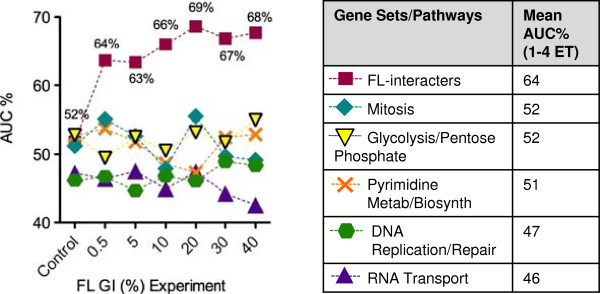
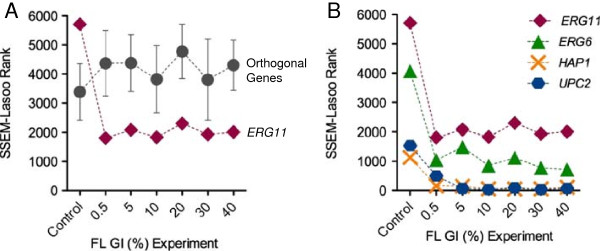
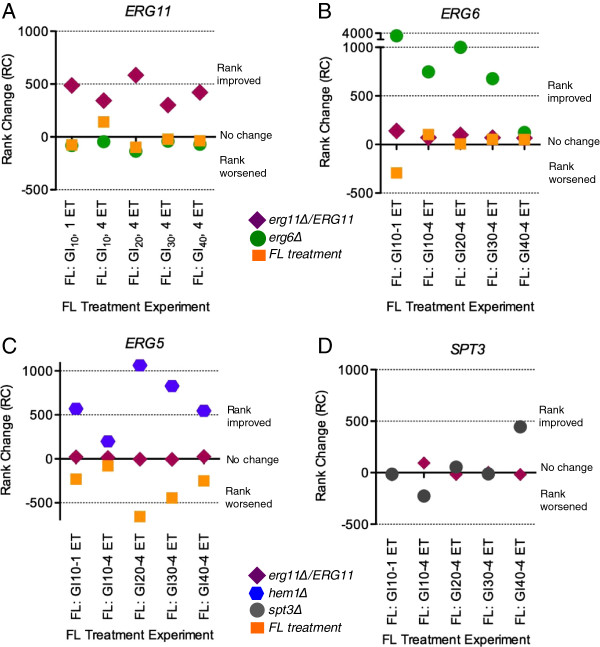
Results: S. cerevisiae cells were treated with the antifungal, fluconazole, and expression profiling was conducted under different biological conditions using Affymetrix genome-wide microarrays. Transcripts were filtered with a formal network-based method, sparse simultaneous equation models and Lasso regression (SSEM-Lasso), under different network training conditions. Gene expression results were evaluated using both gene set and single gene target analyses, and the drug's transcriptional effects were narrowed first by pathway and then by individual genes. Variables included: (i) Testing conditions--exposure time and concentration and (ii) Network training conditions--training compendium modifications. Two analyses of SSEM-Lasso output--gene set and single gene--were conducted to gain a better understanding of how SSEM-Lasso predicts perturbation targets.

Conclusions: This study demonstrates that genome-wide microarrays can be optimized using a two-stage strategy for a more in-depth understanding of how a cell manifests biological reactions to a drug treatment at the transcription level. Additionally, a more detailed understanding of how the statistical model, SSEM-Lasso, propagates perturbations through a network of gene regulatory interactions is achieved.


Figures

Figure 1
Figure 1
SSEM-Lasso network-inference methodology for prediction of gene targets. (A) In the training phase, transcript signals derived from a training compendium of Affymetrix yeast expression data estimated a gene interaction network using sparse simultaneous equation models and Lasso regression (SSEM-Lasso). The gene interaction network accounted for every gene’s effect on another gene within the compendium and was used to infer subsequent experimental perturbations of interest. (B) In the testing phase, experimental expression data was processed with the gene interaction network, and mRNA transcript signals were adjusted based on all inferred gene regulatory effects in the network. An outlier analysis yielded residual values for every gene in the compendium. Residuals were ranked by their absolute values, and genes with lower ranks were considered more accurate predictions of directly targeted genes of the experimental perturbation. (C) SSEM-Lasso “resolves” experimentally perturbed genes out of the background gene-gene interaction “noise” in the network. This results in a more stringent gene-target filter in comparison to standard z-score computation. The data shown is from a top2Δ/TOP2 heterozygous yeast deletion microarray experiment conducted in-house. The gene target, TOP2, is significantly perturbed when evaluated with SSEM-Lasso compared to the RNA z-score prediction.
Figure 2
Figure 2
Summary of FL enzymatic and transcription factor gene targets. Genes affected by fluconazole (FL) investigated in this study are enzymes along the ergosterol biosynthetic pathway (circles) and transcription factors directly regulated by sterol and heme levels (squares). ERG11, the gene that codes for lanosterol C-14-α demethylase, is the primary target of FL. CYP450 C-22 sterol desaturase, ERG5 (circle), is also a target of FL and its enzymatic activity is inhibited upon FL binding. FL’s nitrogen interacts with the heme groups of both Erg11p and Erg5p disrupting normal ergosterol synthesis and affecting downstream enzymatic reactions, including those performed by Δ[24]-sterol C-methyltransferase, Erg6p (circle). FL disruption of sterol biosynthesis additionally affects UPC2 (square), the gene that encodes for a sterol regulatory binding protein responsible for increased transcription of ERG genes upon sterol depletion. FL induces defective respiration due to its disruption of heme and oxygen levels. Therefore, HAP1 (square), a transcription factor responsible for regulating ERG11 expression under hypoxic conditions, is also targeted.
Figure 3
Figure 3
Experimental methodology for fluconazole treatment experiments. (A) Wild-type yeast cells (BY4741) were treated with fluconazole (FL) at various exposure times and concentrations under constant growth conditions. (B) RNA purification, amplification and hybridization to Affymetrix YG S98 GeneChips were carried out and raw signal data was RMA-normalized and processed with SSEM-Lasso to determine residuals and subsequent ranks for all genes in the network. Two replicates for each condition were performed from two separate FL treatment experiments. (C) Gene set analysis detected gene perturbations of multiple, related genes across an increasing SSEM-Lasso rank threshold, resulting in a sensitivity vs. rank threshold curve (ROC curve) for each experimental condition. Area under each ROC curve was calculated, averaged for each duplicate experiment and reported as AUC%. AUC% values >0.5 (50%) indicated greater FL perturbation on the gene set. Gene set analyses were conducted for target pathway, FL-interacters (blue), and orthogonal pathways (purple). (D) Single gene analysis predicted FL perturbation on gene targets, ERG11, ERG6, UPC2 and HAP1, for every FL treatment condition. Target gene ranks were compared to the average ranks of six orthogonal genes. Low ranked genes were considered more accurately perturbed by FL. Ranks were averaged for two replicate experiments.
Figure 4
Figure 4
Network training methodology for fluconazole treatment experiments. S. cerevisiae expression data from 5 microarray experiments were individually added to the original training compendium from Cosgrove et al. Separate SSEM-Lasso runs were performed on each of the modified training compendiums resulting in unique changes to the gene interaction network. Subsequent changes to gene ranks were reported, along with percentile values to evaluate how much “better” or “worse” a gene ranked with a given, modified training compendium.
Figure 5
Figure 5
Exposure time effects on gene set (AUC%) analysis. Areas under each sensitivity vs. rank threshold curve (ROC curve) for FL-interacters and orthogonal gene sets/pathways were converted to percentages (AUC%s) and plotted for each FL ET experiment. Mean AUC%s (ET 1 to 4) for each gene set were computed and compared in the table. Larger AUC% values indicated better prediction of FL action on a gene set. AUC% values were the averages of two replicates.
Figure 6
Figure 6
Exposure time effects on single gene (rank) analysis. (A) SSEM-Lasso ranks of FL’s primary gene target, ERG11 (squares), were compared to gene rank averages for six orthogonal genes, MPS1, ADE13, TOP2, CDC9, PAB1 and UBA1 (circles), across increasing ETs. Error bars represent standard deviation for orthogonal gene ranks. (B) SSEM-Lasso ranks of all FL targets, ERG11 (squares), ERG6 (triangles), UPC2 (hexagons) and HAP1 (crosses) versus FL ET experiments. Cells were treated with FL concentrations that corresponded to increasing growth inhibitory percentages, GI%s (x-axis). Lower ranks indicated better prediction of FL action on an individual gene. All ranks were the averages of two replicates.
Figure 7
Figure 7
Concentration effects on gene set (AUC%) analysis. Areas under each sensitivity vs. rank threshold curve (ROC curve) for FL-interacters and orthogonal gene sets were converted to percentages (AUC%s) and plotted for each FL microarray concentration experiment. Cells were treated with FL concentrations that corresponded to increasing growth inhibitory percentages, GI%s (x-axis). Mean AUC%s (GI0.5 to GI40) for each gene set were computed and compared in the table. Larger AUC% values indicated better prediction of FL action on a gene set. AUC% values were the averages of two replicates.
Figure 8
Figure 8
Concentration effects on single gene (rank) analysis. (A) SSEM-Lasso ranks of FL’s primary gene target, ERG11 (diamonds), were compared to gene rank averages for six orthogonal genes, MPS1, ADE13, TOP2, CDC9, PAB1 and UBA1 (circles), across increasing FL concentrations. Error bars represent standard deviation for orthogonal genes. (B) SSEM-Lasso ranks of all FL targets, ERG11 (diamonds), ERG6 (triangles), UPC2 (hexagons) and HAP1 (crosses) versus concentration experiments. Cells were treated with FL concentrations that corresponded to increasing growth inhibitory percentages, GI%s (x-axis). Lower ranks indicated better prediction of FL action on an individual gene. All ranks are the averages of two replicates.
Figure 9
Figure 9
Training phase variation effects on single gene (rank) predictions. The modified training compendiums were used to predict ranks of FL-target genes, ERG11, ERG6, ERG5, and non-target gene, SPT3, in five representative FL treatment experiments. First, gene ranks for 2 replicate experiments were averaged. Next, ranks from the original training compendium were subtracted from ranks derived from the modified training compendium, yielding rank changes, or RCs. Finally, RCs (y-axis) were plotted for five representative FL treatment experiments (x-axis) for each gene: (A) ERG11, (B) ERG6, (C) ERG5, and (D) SPT3. Positive RCs signified the gene rank improved with the addition of the corresponding deletion experiment data to the compendium. An RC of 0 indicated no change. A negative RC indicated rank increased or worsened.

Similar articles

References

    1. Debouck C, Goodfellow PN. DNA microarrays in drug discovery and development. Nat Genet. 1999;21(1 Suppl):48–50. - PubMed
    1. Gerhold DL, Jensen RV, Gullans SR. Better therapeutics through microarrays. Nat Genet. 2002;32(Suppl):547–551. - PubMed
    1. Ho CH, Piotrowski J, Dixon SJ, Baryshnikova A, Costanzo M, Boone C. Combining functional genomics and chemical biology to identify targets of bioactive compounds. Curr Opin Chem Biol. 2011;15(1):66–78. doi: 10.1016/j.cbpa.2010.10.023. - DOI - PubMed
    1. Meltzer PS. Spotting the target: microarrays for disease gene discovery. Curr Opin Genet Dev. 2001;11(3):258–263. doi: 10.1016/S0959-437X(00)00187-8. - DOI - PubMed
    1. Oehler VG, Yeung KY, Choi YE, Bumgarner RE, Raftery AE, Radich JP. The derivation of diagnostic markers of chronic myeloid leukemia progression from microarray data. Blood. 2009;114(15):3292–3298. doi: 10.1182/blood-2009-03-212969. - DOI - PMC - PubMed

Publication types

MeSH terms