

Who are the Okinawans? Ancestry, genome diversity, and implications for the genetic study of human longevity from a geographically isolated population
- PMID: 24444611
- PMCID: PMC4271021
- DOI: 10.1093/gerona/glt203
Who are the Okinawans? Ancestry, genome diversity, and implications for the genetic study of human longevity from a geographically isolated population
Abstract
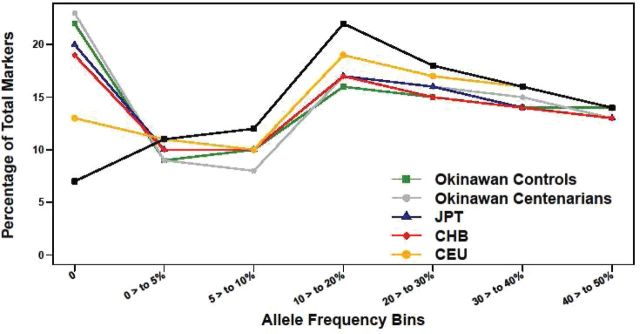
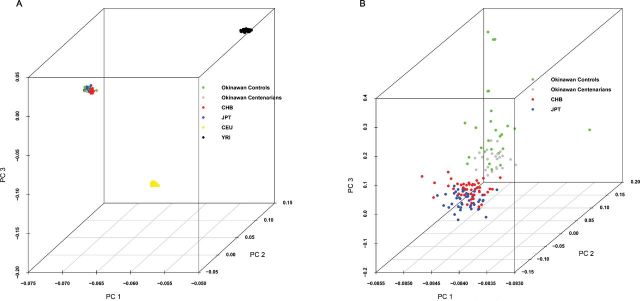
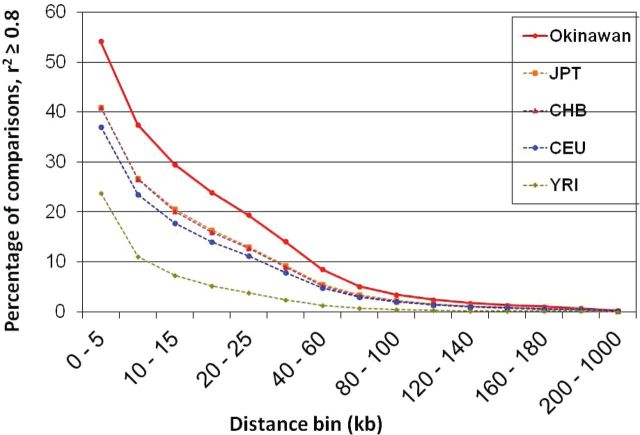
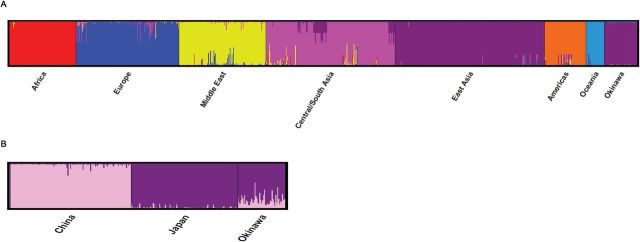
Isolated populations have advantages for genetic studies of longevity from decreased haplotype diversity and long-range linkage disequilibrium. This permits smaller sample sizes without loss of power, among other utilities. Little is known about the genome of the Okinawans, a potential population isolate, recognized for longevity. Therefore, we assessed genetic diversity, structure, and admixture in Okinawans, and compared this with Caucasians, Chinese, Japanese, and Africans from HapMap II, genotyped on the same Affymetrix GeneChip Human Mapping 500K array. Principal component analysis, haplotype coverage, and linkage disequilibrium decay revealed a distinct Okinawan genome-more homogeneity, less haplotype diversity, and longer range linkage disequilibrium. Population structure and admixture analyses utilizing 52 global reference populations from the Human Genome Diversity Cell Line Panel demonstrated that Okinawans clustered almost exclusively with East Asians. Sibling relative risk (λs) analysis revealed that siblings of Okinawan centenarians have 3.11 times (females) and 3.77 times (males) more likelihood of centenarianism. These findings suggest that Okinawans are genetically distinct and share several characteristics of a population isolate, which are prone to develop extreme phenotypes (eg, longevity) from genetic drift, natural selection, and population bottlenecks. These data support further exploration of genetic influence on longevity in the Okinawans.
Keywords: Ancestry; Genome diversity; HapMap.; Longevity; Okinawa.
© The Author 2014. Published by Oxford University Press on behalf of The Gerontological Society of America. All rights reserved. For permissions, please e-mail: journals.permissions@oup.com.
Figures
Similar articles
-
Siblings of Okinawan centenarians share lifelong mortality advantages.J Gerontol A Biol Sci Med Sci. 2006 Apr;61(4):345-54. doi: 10.1093/gerona/61.4.345. J Gerontol A Biol Sci Med Sci. 2006. PMID: 16611700
-
Genetic determinants of exceptional human longevity: insights from the Okinawa Centenarian Study.Age (Dordr). 2006 Dec;28(4):313-32. doi: 10.1007/s11357-006-9020-x. Epub 2006 Dec 8. Age (Dordr). 2006. PMID: 22253498 Free PMC article.
-
Declining longevity advantage and low birthweight in Okinawa.Asia Pac J Public Health. 2008 Oct;20 Suppl:95-101. Asia Pac J Public Health. 2008. PMID: 19533867
-
Demographic, phenotypic, and genetic characteristics of centenarians in Okinawa and Japan: Part 1-centenarians in Okinawa.Mech Ageing Dev. 2017 Jul;165(Pt B):75-79. doi: 10.1016/j.mad.2016.11.001. Epub 2016 Nov 12. Mech Ageing Dev. 2017. PMID: 27845177 Review.
-
Genetic susceptibility factors of Type 1 diabetes in Asians.Diabetes Metab Res Rev. 2001 Jan-Feb;17(1):2-11. doi: 10.1002/1520-7560(2000)9999:9999<::aid-dmrr164>3.0.co;2-m. Diabetes Metab Res Rev. 2001. PMID: 11241886 Review.
Cited by
-
FOXO3 Longevity Genotype Mitigates Risk Posed by Hypertension on Incident Coronary Artery Disease in Middle-Aged Men: Kuakini Honolulu Heart Program.J Gerontol A Biol Sci Med Sci. 2024 Dec 1;79(12):glae254. doi: 10.1093/gerona/glae254. J Gerontol A Biol Sci Med Sci. 2024. PMID: 39497655 Free PMC article.
-
Association between handgrip strength, walking, age-related illnesses and cognitive status in a sample of Portuguese centenarians.Eur Rev Aging Phys Act. 2017 Jul 1;14:9. doi: 10.1186/s11556-017-0178-2. eCollection 2017. Eur Rev Aging Phys Act. 2017. PMID: 28680504 Free PMC article.
-
Redefining Age-Friendly Neighbourhoods: Translating the Promises of Blue Zones for Contemporary Urban Environments.Int J Environ Res Public Health. 2024 Mar 19;21(3):365. doi: 10.3390/ijerph21030365. Int J Environ Res Public Health. 2024. PMID: 38541364 Free PMC article.
-
Novel protective effect of the FOXO3 longevity genotype on mechanisms of cellular aging in Okinawans.NPJ Aging. 2024 Mar 8;10(1):18. doi: 10.1038/s41514-024-00142-8. NPJ Aging. 2024. PMID: 38459055 Free PMC article.
-
Commonalities in Development of Pure Breeds and Population Isolates Revealed in the Genome of the Sardinian Fonni's Dog.Genetics. 2016 Oct;204(2):737-755. doi: 10.1534/genetics.116.192427. Epub 2016 Aug 12. Genetics. 2016. PMID: 27519604 Free PMC article.
References
Publication types
MeSH terms
Grants and funding
- 5R01AG038707-02/AG/NIA NIH HHS/United States
- K08 AG022788/AG/NIA NIH HHS/United States
- K01 AG022782/AG/NIA NIH HHS/United States
- R01 AG038707/AG/NIA NIH HHS/United States
- R01 AG027060/AG/NIA NIH HHS/United States
- R01MH093500/MH/NIMH NIH HHS/United States
- U01 MH092758/MH/NIMH NIH HHS/United States
- R01 AG030474/AG/NIA NIH HHS/United States
- R01 AG023692/AG/NIA NIH HHS/United States
- 5R01AG027060-06/AG/NIA NIH HHS/United States
- U19 AG023122/AG/NIA NIH HHS/United States
- K08 AG22788-02/AG/NIA NIH HHS/United States
- R01 MH093500/MH/NIMH NIH HHS/United States
- R03 AG02-293-01/AG/NIA NIH HHS/United States
LinkOut - more resources
Full Text Sources
Other Literature Sources
