α4βδ-GABAARs in the hippocampal CA1 as a biomarker for resilience to activity-based anorexia
- PMID: 24444828
- PMCID: PMC3996507
- DOI: 10.1016/j.neuroscience.2014.01.011
α4βδ-GABAARs in the hippocampal CA1 as a biomarker for resilience to activity-based anorexia
Abstract
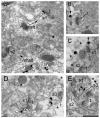
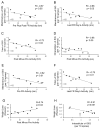
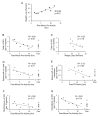
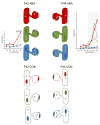
Anorexia nervosa (AN) is a psychiatric illness characterized by restricted eating and an intense fear of gaining weight. Most individuals with AN are females, diagnosed first during adolescence, 40-80% of whom exhibit excessive exercise, and an equally high number with a history of anxiety disorder. We sought to determine the cellular basis for individual differences in AN vulnerability by using an animal model, activity-based anorexia (ABA), that is induced by combining food restriction (FR) with access to a running wheel that allows voluntary exercise. Previously, we showed that by the fourth day of FR, the ABA group of adolescent female rats exhibit >500% greater levels of non-synaptic α4βδ-GABAARs at the plasma membrane of hippocampal CA1 pyramidal cell spines, relative to the levels found in age-matched controls that are not FR and without wheel access. Here, we show that the ABA group exhibits individual differences in body weight loss, with some losing nearly 30%, while others lose only 15%. The individual differences in weight loss are ascribable to individual differences in wheel activity that both precedes and concurs with days of FR. Moreover, the increase in activity during FR correlates strongly and negatively with α4βδ-GABAAR levels (R=-0.9, p<0.01). This negative correlation is evident within 2days of FR, before body weight loss approaches life-threatening levels for any individual. These findings suggest that increased shunting inhibition by α4βδ-GABAARs in spines of CA1 pyramidal neurons may participate in the protection against the ABA-inducing environmental factors of severe weight loss by suppressing excitability of the CA1 pyramidal neurons which, in turn, is related indirectly to suppression of excessive exercise. The data also indicate that, although exercise has many health benefits, it can be maladaptive to individuals with low levels of α4βδ-GABAARs in the CA1, particularly when combined with FR.
Keywords: adolescence; alpha4-GABA-receptor; anxiety; hippocampus; neuromodulation; stress.
Copyright © 2014 IBRO. Published by Elsevier Ltd. All rights reserved.
Figures


Similar articles
-
α4βδ-GABAA receptors in dorsal hippocampal CA1 of adolescent female rats traffic to the plasma membrane of dendritic spines following voluntary exercise and contribute to protection of animals from activity-based anorexia through localization at excitatory synapses.J Neurosci Res. 2018 Sep;96(9):1450-1466. doi: 10.1002/jnr.24035. Epub 2017 Feb 20. J Neurosci Res. 2018. PMID: 28218471 Free PMC article.
-
Adolescent female rats exhibiting activity-based anorexia express elevated levels of GABA(A) receptor α4 and δ subunits at the plasma membrane of hippocampal CA1 spines.Synapse. 2012 May;66(5):391-407. doi: 10.1002/syn.21528. Epub 2012 Feb 15. Synapse. 2012. PMID: 22213233 Free PMC article.
-
Exogenous progesterone exacerbates running response of adolescent female mice to repeated food restriction stress by changing α4-GABAA receptor activity of hippocampal pyramidal cells.Neuroscience. 2015 Dec 3;310:322-41. doi: 10.1016/j.neuroscience.2015.09.006. Epub 2015 Sep 14. Neuroscience. 2015. PMID: 26383252 Free PMC article.
-
Synaptic changes in the hippocampus of adolescent female rodents associated with resilience to anxiety and suppression of food restriction-evoked hyperactivity in an animal model for anorexia nervosa.Brain Res. 2017 Jan 1;1654(Pt B):102-115. doi: 10.1016/j.brainres.2016.01.019. Epub 2016 Jan 15. Brain Res. 2017. PMID: 26779892 Free PMC article. Review.
-
The influence of stress at puberty on mood and learning: role of the α4βδ GABAA receptor.Neuroscience. 2013 Sep 26;249:192-213. doi: 10.1016/j.neuroscience.2012.09.065. Epub 2012 Oct 16. Neuroscience. 2013. PMID: 23079628 Free PMC article. Review.
Cited by
-
Activity Based Anorexia as an Animal Model for Anorexia Nervosa-A Systematic Review.Front Nutr. 2019 May 21;6:69. doi: 10.3389/fnut.2019.00069. eCollection 2019. Front Nutr. 2019. PMID: 31165073 Free PMC article.
-
Brain Volume Loss, Astrocyte Reduction, and Inflammation in Anorexia Nervosa.Adv Neurobiol. 2021;26:283-313. doi: 10.1007/978-3-030-77375-5_12. Adv Neurobiol. 2021. PMID: 34888839
-
Activity-based anorexia animal model: a review of the main neurobiological findings.J Eat Disord. 2021 Oct 2;9(1):123. doi: 10.1186/s40337-021-00481-x. J Eat Disord. 2021. PMID: 34600568 Free PMC article. Review.
-
Voluntary Wheel Running Exercise Evoked by Food-Restriction Stress Exacerbates Weight Loss of Adolescent Female Rats But Also Promotes Resilience by Enhancing GABAergic Inhibition of Pyramidal Neurons in the Dorsal Hippocampus.Cereb Cortex. 2019 Sep 13;29(10):4035-4049. doi: 10.1093/cercor/bhy283. Cereb Cortex. 2019. PMID: 30462186 Free PMC article.
-
Anxiety is correlated with running in adolescent female mice undergoing activity-based anorexia.Behav Neurosci. 2015 Apr;129(2):170-82. doi: 10.1037/bne0000040. Epub 2015 Mar 2. Behav Neurosci. 2015. PMID: 25730124 Free PMC article.
References
-
- Aigner M, Treasure J, Kaye W, Kasper S Disorders WTFOE. World Federation of Societies of Biological Psychiatry (WFSBP) guidelines for the pharmacological treatment of eating disorders. The world journal of biological psychiatry : the official journal of the World Federation of Societies of Biological Psychiatry. 2011;12:400–443. - PubMed
-
- Aoki C, Sabaliauskas N, Chowdhury T, Min JY, Colacino AR, Laurino K, Barbarich-Marsteller NC. Adolescent female rats exhibiting activity-based anorexia express elevated levels of GABA(A) receptor alpha4 and delta subunits at the plasma membrane of hippocampal CA1 spines. Synapse. 2012;66:391–407. - PMC - PubMed
-
- Aoki C, Wu K, Elste A, Len G, Lin S, McAuliffe G, Black IB. Localization of brain-derived neurotrophic factor and TrkB receptors to postsynaptic densities of adult rat cerebral cortex. Journal of neuroscience research. 2000;59:454–463. - PubMed
-
- APA APA. Diagnostic and Statistical Manual of Mental Disorders DSM-5. Washington, DC: 2013. - PubMed
-
- Araujo F, Ruano D, Vitorica J. Absence of association between delta and gamma2 subunits in native GABA(A) receptors from rat brain. European journal of pharmacology. 1998;347:347–353. - PubMed
Publication types
MeSH terms
Substances
Grants and funding
- R01 NS066019/NS/NINDS NIH HHS/United States
- R01NS066019-01A1/NS/NINDS NIH HHS/United States
- P30 EY013079/EY/NEI NIH HHS/United States
- R21 MH091445/MH/NIMH NIH HHS/United States
- R25 NS080686/NS/NINDS NIH HHS/United States
- R01 NS047557/NS/NINDS NIH HHS/United States
- R25 GM097634/GM/NIGMS NIH HHS/United States
- R21MH091445-01/MH/NIMH NIH HHS/United States
- T32 MH019524/MH/NIMH NIH HHS/United States
- R01NS047557-07A1/NS/NINDS NIH HHS/United States
- R25GM097634-01/GM/NIGMS NIH HHS/United States
- UL1 TR000038/TR/NCATS NIH HHS/United States
LinkOut - more resources
Full Text Sources
Other Literature Sources
Medical
Miscellaneous

