

Fontan pathway growth: a quantitative evaluation of lateral tunnel and extracardiac cavopulmonary connections using serial cardiac magnetic resonance
- PMID: 24444876
- PMCID: PMC3952493
- DOI: 10.1016/j.athoracsur.2013.11.015
Fontan pathway growth: a quantitative evaluation of lateral tunnel and extracardiac cavopulmonary connections using serial cardiac magnetic resonance
Abstract
Background: Typically, a Fontan connection is constructed as either a lateral tunnel (LT) pathway or an extracardiac (EC) conduit. The LT is formed partially by atrial wall and is assumed to have growth potential, but the extent and nature of LT pathway growth have not been well characterized. A quantitative analysis was performed to evaluate this issue.
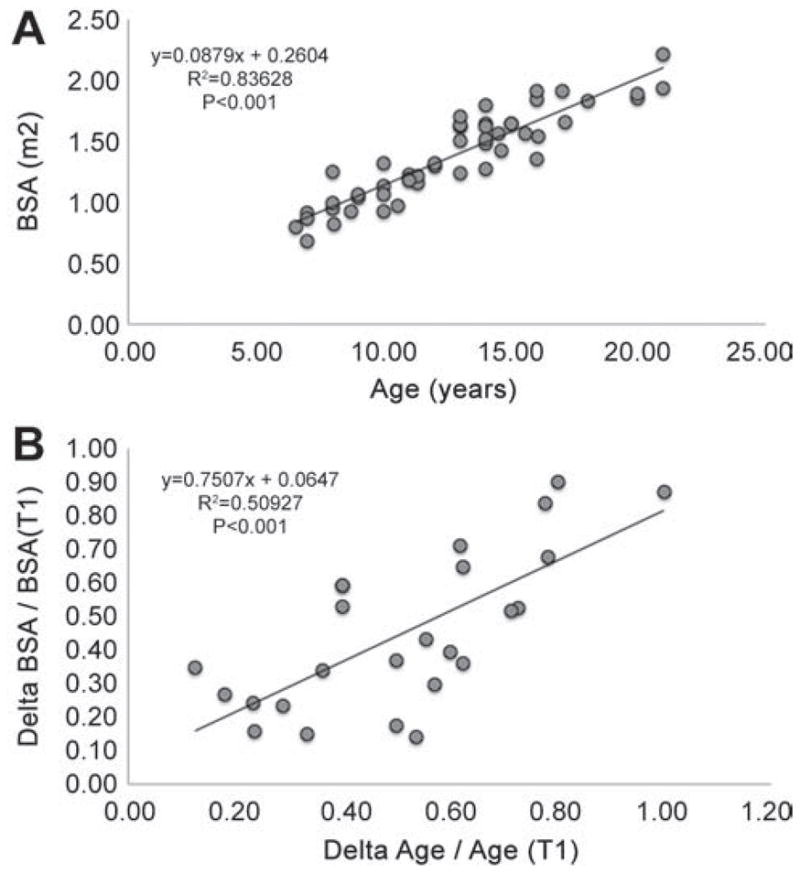
Methods: Retrospective serial cardiac magnetic resonance data were obtained for 16 LT and 9 EC patients at 2 time points (mean time between studies, 4.2 ± 1.6 years). Patient-specific anatomies and flows were reconstructed. Geometric parameters of Fontan pathway vessels and the descending aorta were quantified, normalized to body surface area (BSA), and compared between time points and Fontan pathway types.
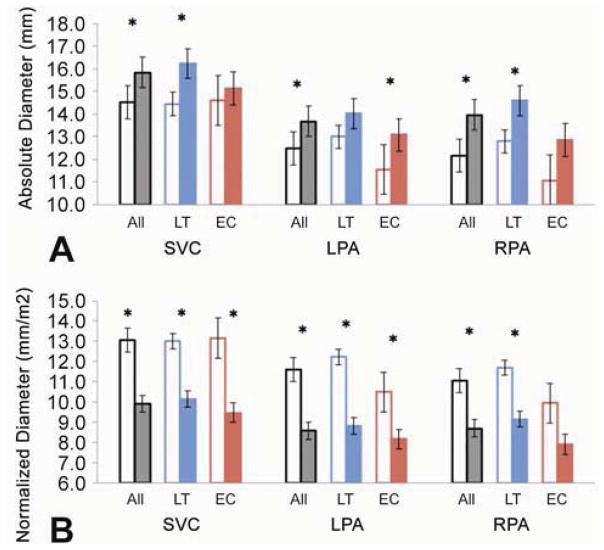
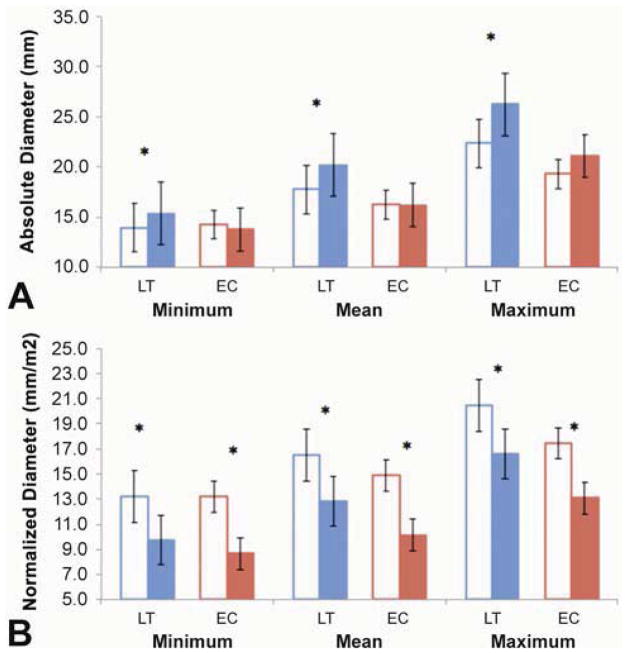
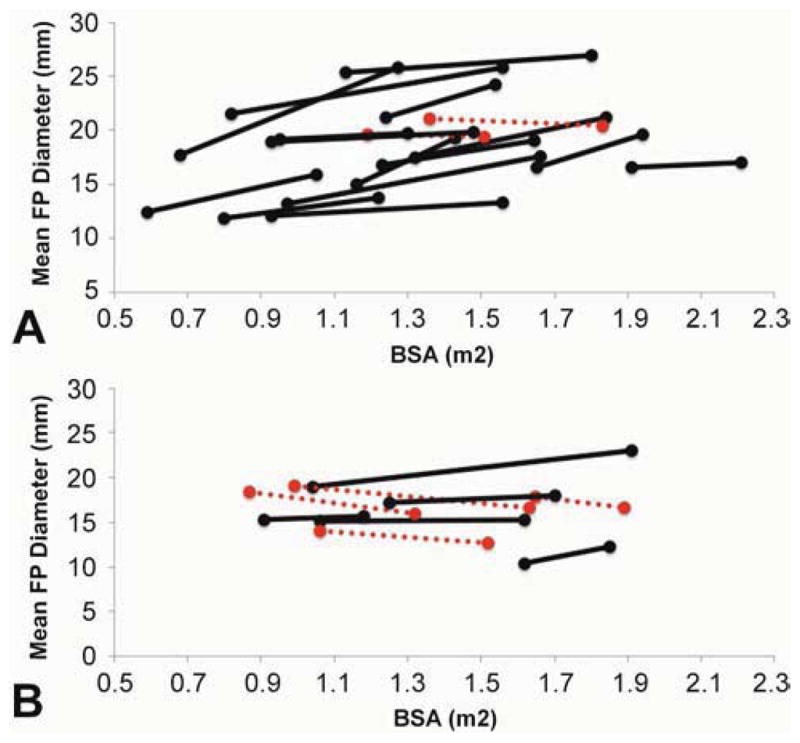
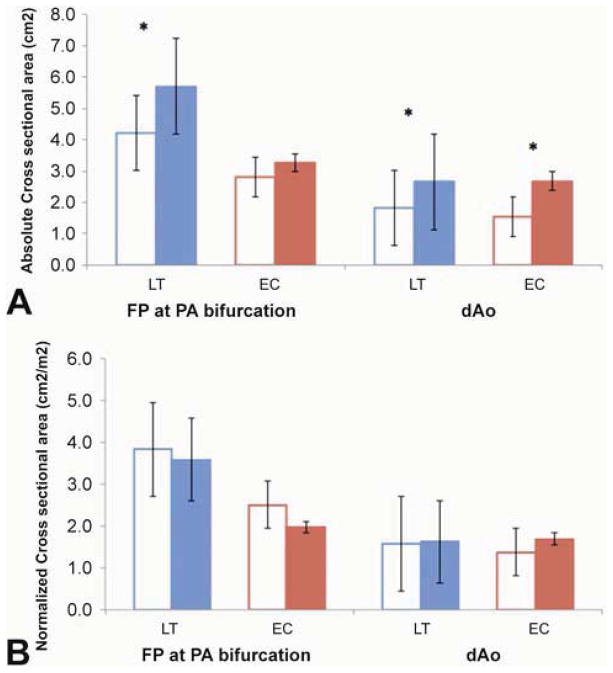
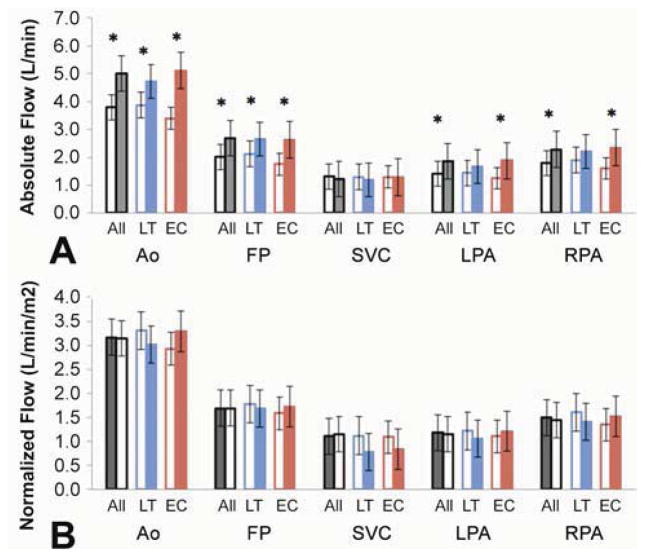
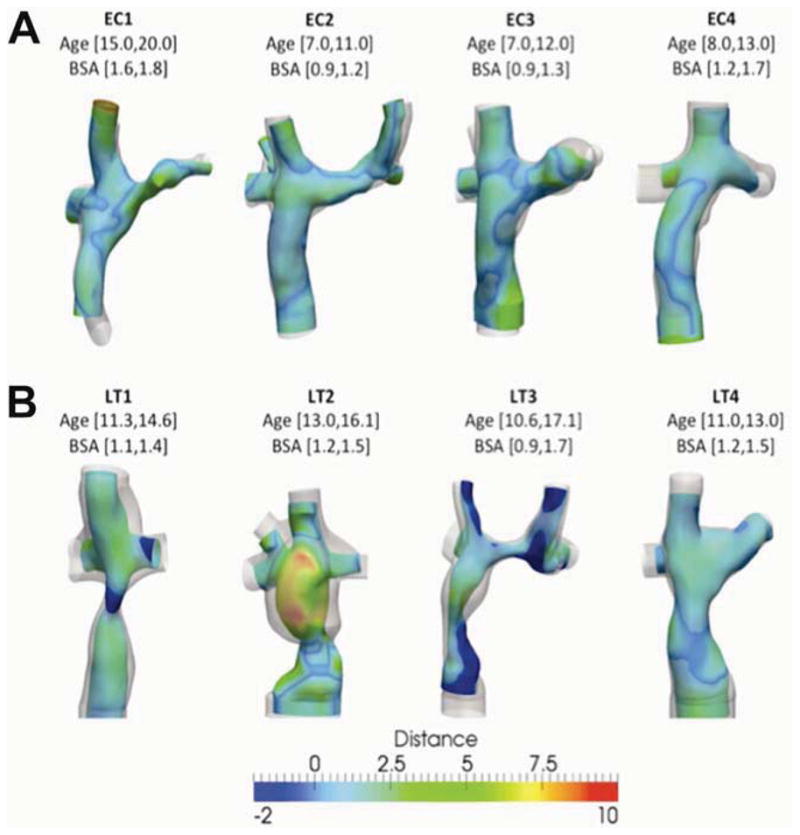
Results: Absolute LT pathway mean diameters increased over time for all but 2 patients; EC pathway size did not change (2.4 ± 2.2 mm vs 0.02 ± 2.1 mm, p < 0.05). Normalized LT and EC diameters decreased, while the size of the descending aorta increased proportionally to BSA. Growth of other cavopulmonary vessels varied. The patterns and extent of LT pathway growth were heterogeneous. Absolute flows for all vessels analyzed, except for the superior vena cava, proportionally to BSA.
Conclusions: Fontan pathway vessel diameter changes over time were not proportional to somatic growth but increases in pathway flows were; LT pathway diameter changes were highly variable. These factors may impact Fontan pathway resistance and hemodynamic efficiency. These findings provide further understanding of the different characteristics of LT and EC Fontan connections and set the stage for further investigation.
Copyright © 2014 The Society of Thoracic Surgeons. Published by Elsevier Inc. All rights reserved.
Figures
Comment in
-
Invited commentary.Ann Thorac Surg. 2014 Mar;97(3):922-3. doi: 10.1016/j.athoracsur.2014.01.016. Ann Thorac Surg. 2014. PMID: 24580909 No abstract available.
References
-
- de Leval MR, et al. Total cavopulmonary connection: a logical alternative to atriopulmonary connection for complex Fontan operations. Experimental studies and early clinical experience. J Thorac Cardiovasc Surg. 1988;96(5):682–95. - PubMed
-
- Stamm C, et al. Long-term results of the lateral tunnel Fontan operation. Journal of Thoracic and Cardiovascular Surgery. 2001;121(1):28–41. - PubMed
-
- Tokunaga S, et al. Total cavopulmonary connection with an extracardiac conduit: experience with 100 patients. Ann Thorac Surg. 2002;73(1):76–80. - PubMed
-
- Chowdhury UK, et al. Specific issues after extracardiac fontan operation: ventricular function, growth potential, arrhythmia, and thromboembolism. Ann Thorac Surg. 2005;80(2):665–72. - PubMed
-
- Khairy P, Poirier N. Is the extracardiac conduit the preferred Fontan approach for patients with univentricular hearts? The extracardiac conduit is not the preferred Fontan approach for patients with univentricular hearts. Circulation. 2012;126(21):2516–25. discussion 2525. - PubMed
Publication types
MeSH terms
Grants and funding
LinkOut - more resources
Full Text Sources
Other Literature Sources
Medical
