. 2014 Mar;52(100):86-97.
doi: 10.1016/j.cortex.2013.12.002. Epub 2013 Dec 17.

A brain basis for musical hallucinations

Affiliations

A brain basis for musical hallucinations

Sukhbinder Kumar et al. Cortex. 2014 Mar.

Abstract

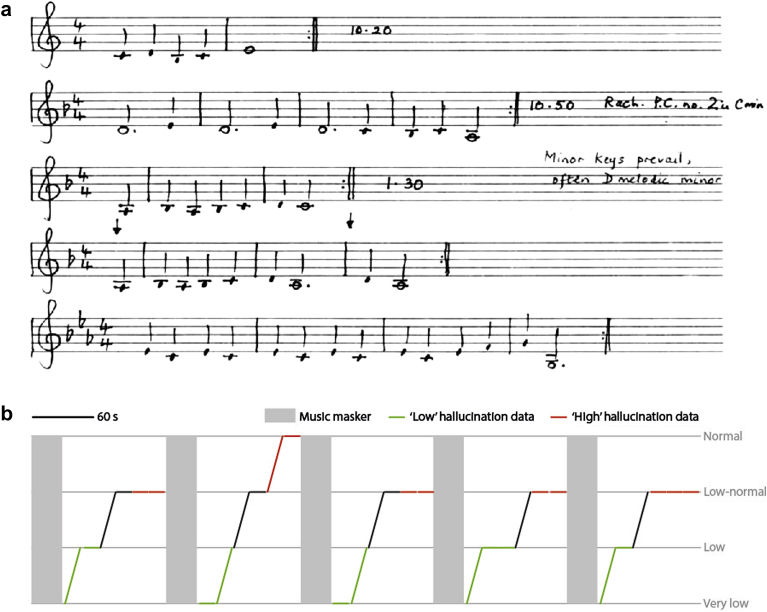
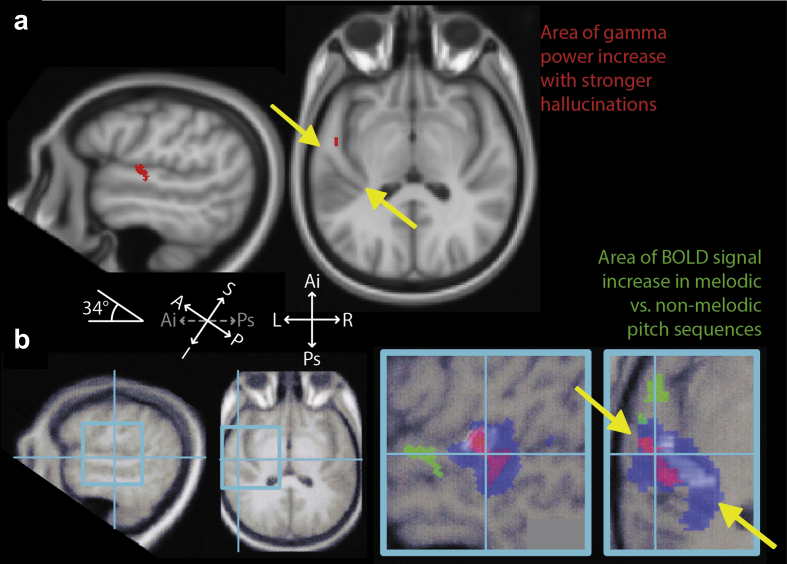
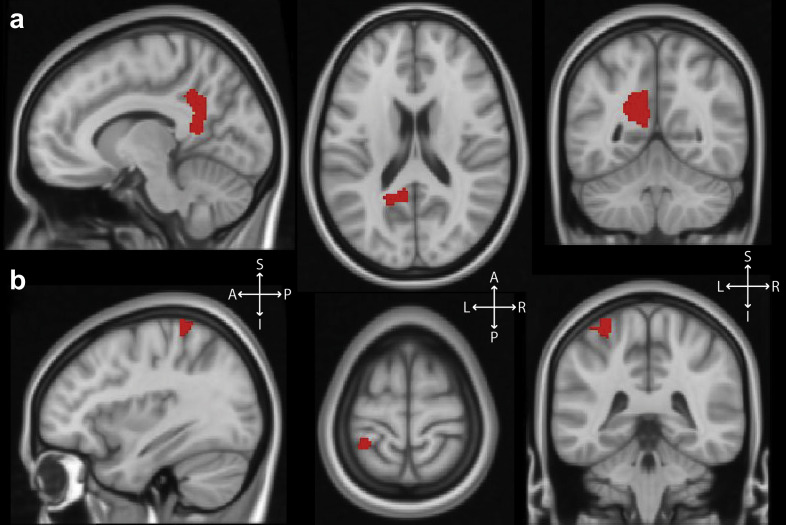
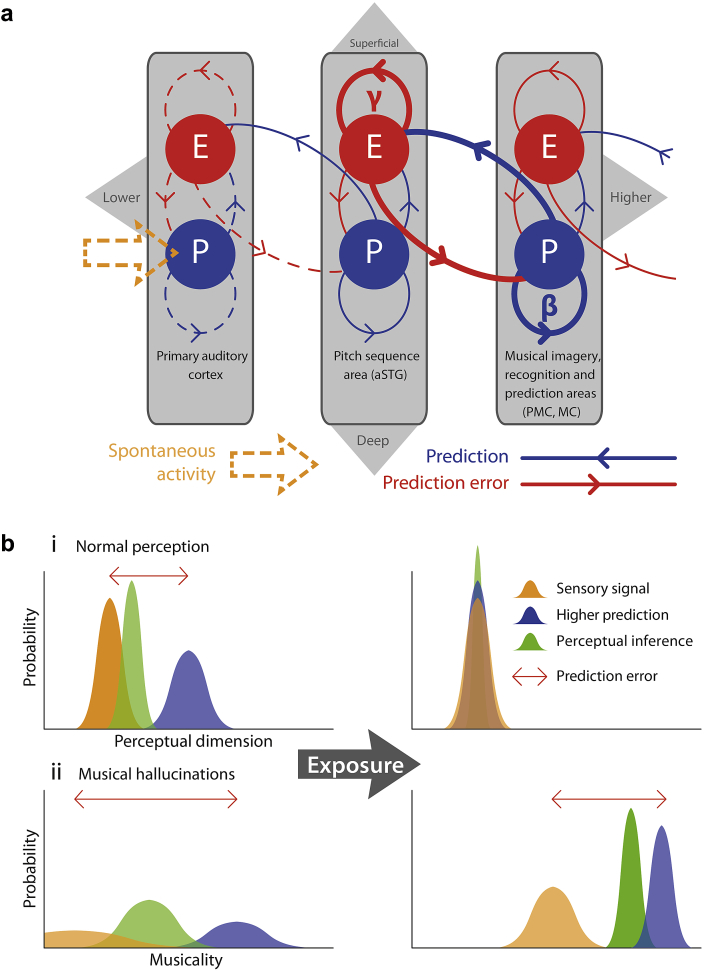
The physiological basis for musical hallucinations (MH) is not understood. One obstacle to understanding has been the lack of a method to manipulate the intensity of hallucination during the course of experiment. Residual inhibition, transient suppression of a phantom percept after the offset of a masking stimulus, has been used in the study of tinnitus. We report here a human subject whose MH were residually inhibited by short periods of music. Magnetoencephalography (MEG) allowed us to examine variation in the underlying oscillatory brain activity in different states. Source-space analysis capable of single-subject inference defined left-lateralised power increases, associated with stronger hallucinations, in the gamma band in left anterior superior temporal gyrus, and in the beta band in motor cortex and posteromedial cortex. The data indicate that these areas form a crucial network in the generation of MH, and are consistent with a model in which MH are generated by persistent reciprocal communication in a predictive coding hierarchy.

Keywords: Auditory cortex; Beta oscillations; Gamma oscillations; Magnetoencephalography; Musical hallucinations; Predictive coding.


Figures

Fig. 1
Fig. 1
Phenomenology of the subject's musical hallucinations. a: Musical notation, made by the subject, of hallucinations experienced on a typical day. Sequences of 2–4 bars in length are each repeated for periods of tens of minutes. The subject identified the second sequence as belonging to Rachmaninov's Piano Concerto number 2 in C minor. b: Residual inhibition paradigm used during the experiment, along with subjective ratings of hallucination intensity (grey lines and text). Over the course of the experiment (horizontal axis), 5 music maskers were played (grey rectangles) for 30 sec, each followed by 6 blocks of 15 sec of silence, before and after each of which the subject made a rating of her current hallucination intensity. Each block was therefore defined by its preceding and subsequent hallucination ratings, and is represented by a line in the figure. The 22 blocks whose MEG data were used for analysis are indicated by green or red lines, indicating their assignment to the ‘low’ or ‘high’ hallucination condition respectively.
Fig. 2
Fig. 2
Gamma band (30–60 Hz) oscillatory power increases, in a cortical area specialised for processing pitch sequences (anterior superior temporal gyrus; aSTG), associated with increased (high vs low) hallucination intensity. Heschl's gyrus, containing core auditory cortex, runs from posteromedial to anterolateral (ends denoted by yellow arrows), and aSTG is located anterior to its anterolateral end. a: Areas of significant gamma power increase surviving whole-brain correction (red areas) displayed on saggital (left) and axial (middle) sections, of a standard template MRI scan, with a 34° tilt applied. b: For comparison purposes, the results from a single typical subject from (Patterson et al., 2002) are shown (right) in equivalent tilted saggital and axial sections. The two plots on the left show the positions in the brain of the two enlarged regions on the right. The area responding selectively to melody is shown in green, falling precisely within aSTG, while blue and red areas indicate areas responding to noise and to the pitch of single notes respectively related to Heschl's Gyrus (shown in white). Abbreviations: S = superior, I = inferior, A = anterior, P = posterior, Ai = antero-inferior, Ps = postero-superior.
Fig. 3
Fig. 3
Beta band (14–30 Hz) oscillatory power increases (red areas) associated with increased (high vs low) hallucination intensity, displayed on saggital (left), axial (middle) and coronal (right) sections of a standard template MRI scan. a: Left posteromedial cortex, comprising a combination of posterior cingulate cortex, precuneus and retrosplenial cortex. b: Left primary motor cortex corresponding to the right arm/hand area. Abbreviations: S = superior, I = inferior, A = anterior, P = posterior, L = left, R = right.
Fig. 4
Fig. 4
Predictive coding model of musical hallucinations. (a) Neural architecture of proposed model. Three levels of a cortical hierarchy for music processing are depicted (primary auditory cortex, aSTG and PMC/MC in order of lower to higher). Each cortical area comprises prediction error (E) populations in the superficial layers which oscillate at gamma frequencies, and prediction (P) populations in the deep cortical layers which oscillate at beta frequencies. Bi-directional communication occurs between P and E populations within each level and between each pair of adjacent levels. Thicker lines represent more precise predictions and predictions errors, which constitute the fundamental hallucinatory circuit, while dashed lines represent imprecise activity driven by spontaneous noise-like input from sub-cortical pathways. aSTG = anterior superior temporal gyrus. PMC = posteromedial cortex. MC = motor cortex. (b) Schematic of Bayesian inference (i) normal perception. The left panel illustrates the state of the system at stimulus onset, with a relatively precise sensory signal, a less precise prediction and a prediction error due to incongruence between these. The right panel illustrates the system after a short interval (∼100 msec), during which the higher prediction has been modified to become congruent with the sensory signal and more precise. The perceptual inference is therefore veridical (ii) Bayesian inference in musical hallucinations. The left panel shows the state of the system when hallucinations are low in intensity. Imprecise SA with relatively high precision top-down prediction is combined to infer a weak musical percept. After reinforcement, the top-down prediction becomes more precise (right panel) and therefore a strong percept of music (hallucinations) is inferred.

References

    1. Arnal L.H., Wyart V., Giraud A.-L. Transitions in neural oscillations reflect prediction errors generated in audiovisual speech. Nature Neuroscience. 2011;14:797–801. - PubMed
    1. Auger S.D., Mullally S.L., Maguire E.A. Retrosplenial cortex codes for permanent landmarks. PloS One. 2012;7:e43620. - PMC - PubMed
    1. Bailes F. The prevalence and nature of imagined music in the everyday lives of music students. Psychology of Music. 2007;35:555–570.
    1. Bastos A.M., Usrey W.M., Adams R.A., Mangun G.R., Fries P., Friston K.J. Canonical microcircuits for predictive coding. Neuron. 2012;76:695–711. - PMC - PubMed
    1. Beaman C.P., Williams T.I. Earworms (stuck song syndrome): towards a natural history of intrusive thoughts. British Journal of Psychology. 2010;101:637–653. - PubMed

Publication types