. 2014 Apr 1;592(7):1687-703.
doi: 10.1113/jphysiol.2013.265843. Epub 2014 Jan 20.

Adult spinal motoneurones are not hyperexcitable in a mouse model of inherited amyotrophic lateral sclerosis

Affiliations

Adult spinal motoneurones are not hyperexcitable in a mouse model of inherited amyotrophic lateral sclerosis

Nicolas Delestrée et al. J Physiol. .

Abstract

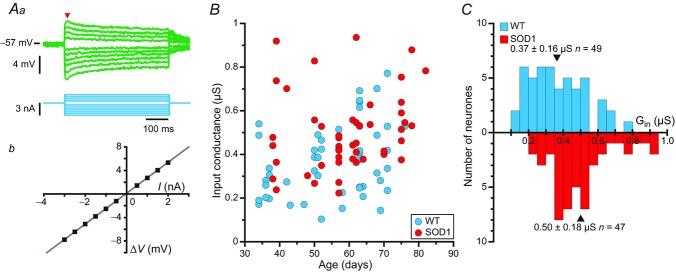
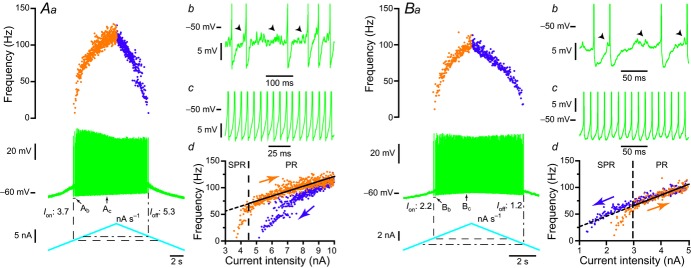
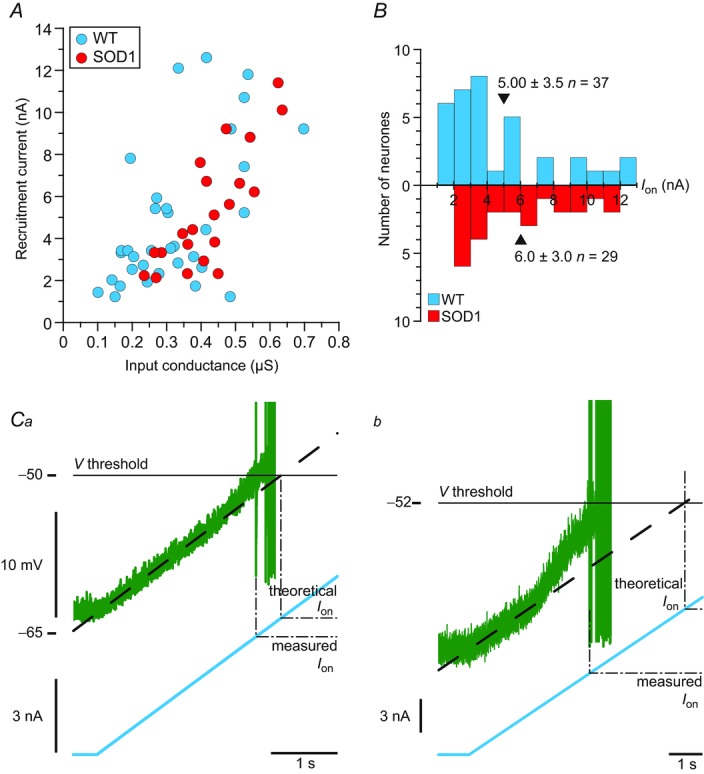
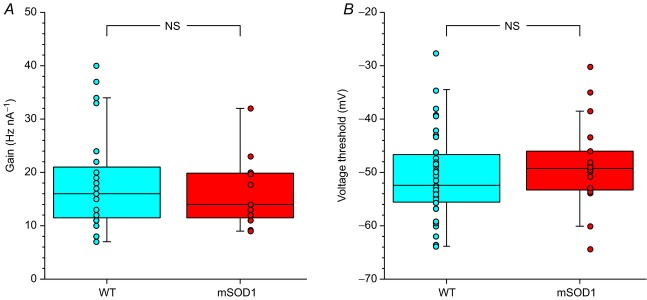
In amyotrophic lateral sclerosis (ALS), an adult onset disease in which there is progressive degeneration of motoneurones, it has been suggested that an intrinsic hyperexcitability of motoneurones (i.e. an increase in their firing rates), contributes to excitotoxicity and to disease onset. Here we show that there is no such intrinsic hyperexcitability in spinal motoneurones. Our studies were carried out in an adult mouse model of ALS with a mutated form of superoxide dismutase 1 around the time of the first muscle fibre denervations. We showed that the recruitment current, the voltage threshold for spiking and the frequency-intensity gain in the primary range are all unchanged in most spinal motoneurones, despite an increased input conductance. On its own, increased input conductance would decrease excitability, but the homeostasis for excitability is maintained due to an upregulation of a depolarizing current that is activated just below the spiking threshold. However, this homeostasis failed in a substantial fraction of motoneurones, which became hypoexcitable and unable to produce sustained firing in response to ramps of current. We found similar results both in lumbar motoneurones recorded in anaesthetized mice, and in sacrocaudal motoneurones recorded in vitro, indicating that the lack of hyperexcitability is not caused by anaesthetics. Our results suggest that, if excitotoxicity is indeed a mechanism leading to degeneration in ALS, it is not caused by the intrinsic electrical properties of motoneurones but by extrinsic factors such as excessive synaptic excitation.


Figures

Figure 1
Figure 1
Aa, average responses of a mSOD1 motoneurone (top traces; each trace is an average of five sweeps) to a series of current pulses (bottom traces) lasting 500 ms and ranging from −3 to +2 nA. Notice the sag on the voltage response of the motoneurone: the voltage rapidly reached a peak, before stabilizing to a lower plateau value. Ab, plot of the deflection of the voltage (ΔV, measured at the peak of the response, arrowhead in Aa) versus the intensity of the current pulse. B, plot of the input conductances of WT and mSOD1 motoneurones versus the age of the mice. C, distribution of the input conductances (Gin) of WT (top) and mSOD1 (bottom) motoneurones. In each histogram, arrowheads mark the position of the mean. mSOD1, mutant superoxide dismutase 1; WT, wild-type.
Figure 2
Figure 2
A, clockwise response of an mSOD1 motoneurone to a slow ramp (1 nA s−1) of current. Aa, slow current ramp (bottom trace), voltage response (middle trace) and instantaneous firing frequency (top plot). The onset of the discharge is shown by the vertical dashed line (Ion, 3.7 nA) while the current of de-recruitment (Ioff, 5.3 nA) is indicated by the vertical dash-dotted line. Ab, magnification of the voltage trace at the recruitment (region indicated in Aa). Spikes have been truncated to highlight the high-frequency oscillations (arrowheads) that appeared in the interspike intervals. Note the firing variability that characterizes the SPR. Ac, magnification of the region indicated in Aa. Increasing the injected current resulted in a PR without oscillation between spikes and with less variability. Ad, plot of the instantaneous firing frequency versus the intensity of the injected current for the ascending and descending branches of the ramp shown in Aa. Note that this FI relationship displayed a clockwise hysteresis. Vertical dashed line indicates the transition between the SPR and the PR on the ascending branch. The gain of the FI curve can be estimated by the slope of the linear regression (continuous line) in the PR. B, counter-clockwise behaviour of another mSOD1 motoneurone in response to a slow ramp (1 nA s−1) of current. Ba, same organization as in Aa. Note that, in this motoneurone, the de-recruitment current (Ioff, 1.2 nA) is lower than the recruitment current (Ion, 2.2 nA). Bb, magnification of the voltage trace at recruitment (region indicated in Ba). High-frequency voltage oscillations (arrowheads) were present between spikes as for the motoneurone illustrated in A. Bc, magnification of region indicated in Ba. Bd, same organization as in Ad. Note that the FI relationship of this motoneurone displayed counter-clockwise hysteresis. PR, primary range; mSOD1, mutant superoxide dismutase 1; SPR, subprimary range.
Figure 3
Figure 3
A, plot of the recruitment current of WT and mSOD1 motoneurones versus input conductance. B, distributions of recruitment current of WT and mSOD1 motoneurones. The mean values are indicated by arrowheads. C, magnification of the voltage (top trace) and current (bottom trace) near the recruitment of a WT (Ca) and mSOD1 (Cb) motoneurone (the mSOD1 motoneurone is the one illustrated in Fig. 2A). Ion is measured as the current intensity at which the motoneurone fires the first spike (‘measured Ion’, dashed line), while the ‘theoretical Ion’ is the current intensity that would be needed to reach the same voltage threshold if the membrane was purely passive (dot-dashed line). mSOD1, mutant superoxide dismutase 1; WT, wild-type.
Figure 4
Figure 4
A, box-and-whisker diagram and data points of the distribution of the gain (measured in the primary range) of WT and mSOD1 motoneurones. B, box-and-whisker diagram and data points of the distribution of the voltage threshold of WT and mSOD1 motoneurones. In both diagrams, the central box represents the values from the lower to upper quartile (25–75th percentile). The middle line represents the median. The vertical line extends to the minimum and maximum values that fall within 1.5 times the interquartile distance. mSOD1, mutant superoxide dismutase 1; NS, not significant; WT, wild-type.
Figure 5
Figure 5
A, example of an mSOD1 motoneurone that fired only a few spikes in response to slow current ramps. Aa, current ramp (bottom trace) and voltage response (top trace). Ab, this motoneurone was nevertheless able to fire single spikes (middle trace) in response to a train of brief current pulses (bottom trace) and its neuromuscular junction was still functional, as shown by the fact that electromyography activity (top trace) was consistently observed following each spike (inset: superposition of all the electromyography sweeps showing very little variability). B, example of an mSOD1 motoneurone that was unable to fire any spike in response to slow current ramps. Ba, current ramp (bottom trace) and voltage response (top trace). Bb, this motoneurone was nevertheless able to fire a single spike (top trace) in response to a brief pulse of current (bottom trace). mSOD1, mutant superoxide dismutase 1.
Figure 6
Figure 6
A, distribution of input conductance (Gin) for different categories of WT (top) and mSOD1 (bottom) motoneurones aged between 34 and 82 days old. Solid bars correspond to motoneurones that were able to produce sustained firing, hatched bars correspond to motoneurones that fired only a few spikes, and crosshatched bars correspond to motoneurones unable to fire any spike during ramps of current. Pie charts indicate the proportions of each category among our population of WT (top pie chart) and mSOD1 (bottom pie chart) motoneurones. B, same organization as in A for a time window restricted to P34–P60. mSOD1, mutant superoxide dismutase 1; WT, wild-type.
Figure 7
Figure 7
Traces were smoothed using a 10 ms window, aligned to the first spike (asterisk) and scaled so that the passive voltage trajectory (dashed line) was the same in all traces. The top trace corresponds to a mutant superoxide dismutase 1 motoneurone that was able to produce repetitive firing (same motoneurone as in Figs 2A and 3Cb), the middle trace is from a wild-type motoneurone (same motoneurone as in Fig. 3Ca), and the bottom trace is from the motoneurone in Fig. 5Aa.
Figure 8
Figure 8
Aa, voltage response (top traces) to a series of subthreshold current pulses (bottom traces). Each trace is the average of five sweeps. Ab, plot of the voltage deviation (ΔV) measured at the peak of the response (arrowhead in Aa) versus the intensity of the current pulse, used to estimate the input conductance of the cell. Ac, histogram of the input conductances (Gin) of WT (top histogram) and mSOD1 (bottom histogram) sacrocaudal motoneurones. The mean values are indicated by arrowheads. B, example of a sacrocaudal WT motoneurone that was able to sustain a repetitive discharge in response to a stationary stimulus. Ba, response (top trace) to a slow current ramp. The dashed lines indicate the onset and de-recruitment currents. Bb, FI relationship of that motoneurone. Note that it displayed a clockwise hysteresis. C, example of a sacrocaudal mSOD1 motoneurone that was unable to produce sustained firing in response to stationary stimuli. Ca, this motoneurone was unable to fire a single spike (top trace) in response to a slow ramp of current (bottom trace). Cb, this motoneurone was nevertheless able to fire at most a doublet of spikes (top trace) at the onset of a square pulse (bottom trace). D, input conductances (Gin) of sacrocaudal motoneurones that fired (solid bars) or that failed to fire (crosshatched bars) during ramps in WT and mSOD1 mice. Pie charts indicate the proportions of each category among our population of WT (top pie chart) and mSOD1 (bottom pie chart) motoneurones. mSOD1, mutant superoxide dismutase 1; WT, wild-type.

Similar articles

Cited by

References

    1. Alves CJ, de Santana LP, dos Santos AJ, de Oliveira GP, Duobles T, Scorisa JM, Martins RS, Maximino JR, Chadi G. Early motor and electrophysiological changes in transgenic mouse model of amyotrophic lateral sclerosis and gender differences on clinical outcome. Brain Res. 2011;1394:90–104. - PubMed
    1. Bellingham MC. A review of the neural mechanisms of action and clinical efficiency of riluzole in treating amyotrophic lateral sclerosis: what have we learned in the last decade. CNS Neurosci Ther. 2011;17:4–31. - PMC - PubMed
    1. Bennett DJ, Li Y, Siu M. Plateau potentials in sacrocaudal motoneurons of chronic spinal rats, recorded in vitro. J Neurophysiol. 2001;86:1955–1971. - PubMed
    1. Bories C, Amendola J, Lamotte d’Incamps B, Durand J. Early electrophysiological abnormalities in lumbar motoneurons in a transgenic mouse model of amyotrophic lateral sclerosis. Eur J Neurosci. 2007;25:451–459. - PubMed
    1. Bouhadfane M, Tazerart S, Moqrich A, Vinay L, Brocard F. Sodium-mediated plateau potentials in lumbar motoneurons of neonatal rats. J Neurosci. 2013;33:15626–15641. - PMC - PubMed

Publication types

LinkOut - more resources