. 2014 Mar 15;592(6):1249-66.
doi: 10.1113/jphysiol.2013.264929. Epub 2014 Jan 20.

Vasoactive agonists exert dynamic and coordinated effects on vascular smooth muscle cell elasticity, cytoskeletal remodelling and adhesion

Affiliations

Vasoactive agonists exert dynamic and coordinated effects on vascular smooth muscle cell elasticity, cytoskeletal remodelling and adhesion

Zhongkui Hong et al. J Physiol. .

Abstract

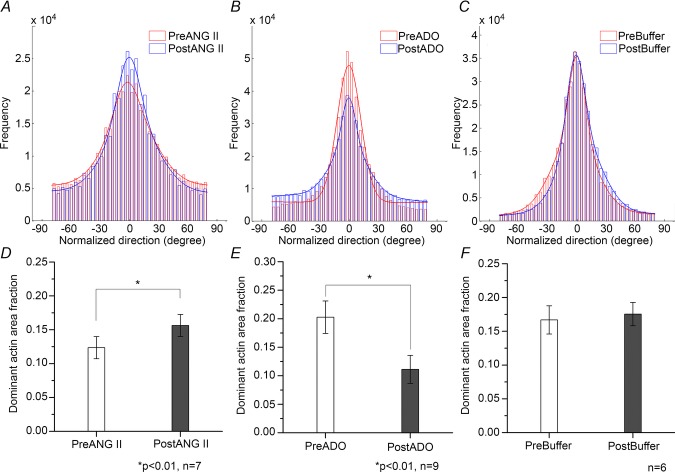
In this study, we examined the ability of vasoactive agonists to induce dynamic changes in vascular smooth muscle cell (VSMC) elasticity and adhesion, and tested the hypothesis that these events are coordinated with rapid remodelling of the cortical cytoskeleton. Real-time measurement of cell elasticity was performed with atomic force microscopy (AFM) and adhesion was assessed with AFM probes coated with fibronectin (FN). Temporal data were analysed using an Eigen-decomposition method. Elasticity in VSMCs displayed temporal oscillations with three components at approximately 0.001, 0.004 and 0.07 Hz, respectively. Similarly, adhesion displayed a similar oscillatory pattern. Angiotensin II (ANG II, 10(-6) M) increased (+100%) the amplitude of the oscillations, whereas the vasodilator adenosine (ADO, 10(-4) M) reduced oscillation amplitude (-30%). To test whether the oscillatory changes were related to the architectural alterations in cortical cytoskeleton, the topography of the submembranous actin cytoskeleton (100-300 nm depth) was acquired with AFM. These data were analysed to compare cortical actin fibre distribution and orientation before and after treatment with vasoactive agonists. The results showed that ANG II increased the density of stress fibres by 23%, while ADO decreased the density of the stress fibres by 45%. AFM data were supported by Western blot and confocal microscopy. Collectively, these observations indicate that VSMC cytoskeletal structure and adhesion to the extracellular matrix are dynamically altered in response to agonist stimulation. Thus, vasoactive agonists probably invoke unique mechanisms that dynamically alter the behaviour and structure of both the VSMC cytoskeleton and focal adhesions to efficiently support the normal contractile behaviour of VSMCs.


Figures

Figure 1
Figure 1
The top panel illustrates the raw data for E-modulus during the pre-drug treatment period (A), post-ANG II treatment (B), and post-ADO treatment (C). ANG II treatment increased oscillation amplitude and ADO decreased the oscillation amplitude. Rows 2–4 illustrate the three oscillation components isolated using an Eigen-decomposition method: pre-drug period (D, G and J), 20 min post-ANG II treatment (E, H and K), and 20 min post-ADO treatment (F, I and L). F* and A* indicate that the frequency and amplitude of the component were significantly different from pre-drug period or vehicle control experiment, P < 0.05.
Figure 2
Figure 2
The top panel displays the time series of raw adhesion data for pre-drug period (A), post-ANG II treatment (B), and post-ADO treatment (C). ANG II treatment increased the oscillation amplitude and ADO decreased the oscillation amplitude. Rows 2–4 illustrate the three components isolated using an Eigen-decomposition method: pre-drug period (D, G and J), 20 min post-ANG II treatment (E, H and K), and 20 min post-ADO treatment (F, I and L).
Figure 3
Figure 3
Oscillation periods are summarized for the various oscillation components. The oscillation period for component 1 of adhesion had the same mean value as component 2 of the E-modulus, indicated as group I, and component 2 of adhesion and component 3 of the E-modulus are in the same oscillation period, indicated as group II.
Figure 4
Figure 4
A and B display the cell height image for pre-and 20 min post-ANG II treatment period, respectively. C and D show the cell height image for pre-and 20 min post-ADO treatment period, respectively. The upper left panel for each group of panels illustrates the phase contrast image for the cell that was subjected to AFM probe scanning, in which the yellow square shows the maximal accessible area for the AFM probe and the blue square shows the area that was experimentally scanned for the height image acquisition. The upper right panel of each group was the cell height image (40 μm × 40 μm). Acquisition of the height image was conducted at 0.4 Hz frequency and it took approximately 25 min to obtain a cell topography image with 512 × 512 pixels in digital size. The red line in the lower panel in each group is a height cross-section of the cell surface along the line indicated for the corresponding height images of each group.
Figure 5
Figure 5
Acquisition of the deflection image was conducted at 0.4 Hz. The deflection signal and height signal were recorded simultaneously at the same individual scanning in contact mode. The deflection image was subdivided into 250 × 250 sub-regions, and each sub-region was 2 pixels × 2 pixels in size. The actin stress fibre orientation and density of each sub-region was analysed with a MATLAB image processing methodology developed in this study. A, raw deflection image for the pre-ANG II treatment period. B, pseudo-colour map for the orientation of each sub-region in the entire deflection image. The different colours represent the different directions/angles of actin stress fibre in the sub-regions. C, histogram of total actin stress fibre orientation in sub-regions over entire deflection image for the pre-ANG II treatment period. The orientation of each sub-region is the normalized angle of fibre direction. The dominant direction over the entire image was arbitrarily considered as 0 deg. D, black–white image for the dominant orientation of the stress fibre. The white area stands for the dominant sub-region, in which the fibre orientation was in the range of ±10 deg. E, F, G and H represent the images for the 20 min post-ANG II treatment period and all images were obtained by the same criteria as described for the corresponding panels in the pre-ANG II treatment period.
Figure 6
Figure 6
A, B, C and D represent the images for the pre-ADO treatment period. E, F, G and H display the images for the 20 min post-ADO treatment period. All of the images were obtained by the same criteria as described for the corresponding panels in the ANG II experiment (Fig. 5).
Figure 7
Figure 7
A, histogram of the orientation distribution for the pre-ANG II treatment period and post-ANG II treatment. B, histogram of the orientation distribution for the pre-ADO treatment period and post-ADO treatment. C, histogram of the orientation distribution for the pre-vehicle treatment period and post-vehicle treatment. D, the actin stress fibre area fraction of the sub-regions in height images between the pre-and post-ANG II treatment (n = 7, *P < 0.01). E, the actin stress fibre area fraction of the sub-regions in height images between the pre-and post-ADO treatment (n = 9, *P < 0.01). F, the actin stress fibre area fraction of the sub-regions in height images between the pre-and post-vehicle buffer treatment (n = 6, *P > 0.05). These three bar graphs only summarize the sub-regions of the height images in which the pixel orientations were within the range of ±10 deg in the deflection image.
Figure 8
Figure 8
A, representative Western blot result. The G/F ratio of α-actin was increased by stimulation with ADO from 22/78 to 31/69 in this individual experiment. B, summarized group data showed the statistically increased G component in the actin cytoskeleton. *P < 0.05, n = 5. LAT-A and JSP were used as negative and positive controls, respectively.
Figure 9
Figure 9
A, GFP-tagged F-actin before ANG II treatment. B, GFP-tagged F-actin 30 min after ANG II treatment. C and D, the fluorescent confocal images were analysed with MATLAB to detect the orientation of stress fibre for the pre-and post-ANG II treatment, respectively. The 1–180 deg of orientation angle of stress fibre was homogeneously subdivided into 15 orientation angles with a step of 12 deg. The different colours represent the different orientations of actin stress fibres. E, GFP-tagged F-actin before ADO treatment. F, GFP-tagged F-actin 30 min after ADO treatment. Confocal image demonstrates the slight changes in F-actin architecture induced by ANG II treatment and the depolymerization of actin stress fibre resulting from administration of ADO in the cell bath. G and H, the respective orientation plots, where the different colours represent the different orientation of actin stress fibres. Scale bars in A, B, E and F are 20 μm.
None
The surface actin stress fibre structure was obtained by detecting the top 200 nm depth of fluorescence signal from confocal Z-stacks with a MATLAB image processing method. A and B, the height images of the surface fluorescence signal for a control cell and 30 min after ANG II treatment. These images were obtained by analysing the raw confocal images without fibre filtering (Fig. 9A and B). C and D, the height images of the surface actin stress fibres for a control cell and 30 min after ANG II treatment. These images were obtained by analysing the filtered confocal images for fibrous structure. E and F, the height images of the surface fluorescence signal for a control cell and 30 min after ADO treatment. G and H, the height image of the surface actin stress fibre for a control cell and 30 min after ADO treatment. The height values range from low (blue, green) to high (yellow, red). The axis unit is μm.

Comment in

  • Restless cell syndrome.
    Schillers H. Schillers H. J Physiol. 2014 Mar 15;592(6):1175-6. doi: 10.1113/jphysiol.2014.271759. J Physiol. 2014. PMID: 24634017 Free PMC article. No abstract available.

Similar articles

Cited by

References

    1. Adams DS. Mechanisms of cell shape change: the cytomechanics of cellular response to chemical environment and mechanical loading. J Cell Biol. 1992;117:83–93. - PMC - PubMed
    1. Butt H-J, Jaschke M. Calculation of thermal noise in atomic force microscopy. Nanotechnology. 1995;6:7.
    1. Costa KD. Single-cell elastography: probing for disease with the atomic force microscope. Dis Markers. 2003;19:139–154. - PMC - PubMed
    1. De Deyne PG. Application of passive stretch and its implications for muscle fibres. Phys Ther. 2001;81:819–827. - PubMed
    1. Dowling EP, Ronan W, Ofek G, Deshpande VS, McMeeking RM, Athanasiou KA, McGarry JP. The effect of remodelling and contractility of the actin cytoskeleton on the shear resistance of single cells: a computational and experimental investigation. J R Soc Interface. 2012;9:3469–3479. - PMC - PubMed

Publication types

MeSH terms

LinkOut - more resources