

A genetic map of Peromyscus with chromosomal assignment of linkage groups (a Peromyscus genetic map)
- PMID: 24445420
- PMCID: PMC3961507
- DOI: 10.1007/s00335-014-9500-8
A genetic map of Peromyscus with chromosomal assignment of linkage groups (a Peromyscus genetic map)
Abstract
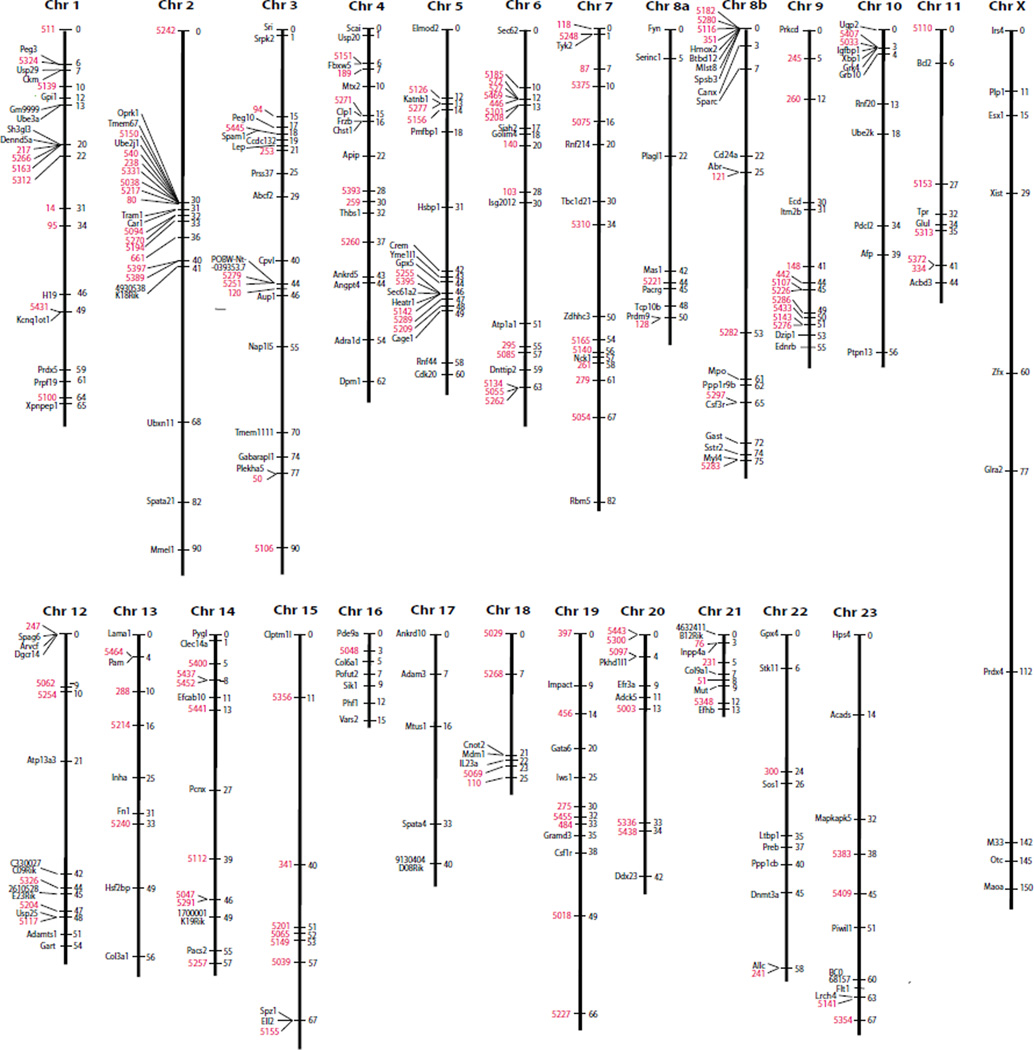
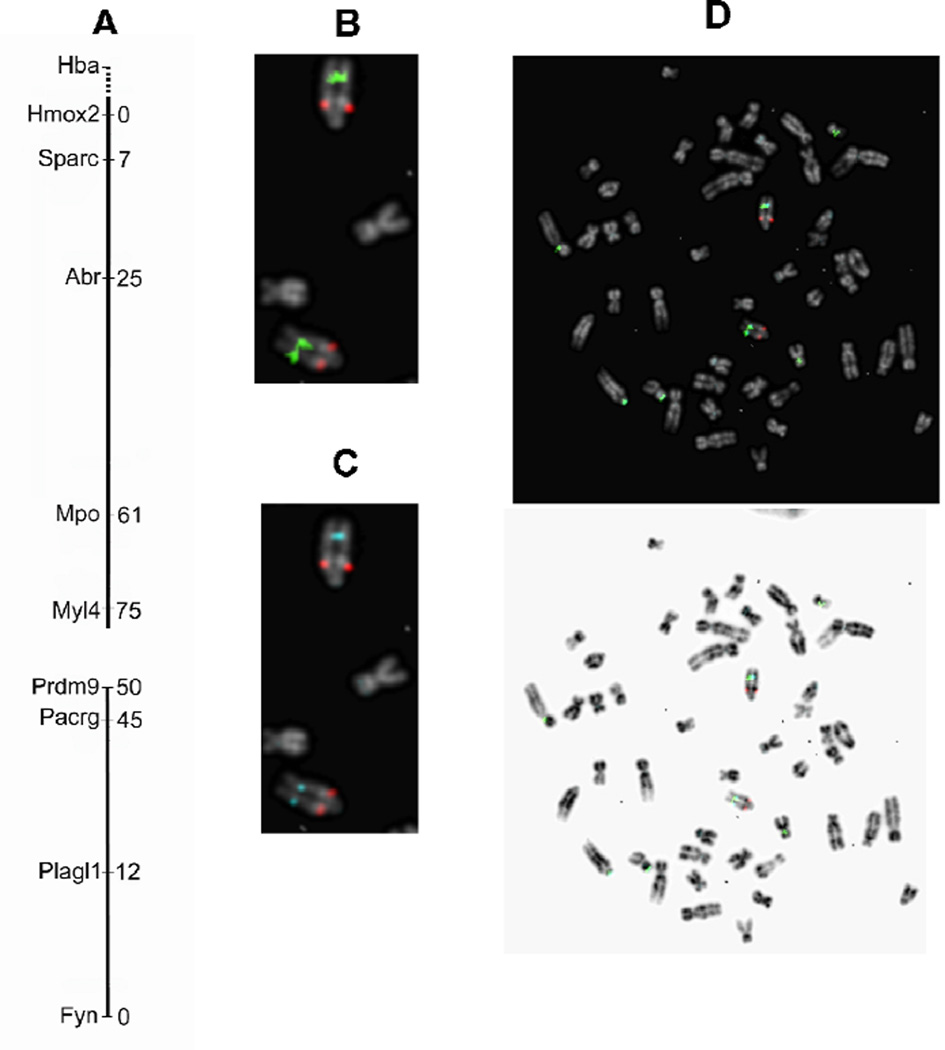
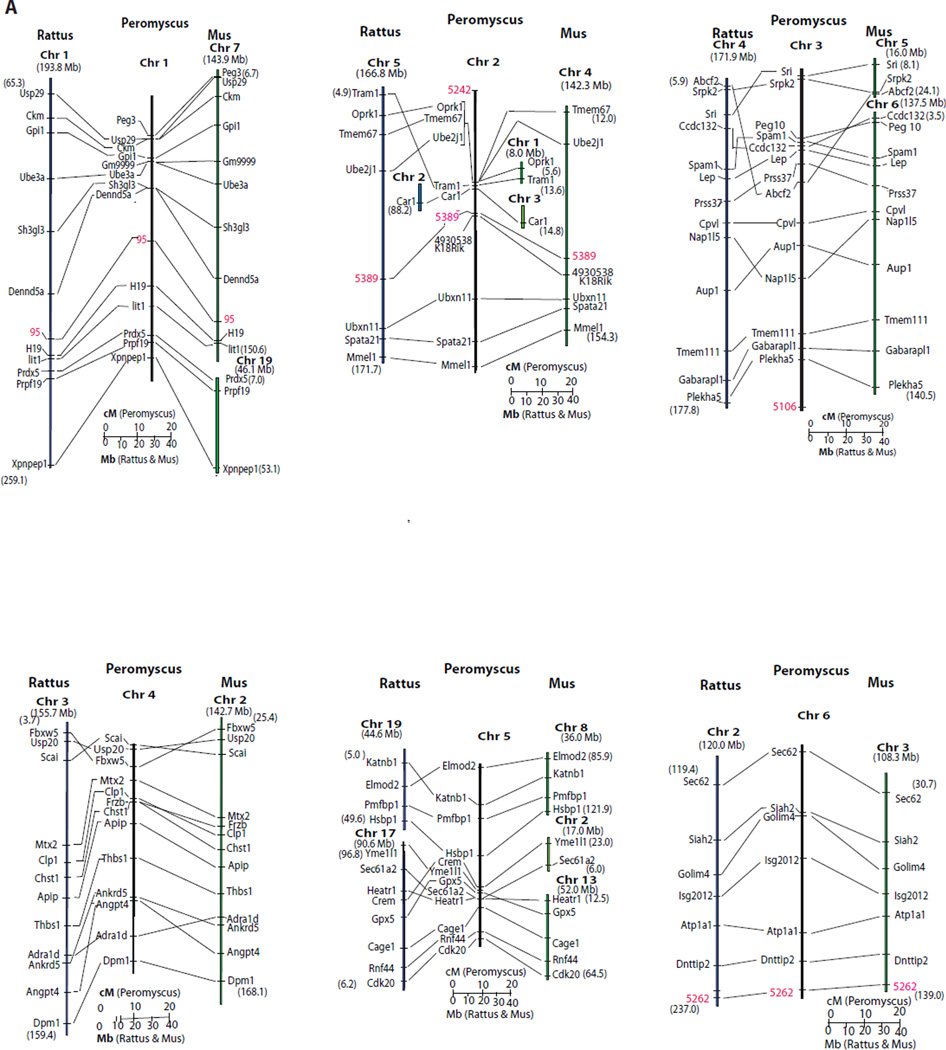
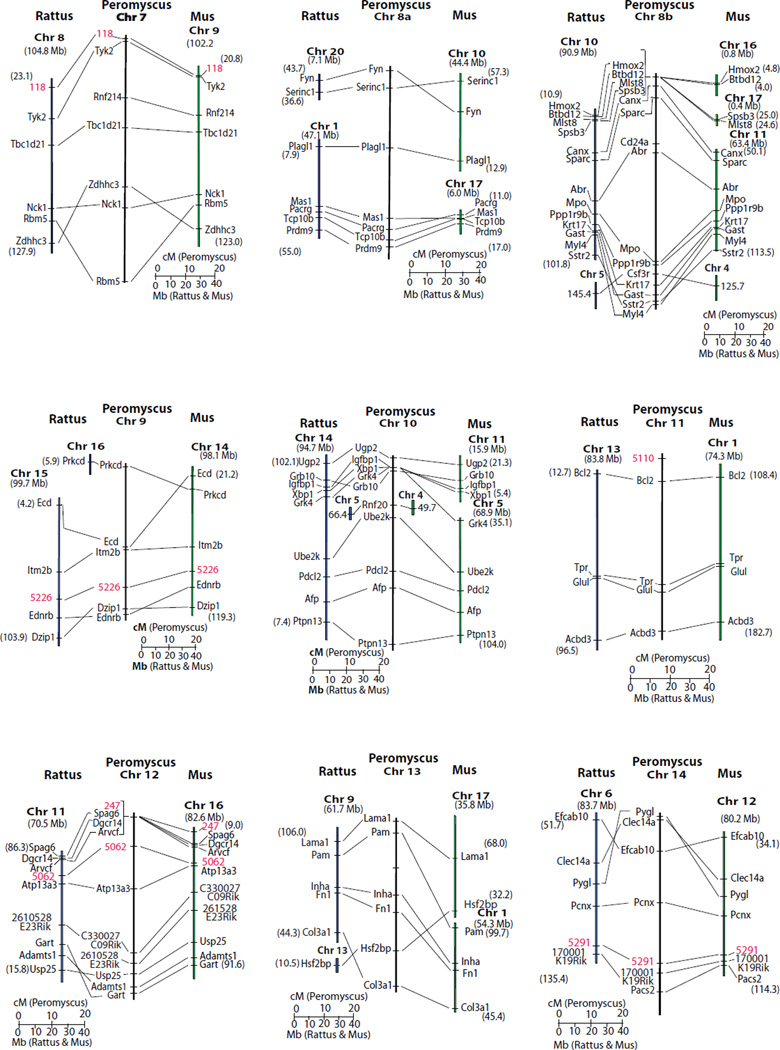
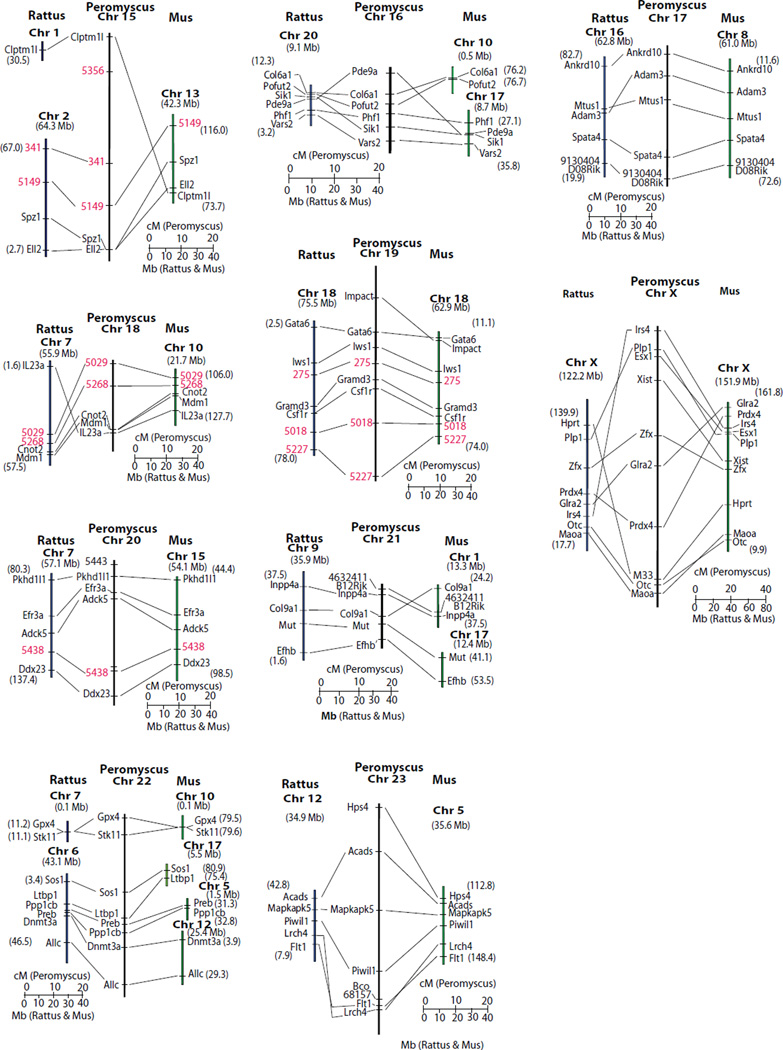
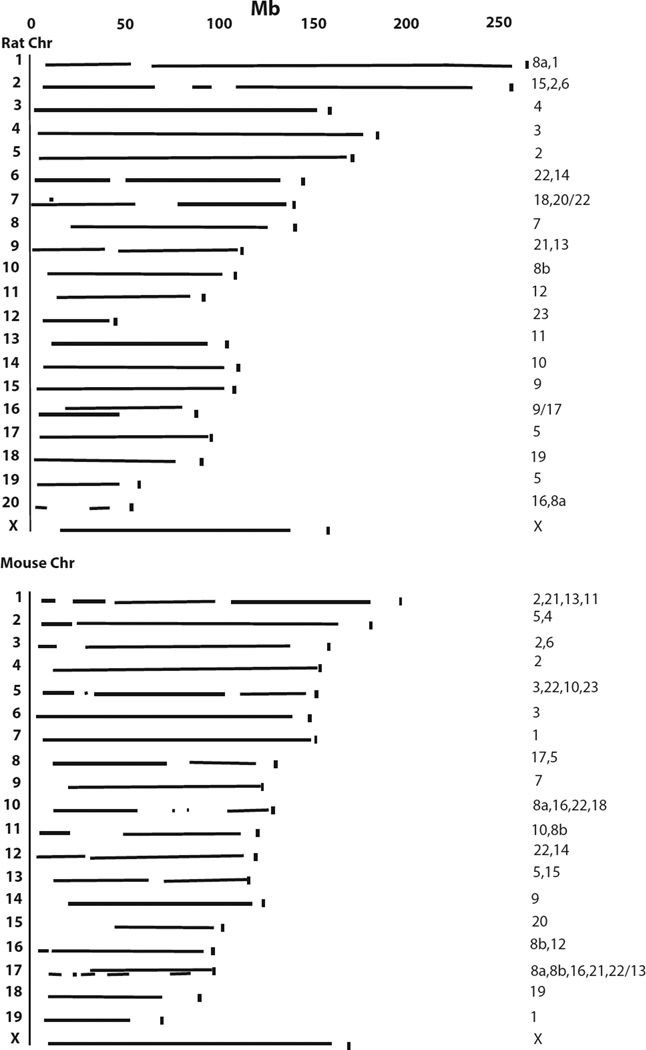
The rodent genus Peromyscus is the most numerous and species-rich mammalian group in North America. The naturally occurring diversity within this genus allows opportunities to investigate the genetic basis of adaptation, monogamy, behavioral and physiological phenotypes, growth control, genomic imprinting, and disease processes. Increased genomic resources including a high quality genetic map are needed to capitalize on these opportunities. We produced interspecific hybrids between the prairie deer mouse (P. maniculatus bairdii) and the oldfield mouse (P. polionotus) and scored meiotic recombination events in backcross progeny. A genetic map was constructed by genotyping of backcross progeny at 185 gene-based and 155 microsatellite markers representing all autosomes and the X-chromosome. Comparison of the constructed genetic map with the molecular maps of Mus and Rattus and consideration of previous results from interspecific reciprocal whole chromosome painting allowed most linkage groups to be unambiguously assigned to specific Peromyscus chromosomes. Based on genomic comparisons, this Peromyscus genetic map covers ~83% of the Rattus genome and 79% of the Mus genome. This map supports previous results that the Peromyscus genome is more similar to Rattus than Mus. For example, coverage of the 20 Rattus autosomes and the X-chromosome is accomplished with only 28 segments of the Peromyscus map, but coverage of the 19 Mus autosomes and the X-chromosome requires 40 chromosomal segments of the Peromyscus map. Furthermore, a single Peromyscus linkage group corresponds to about 91% of the rat and only 76% of the mouse X-chromosomes.
Figures
Similar articles
-
An updated genetic map of Peromyscus with chromosomal assignment of linkage groups.Mamm Genome. 2018 Jun;29(5-6):344-352. doi: 10.1007/s00335-018-9754-7. Epub 2018 Jun 15. Mamm Genome. 2018. PMID: 29947964
-
Development of a deer mouse whole-genome radiation hybrid panel and comparative mapping of Mus chromosome 11 loci.Mamm Genome. 2006 Jan;17(1):37-48. doi: 10.1007/s00335-005-0051-x. Epub 2006 Jan 13. Mamm Genome. 2006. PMID: 16416089
-
Comparative genome mapping of the deer mouse (Peromyscus maniculatus) reveals greater similarity to rat (Rattus norvegicus) than to the lab mouse (Mus musculus).BMC Evol Biol. 2008 Feb 26;8:65. doi: 10.1186/1471-2148-8-65. BMC Evol Biol. 2008. PMID: 18302785 Free PMC article.
-
Peromyscus (deer mice) as developmental models.Wiley Interdiscip Rev Dev Biol. 2014 May-Jun;3(3):211-30. doi: 10.1002/wdev.132. Epub 2013 Dec 3. Wiley Interdiscip Rev Dev Biol. 2014. PMID: 24896658 Review.
-
Current status of the river buffalo (Bubalus bubalis L.) gene map.J Hered. 2001 May-Jun;92(3):221-5. doi: 10.1093/jhered/92.3.221. J Hered. 2001. PMID: 11447236 Review.
Cited by
-
An updated genetic map of Peromyscus with chromosomal assignment of linkage groups.Mamm Genome. 2018 Jun;29(5-6):344-352. doi: 10.1007/s00335-018-9754-7. Epub 2018 Jun 15. Mamm Genome. 2018. PMID: 29947964
-
Hematologic and serum biochemical values of 4 species of Peromyscus mice and their hybrids.J Am Assoc Lab Anim Sci. 2014 Jul;53(4):336-43. J Am Assoc Lab Anim Sci. 2014. PMID: 25199088 Free PMC article.
-
Pleiotropic effects of a methyl donor diet in a novel animal model.PLoS One. 2014 Aug 14;9(8):e104942. doi: 10.1371/journal.pone.0104942. eCollection 2014. PLoS One. 2014. PMID: 25121505 Free PMC article.
-
The genome of Peromyscus leucopus, natural host for Lyme disease and other emerging infections.Sci Adv. 2019 Jul 24;5(7):eaaw6441. doi: 10.1126/sciadv.aaw6441. eCollection 2019 Jul. Sci Adv. 2019. PMID: 31355335 Free PMC article.
-
Transcriptome resources for the white-footed mouse (Peromyscus leucopus): new genomic tools for investigating ecologically divergent urban and rural populations.Mol Ecol Resour. 2015 Mar;15(2):382-94. doi: 10.1111/1755-0998.12301. Epub 2014 Jul 16. Mol Ecol Resour. 2015. PMID: 24980186 Free PMC article.
References
-
- Bester-Meredith JK, Marler CA. The Association Between Male Offspring Aggression and Paternal and Maternal Behavior of Peromyscus Mice. Ethology. 2003;109:797–808.
-
- Brown DM, Matise TC, Koike G, Simon JS, Winer ES, Zangen S, McLaughlin MG, Shiozawa M, Atkinson OS, Hudson JR, Jr, Chakravarti A, Lander ES, Jacob HJ. An integrated genetic linkage map of the laboratory rat. Mamm Genome. 1998;9:521–530. - PubMed
Publication types
MeSH terms
Substances
Grants and funding
LinkOut - more resources
Full Text Sources
Other Literature Sources
