

Optogenetic micro-electrocorticography for modulating and localizing cerebral cortex activity
- PMID: 24445482
- PMCID: PMC4026187
- DOI: 10.1088/1741-2560/11/1/016010
Optogenetic micro-electrocorticography for modulating and localizing cerebral cortex activity
Abstract
Objective: Spatial localization of neural activity from within the brain with electrocorticography (ECoG) and electroencephalography remains a challenge in clinical and research settings, and while microfabricated ECoG (micro-ECoG) array technology continues to improve, complementary methods to simultaneously modulate cortical activity while recording are needed.
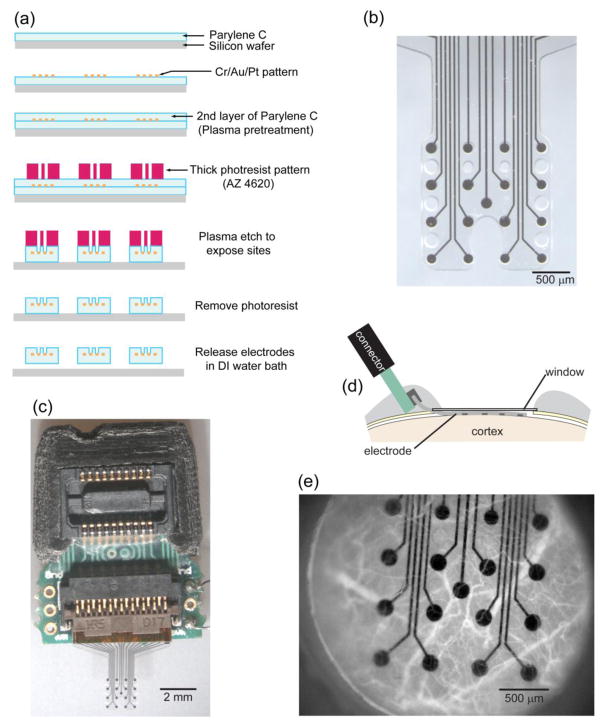
Approach: We developed a neural interface utilizing optogenetics, cranial windowing, and micro-ECoG arrays fabricated on a transparent polymer. This approach enabled us to directly modulate neural activity at known locations around micro-ECoG arrays in mice expressing Channelrhodopsin-2. We applied photostimuli varying in time, space and frequency to the cortical surface, and we targeted multiple depths within the cortex using an optical fiber while recording micro-ECoG signals.
Main results: Negative potentials of up to 1.5 mV were evoked by photostimuli applied to the entire cortical window, while focally applied photostimuli evoked spatially localized micro-ECoG potentials. Two simultaneously applied focal stimuli could be separated, depending on the distance between them. Photostimuli applied within the cortex with an optical fiber evoked more complex micro-ECoG potentials with multiple positive and negative peaks whose relative amplitudes depended on the depth of the fiber.
Significance: Optogenetic ECoG has potential applications in the study of epilepsy, cortical dynamics, and neuroprostheses.
Figures
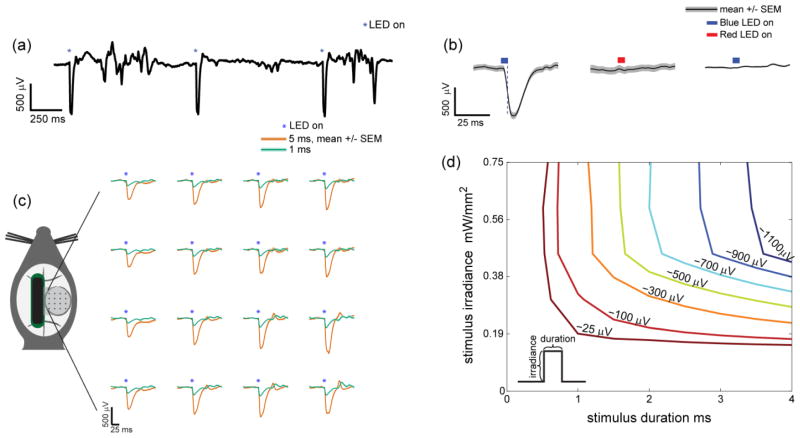
 (465 nm, 3 ms, 0.75 mW/mm2, 5.3 mW applied to entire window). (b) Wild type mice did not show any response to stimulation with blue light photostimulus
 (465 nm, 0.75 mW/mm2), while ChR2 positive mice were responsive to blue
(465 nm, 0.75 mW/mm2) but not red
(465 nm, 0.75 mW/mm2), while ChR2 positive mice were responsive to blue
(465 nm, 0.75 mW/mm2) but not red
 (625 nm, 0.81 mW/mm2) photostimuli. A single channel is shown with 50 trials averaged for each condition. Control figures with all 16 channels can be found in supplementary figure 2. Trial-averaged evoked potentials are mapped according to channel location on the array (1 or 5 ms, 465 nm, 0.75 mW/mm2, 5.3 mW total across the window). Longer stimuli evoked larger negative potentials. These potentials were spatially uniform with the entire window illuminated. 10 trials were averaged for each condition. (d) The amplitude of optogenetically evoked potential depended on the duration and irradiance (i.e. brightness) of the photostimulus. The stimulus duration and irradiance parameter space was systematically explored to generate a 2D interpolated contour plot.
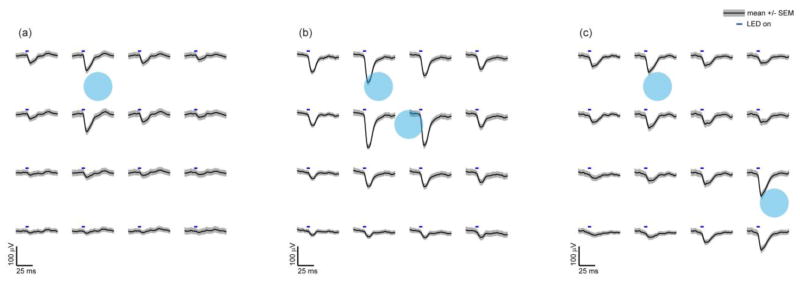
 were applied repeatedly to the cortical surface using an objective lens. The photostimuli were 200 μm in diameter, for 5 ms in duration - and 1 mW in power (32 mW/mm2). (a) The amplitude of the evoked micro-ECoG potentials was greatest nearest the stimulus location. Surrounding electrode sites had similar but smaller amplitude waveforms with minimal phase delay suggesting electrostatic volume conduction. (b,c) Stimultaneously applied focal photostimuli evoke spatially separable potentials at distances greater than twice the electrode spacing (c), but at closer electrode spacings the evoked potentials were less separable. 90 trials were averaged for each.
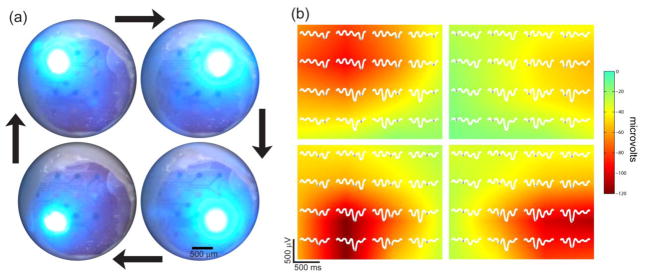
 , and these values were pseudocolored using linear interpolation. Spatially localized potentials were observed for each stimulus location. Potentials were bandpass filtered from 5 to 500 Hz.
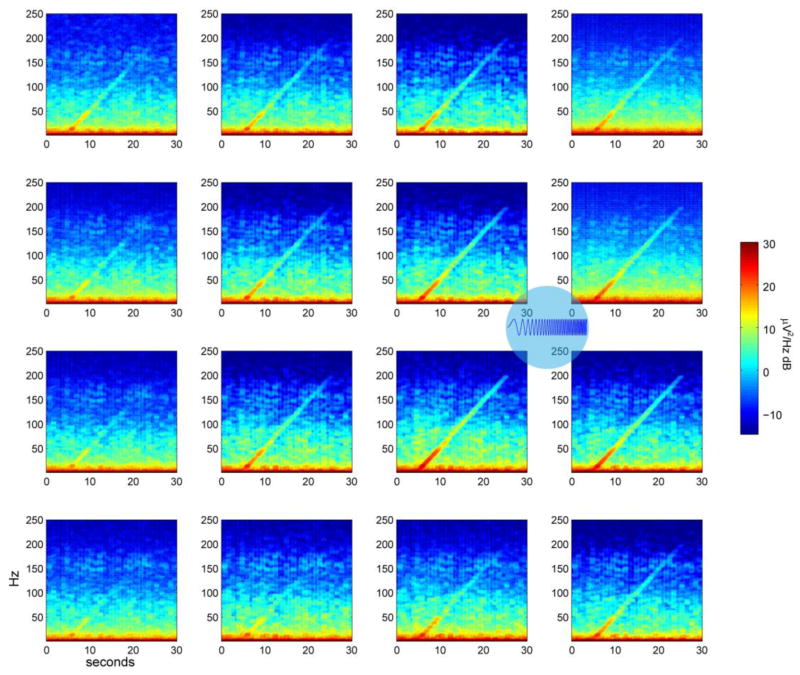 . Spectrograms of the signals at each micro-ECoG electrode site show that the cortical response decreases as distance and frequency increase. 5 trials were averaged.
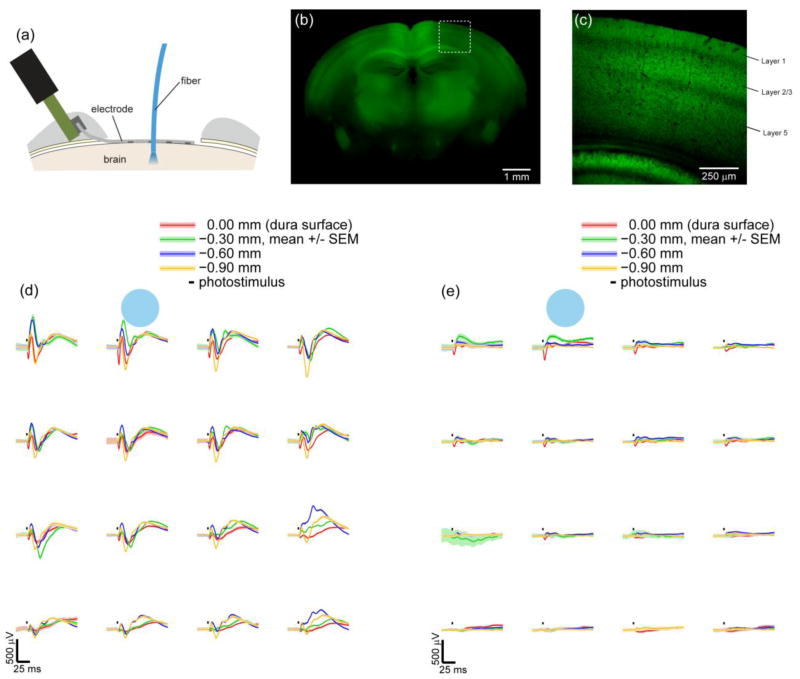 at multiple depths within the cortex. Photostimulus power was 2.5 mW (78 mW/mm2 ) in (d) and 0.8 mW (25.5 mW/mm2) in (e). Stronger photostimuli (d) caused potentials with multiple negative and positive peaks, while weaker photostimuli (e) evoked only an initial negative peak. These subsequent peaks followed several miliseconds after the photostimulus ceased. Similar to figure 4, the amplitude of the micro-ECoG potentials (d,e) were spatially related to the stimulus location. 50 trials were averaged for each condition in (d) and (e).
References
-
- Penfield W, Jasper H. Epilepsy and the functional anatomy of the human brain 1954
-
- Leuthardt EC, Schalk G, Wolpaw JR, Ojemann JG, Moran DW. A brain–computer interface using electrocorticographic signals in humans. J Neural Eng. 2004;1:63–71. - PubMed
-
- Wilson JA, Felton EA, Garell PC, Schalk G, Williams JC. ECoG factors underlying multimodal control of a brain-computer interface. Neural Systems and Rehabilitation Engineering, IEEE Transactions on. 2006;14:246–50. - PubMed
-
- Rubehn B, Bosman C, Oostenveld R, Fries P, Stieglitz T. A MEMS-based flexible multichannel ECoG-electrode array. J Neural Eng. 2009;6:036003. - PubMed
-
- Viventi J, Kim D-H, Vigeland L, Frechette ES, Blanco JA, Kim Y-S, Avrin AE, Tiruvadi VR, Hwang S-W, Vanleer AC, Wulsin DF, Davis K, Gelber CE, Palmer L, Van der Spiegel J, Wu J, Xiao J, Huang Y, Contreras D, Rogers JA, Litt B. Flexible, foldable, actively multiplexed, high-density electrode array for mapping brain activity in vivo. Nat Neurosci. 2011;14:1599–605. - PMC - PubMed
Publication types
MeSH terms
Substances
Grants and funding
LinkOut - more resources
Full Text Sources
Other Literature Sources