. 2014 Apr;42(6):3515-28.
doi: 10.1093/nar/gkt1380. Epub 2014 Jan 20.

Predicting DNA methylation level across human tissues

Affiliations

Predicting DNA methylation level across human tissues

Baoshan Ma et al. Nucleic Acids Res. 2014 Apr.

Abstract

Differences in methylation across tissues are critical to cell differentiation and are key to understanding the role of epigenetics in complex diseases. In this investigation, we found that locus-specific methylation differences between tissues are highly consistent across individuals. We developed a novel statistical model to predict locus-specific methylation in target tissue based on methylation in surrogate tissue. The method was evaluated in publicly available data and in two studies using the latest IlluminaBeadChips: a childhood asthma study with methylation measured in both peripheral blood leukocytes (PBL) and lymphoblastoid cell lines; and a study of postoperative atrial fibrillation with methylation in PBL, atrium and artery. We found that our method can greatly improve accuracy of cross-tissue prediction at CpG sites that are variable in the target tissue [R(2) increases from 0.38 (original R(2) between tissues) to 0.89 for PBL-to-artery prediction; from 0.39 to 0.95 for PBL-to-atrium; and from 0.81 to 0.98 for lymphoblastoid cell line-to-PBL based on cross-validation, and confirmed using cross-study prediction]. An extended model with multiple CpGs further improved performance. Our results suggest that large-scale epidemiology studies using easy-to-access surrogate tissues (e.g. blood) could be recalibrated to improve understanding of epigenetics in hard-to-access tissues (e.g. atrium) and might enable non-invasive disease screening using epigenetic profiles.


Figures

Figure 1.
Figure 1.
Methylation pattern across tissues and between-tissue difference across individuals. (a) Scatter plots for sample #1. Red circles for PBL versus LCL (x = PBL, y = LCL) and purple circles for PBL versus SVM-predicted PBL (x = PBL, y = predicted PBL based on LCL). R2 (PBL_LCL) = R2 between methylation in PBL and methylation in LCL. R2(SVM) = R2 between methylation in PBL and SVM predicted methylation in PBL based on LCL data. (b) Scatter plot for sample #1 versus sample #2. Red circles for PBL–LCL in sample #1 versus PBL–LCL in sample #2 (x = PBL–LCL in sample #1, y = PBL–LCL in sample #2). Purple circles for PBL–SVM-predicted PBL of sample #1 versus PBL–SVM-predicted PBL in sample #2 (x = PBL–SVM-predicted PBL of sample #1, y = PBL–SVM-predicted PBL of sample #2). (c) Scatter plots for sample 177. Red circles for Artery versus PBL (x = artery, y = PBL) and purple circles for artery versus SVM-predicted artery (x = artery, y = predicted artery based on PBL). R2(Ar_PBL) = R2 between methylation in artery and methylation in PBL. R2(SVM) = R2 between methylation in artery and SVM-predicted methylation in artery based on PBL data. (d) Scatter plot for sample 177 versus sample 241. Red circles for artery–PBL in sample 177 versus artery–PBL in sample 241 (x = artery–PBL in sample 177, y = artery–PBL in sample 241). Purple circles for artery–SVM-predicted artery of sample 177 versus artery–SVM-predicted artery in sample 241 (x = Artery–SVM-predicted artery of sample 177, y = artery–SVM-predicted artery of sample 241). (e) Scatter plots for sample 177. Red circles for atrium versus PBL (x = atrium, y = PBL) and purple circles for atrium versus SVM-predicted atrium (x = atrium, y = predicted atrium based on PBL). R2(At_PBL) = R2 between methylation in atrium and methylation in PBL. R2(SVM) = R2 between methylation in atrium and SVM-predicted methylation in atrium based on PBL data. (f) Scatter plot for sample 177 versus sample 501. Red circles for atrium–PBL in sample 177 versus atrium–PBL in sample 501 (x = atrium–PBL in sample 177, y = atrium–PBL in sample 501). Purple circles for atrium–SVM-predicted atrium of sample 177 versus Atrium–SVM-predicted atrium in sample 501 (x = atrium–SVM-predicted atrium of sample 177, y = atrium–SVM-predicted atrium of sample 501). Asterisk: for scatter plots for all other samples; please refer to Supplementary Figures S5 and W-S5 for LCL-PBL, S6 and W-S6 for PBL–artery, S7 and W-S7 for PBL–atrium.
Figure 2.
Figure 2.
Probe-specific prediction accuracy based on SVM model by methylation variation within target tissues. (a) Standard deviation (SD) of methylation in PBL versus R2 between PBL and predicted PBL based on SVM. For each dot, x = standard deviation (SD) of methylation in PBL and y = the R2 of PBL and predicted PBL using SVM model for the same probe. (b) Standard deviation (SD) of methylation in PBL versus mean absolute value of difference between PBL and predicted PBL based on SVM. For each dot, x = standard deviation (SD) of methylation in PBL and y = the mean absolute value of difference between PBL and predicted PBL using SVM model for the same probe. (c) Standard deviation (SD) of methylation in artery versus R2 between artery and predicted artery based on SVM. For each dot, x = standard deviation (SD) of methylation in artery and y = the R2 of artery and predicted artery using SVM model for the same probe. (d) Standard deviation (SD) of methylation in artery versus mean absolute value of difference between artery and predicted artery based on SVM. For each dot, x = standard deviation (SD) of methylation in artery and y = the mean absolute value of difference between artery and predicted artery using SVM model for the same probe. (e) Standard deviation (SD) of methylation in atrium versus R2 between atrium and predicted atrium based on SVM. For each dot, x = standard deviation (SD) of methylation in atrium and y = the R2 of atrium and predicted atrium using SVM model for the same probe.(f) Standard deviation (SD) of methylation in atrium versus mean absolute value of difference between atrium and predicted atrium based on SVM. For each dot, x = standard deviation (SD) of methylation in atrium and y = the mean absolute value of difference between atrium and predicted atrium using SVM model for the same probe. Asterisk: each dot represents one probe on the Illumina array. The curve represents the LOESS smoothing average curve. The straight line in (b), (d) and (f) is the x = y line.
Figure 3.
Figure 3.
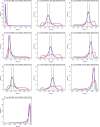
Density of predicted methylation level by true methylation in artery for sample 177. Asterisk: red line represents the density of methylation in PBL. Green line represents the density of the predicted artery methylation by using linear regression model. Purple line represents predicted methylation using SVM model. The two vertical lines represent the range of true methylation level in artery.
Figure 4.
Figure 4.
Predicting performance across multiple tissues. Data obtained from Byun et al. (2009) Hum Mol Genet (PMID:19776032), where there are six cases and each has 11 tissues: brain, bladder, colon, esophagus, heart, kidney, liver, lung, pancreas, spleen and stomach. We examined all tissue pairs (55 pairs). For each pair, we apply our SVM model to predict methylation in one tissue using the other tissue in the pair. Figure 4 compares the R2 based on raw data and predicted data. R2 of raw data is the R2 between raw methylation of tissue pair by individual and average across all six subjects, R2 of predicted data is the R2 between predicted and true methylation in the target tissue by individual and average across all six subjects. The straight line is the x = y line. In the legend, the surrogate tissue is on the left and target tissue is on the right.
Figure 5.
Figure 5.
Clustering using atrium, PBL and PBL calibrated (SVM) methylation. (a) There are 14 samples: two female (white) and 12 male (red). The PostOpAF contains four cases (red) and 10 controls (white). The controls are grouped into two groups indicated by red circles and turquoise circles. One group contains sample #394, #286, #241, #271 and the other group includes #501, #274, #337, #397 and #412. (b) The two groups of controls indicated by red and turquoise circles are mixed together and one control (#271) is first clustered with two cases (#511, #177) and then with other controls (turquoise and red), and there are two controls (#501, #337) distinct from other controls. (c) The turquoise and red controls are now clustered back together, respectively, and locate at the bottom of the tree, except control #501 that was also close to case #215 using atrium methylation (a) and case #511 that is now clustered with the red group controls but was clustered with turquoise controls.
Figure 6.
Figure 6.
Effect of training sample size on cross-study probe-specific prediction error. Asterisk: for a given sample size, we randomly chose samples from our family data set of 39 individuals to construct the training sample and predict the T cell methylation in the GSE26211 data set. We replicated this 10 times and computed the mean absolute prediction error for each probe. The prediction error is plotted against standard deviation of methylation in the target tissue (T cell methylation). The left panel is prediction error by using linear regression model; the right panel is prediction error by using SVM model.

Similar articles

Cited by

References

    1. Bird A. DNA methylation patterns and epigenetic memory. Genes Dev. 2002;16:6–21. - PubMed
    1. Byun HM, Siegmund KD, Pan F, Weisenberger DJ, Kanel G, Laird PW, Yang AS. Epigenetic profiling of somatic tissues from human autopsy specimens identifies tissue- and individual-specific DNA methylation patterns. Hum. Mol. Genet. 2009;18:4808–4817. - PMC - PubMed
    1. Baccarelli A, Rienstra M, Benjamin EJ. Cardiovascular epigenetics: basic concepts and results from animal and human studies. Circ. Cardiovasc. Genet. 2010;3:567–573. - PMC - PubMed
    1. Fleisch AF, Wright RO, Baccarelli AA. Environmental epigenetics: a role in endocrine disease? J. Mol. Endocrinol. 2012;49:R61–R67. - PMC - PubMed
    1. Provencal N, Suderman MJ, Guillemin C, Massart R, Ruggiero A, Wang D, Bennett AJ, Pierre PJ, Friedman DP, Cote SM, et al. The signature of maternal rearing in the methylome in rhesus macaque prefrontal cortex and T cells. J. Neurosci. 2012;32:15626–15642. - PMC - PubMed

Publication types