. 2014 Jan 21:4:3799.
doi: 10.1038/srep03799.

Characterizing and controlling the inflammatory network during influenza A virus infection

Affiliations

Characterizing and controlling the inflammatory network during influenza A virus infection

Suoqin Jin et al. Sci Rep. .

Abstract

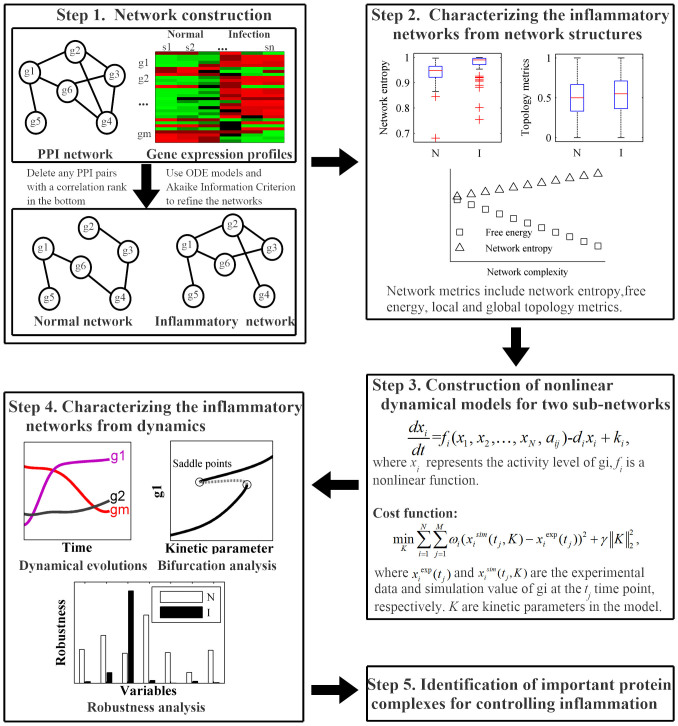
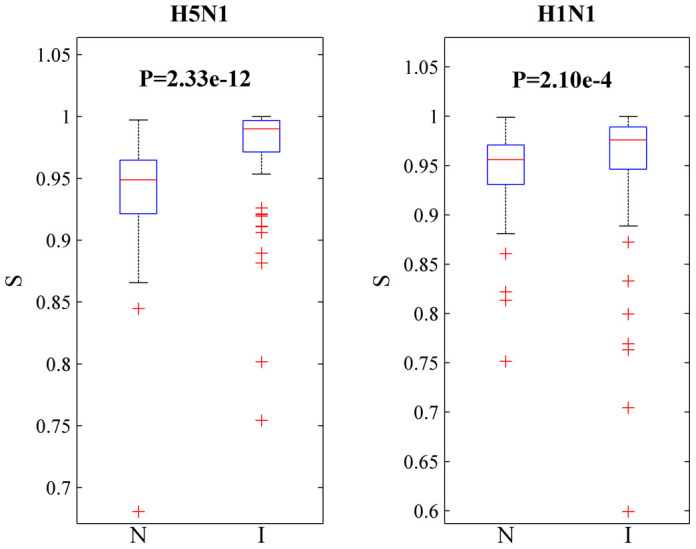
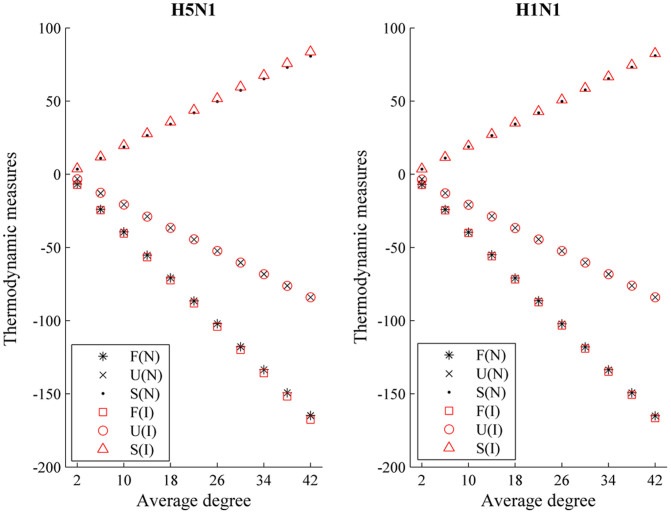
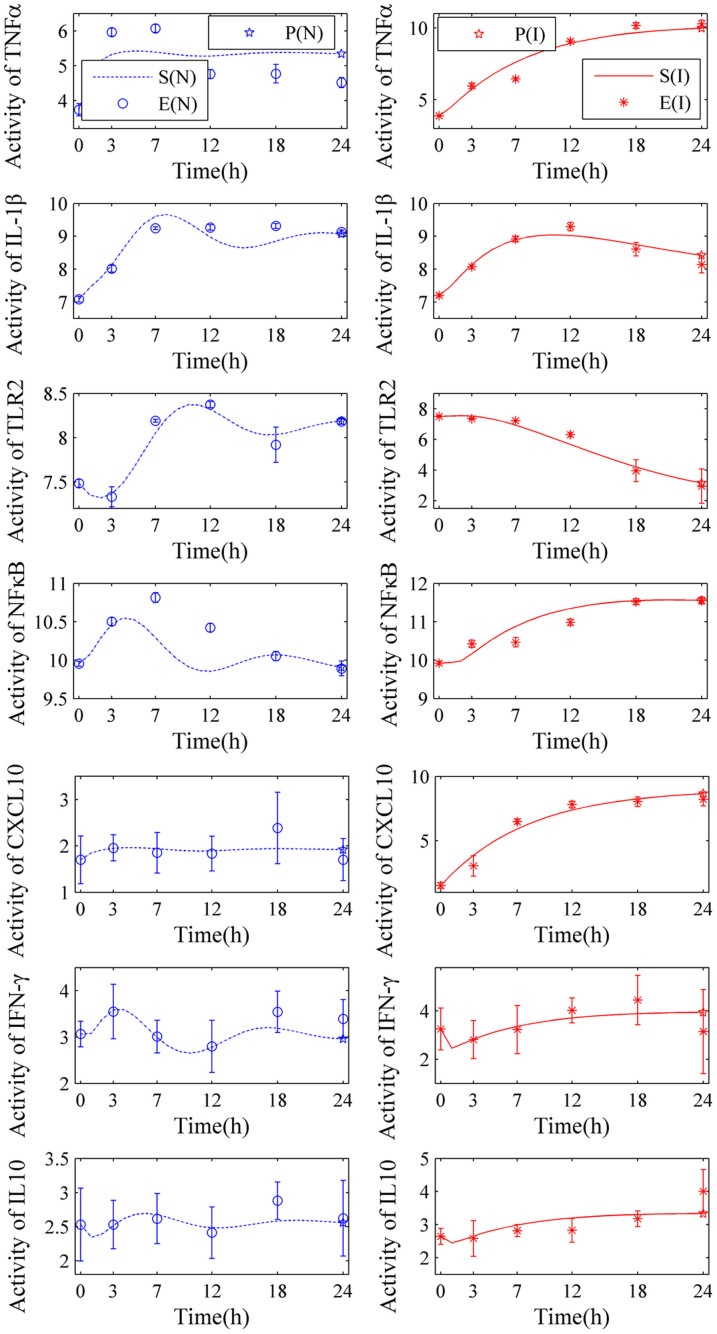
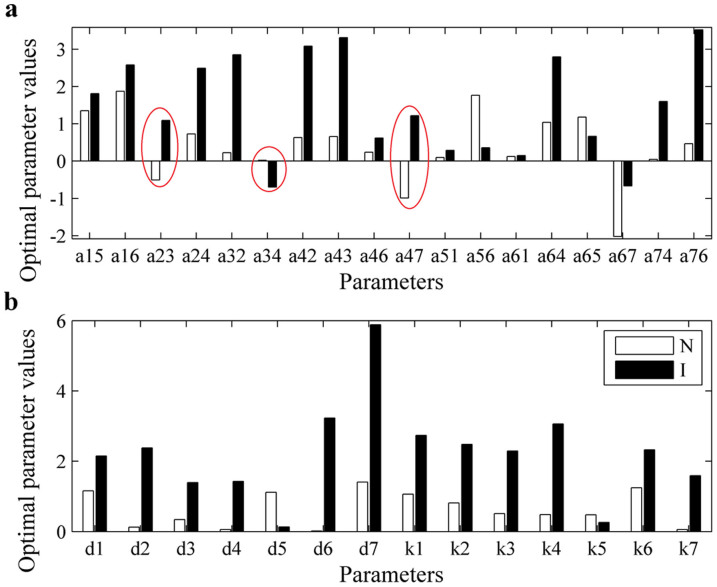
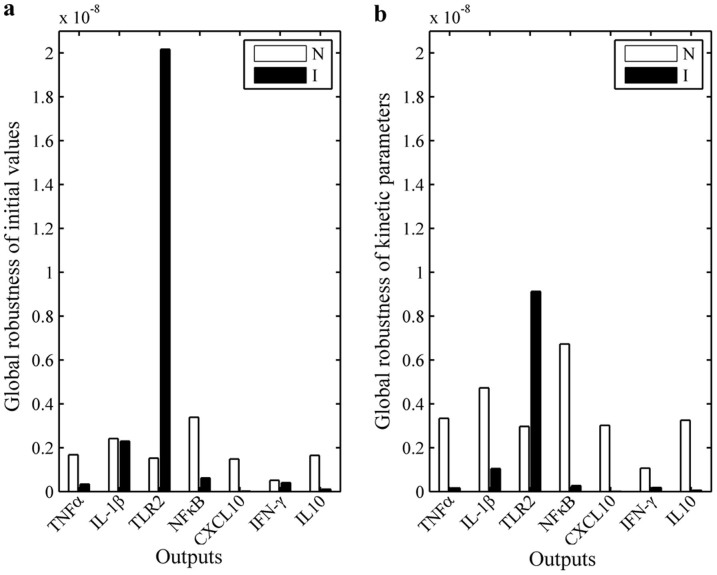
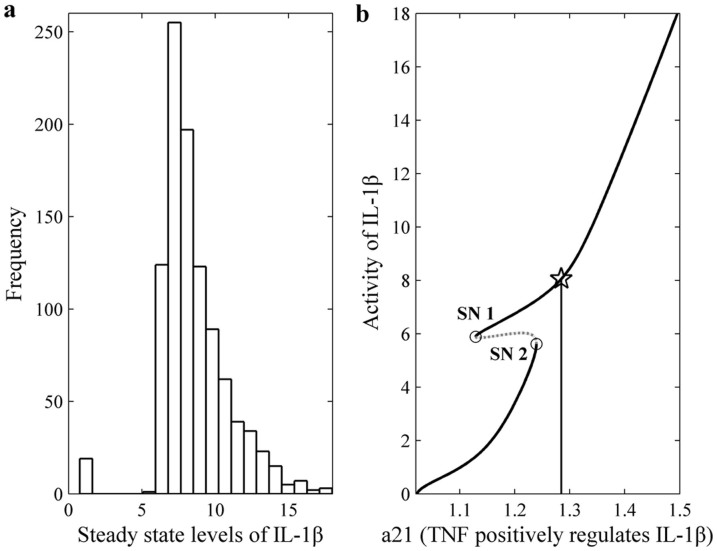
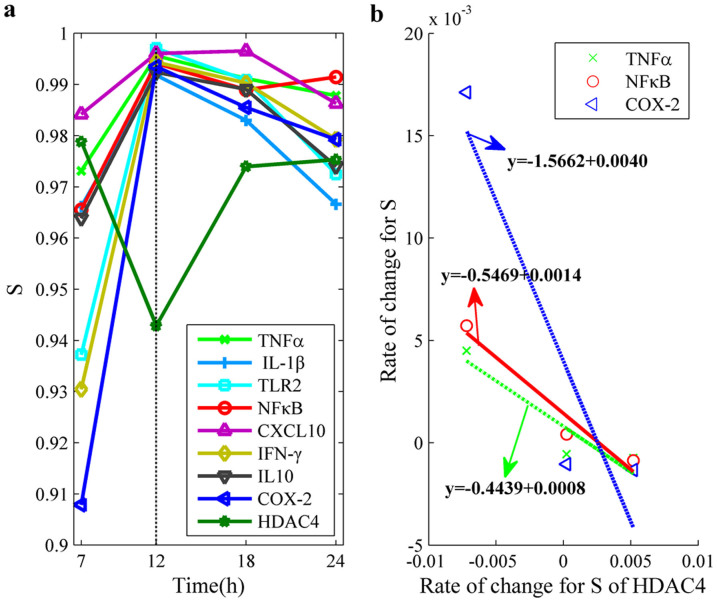
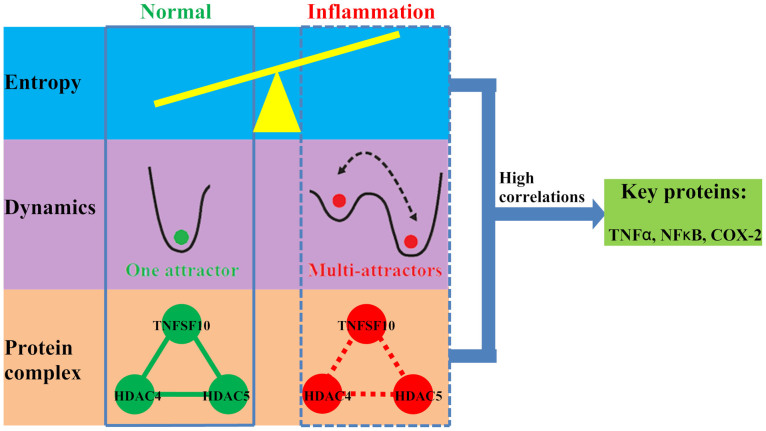
To gain insights into the pathogenesis of influenza A virus (IAV) infections, this study focused on characterizing the inflammatory network and identifying key proteins by combining high-throughput data and computational techniques. We constructed the cell-specific normal and inflammatory networks for H5N1 and H1N1 infections through integrating high-throughput data. We demonstrated that better discrimination between normal and inflammatory networks by network entropy than by other topological metrics. Moreover, we identified different dynamical interactions among TLR2, IL-1β, IL10 and NFκB between normal and inflammatory networks using optimization algorithm. In particular, good robustness and multistability of inflammatory sub-networks were discovered. Furthermore, we identified a complex, TNFSF10/HDAC4/HDAC5, which may play important roles in controlling inflammation, and demonstrated that changes in network entropy of this complex negatively correlated to those of three proteins: TNFα, NFκB and COX-2. These findings provide significant hypotheses for further exploring the molecular mechanisms of infectious diseases and developing control strategies.


Figures

Figure 1
Figure 1. Workflow for characterization and control of the inflammatory networks.
Step 1: Network construction. The framework of the network construction was shown in Supplementary Figure S1. Step 2: Characterizing the inflammatory networks from network structures. Network metrics explored in this study were summarized in Supplementary Figure S2. Step 3: Construction of nonlinear dynamical models for two sub-networks. The problem that identifies the kinetic parameters in the nonlinear models can be converted into an optimization problem by defining a cost function. Step 4: Characterizing the inflammatory networks from dynamics. The procedure for dynamical analysis of the networks was clearly depicted in Supplementary Figure S3. Step 5: Identification of important protein complexes for controlling inflammation.
Figure 2
Figure 2. Average relative errors (AREs) of the networks.
The y-axis represents the number of nodes in networks whose AREs are fall into the corresponding bins. (a) and (b) are the distributions of the AREs for the H5N1 and H1N1 datasets, respectively.
Figure 3
Figure 3. Comparison of the local network entropies (S) between the inflammatory (I) and normal networks (N) for all nodes with degree ≥2 for H5N1 and H1N1 infections.
P-values are from an one-tailed Wilcoxon rank sum test.
Figure 4
Figure 4. Plot of the thermodynamic measures, including free energy (F), internal energy (U) and entropy (S) as a function of the average vertex degree for networks generated using Erdos-Rényi models.
(N) and (I) indicate the normal and inflammatory samples, respectively.
Figure 5
Figure 5. Comparisons between the numerical simulation results (S), prediction results (P) and experimental data (E) of TNFα, IL-1β, TLR2, NFκB, CXCL10, IFN-γ and IL10 in a normal network (N) and an inflammatory network (I).
The blue dashed and red solid lines denote the simulation results for N and I, respectively. The blue circles and red stars represent the experimental data for N and I, respectively. The blue and red pentagrams indicate the predicted values at 24 h for N and I, respectively. The experimental errors are also plotted as short bars at each time point.
Figure 6
Figure 6. Optimal parameter values obtained using the DMGBDE algorithm (Only the common parameters that appeared in both the normal (N) and inflammatory (I) sub-networks are shown).
The white and black bars are parameters in the normal and inflammatory sub-networks, respectively. The parameters with opposite regulations are marked by red ellipses. (a) and (b) represent the reaction rates for activation/inhibition and degradation/basal activity, respectively.
Figure 7
Figure 7. Global robustness with respect to the initial values and kinetic parameters in the normal (N) and inflammatory (I) networks, respectively.
(a) Initial values. (b) Kinetic parameters.
Figure 8
Figure 8. The bistability phenomenon in the inflammatory network for H5N1 infection.
(a) The distribution of the IL-1β steady-state levels with 1000 perturbations for parameter a21. (b) The bifurcation graph of IL-1β for parameter a21. The original value of a21 is 1.2849, which is marked by a pentagram. When perturbed to near 1.1286, the steady-state of IL-1β then switched from 5.8846 to 1.4126. SNs indicate saddle nodes.
Figure 9
Figure 9. Sharp increase in the entropy of TNFα, NFκB and COX-2 negatively correlated with the changes in the entropy of HDAC4.
(a) Evolution process of the local network entropy (S) of TNFα, IL-1β, TLR2, NFκB, CXCL10, IFN-γ, IL10, COX-2 and HDAC4. (b) Linear regression to show the correlation between the rate of change of S for TNFα, NFκB, COX-2 and that for HDAC4. The results show that the change in S of HDAC4 is much more correlated with the change in S for TNFα, NFκB and COX-2.
Figure 10
Figure 10. The summarization of the main results.
Compared to normal networks, the inflammatory networks are characterized by higher network entropy, multi-stability (i.e. multi-attractors) and non-existed protein complex. Their high correlations are used to identify the key proteins. The solid and dashed lines between three proteins TNFSF10, HDAC4 and HDAC5 indicate that they form and do not form a protein complex, respectively. This figure was designed and drawn by Jin and Zou.

References

    1. Neumann G., Noda T. & Kawaoka Y. Emergence and pandemic potential of swine-origin H1N1 influenza virus. Nature 459, 931–939 (2009). - PMC - PubMed
    1. Fournie G. et al. Interventions for avian influenza A (H5N1) risk management in live bird market networks. Proc Natl Acad Sci U S A 110, 9177–9182 (2013). - PMC - PubMed
    1. Horby P. H7N9 is a virus worth worrying about. Nature 496, 399 (2013). - PubMed
    1. Cheung C. et al. Induction of proinflammatory cytokines in human macrophages by influenza A (H5N1) viruses: a mechanism for the unusual severity of human disease? Lancet 360, 1831–1837 (2002). - PubMed
    1. Medzhitov R. Origin and physiological roles of inflammation. Nature 454, 428–435 (2008). - PubMed

Publication types

MeSH terms