. 2014 Feb 10;211(2):263-80.
doi: 10.1084/jem.20111741. Epub 2014 Jan 20.

Reduced BMPR2 expression induces GM-CSF translation and macrophage recruitment in humans and mice to exacerbate pulmonary hypertension

Affiliations

Reduced BMPR2 expression induces GM-CSF translation and macrophage recruitment in humans and mice to exacerbate pulmonary hypertension

Hirofumi Sawada et al. J Exp Med. .

Abstract

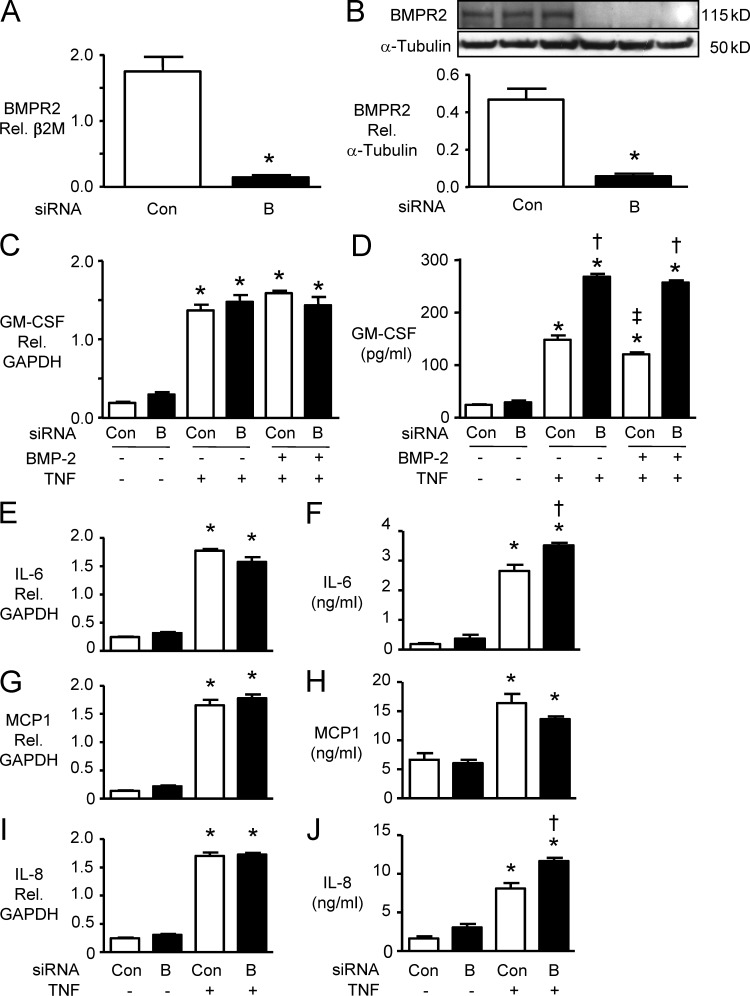
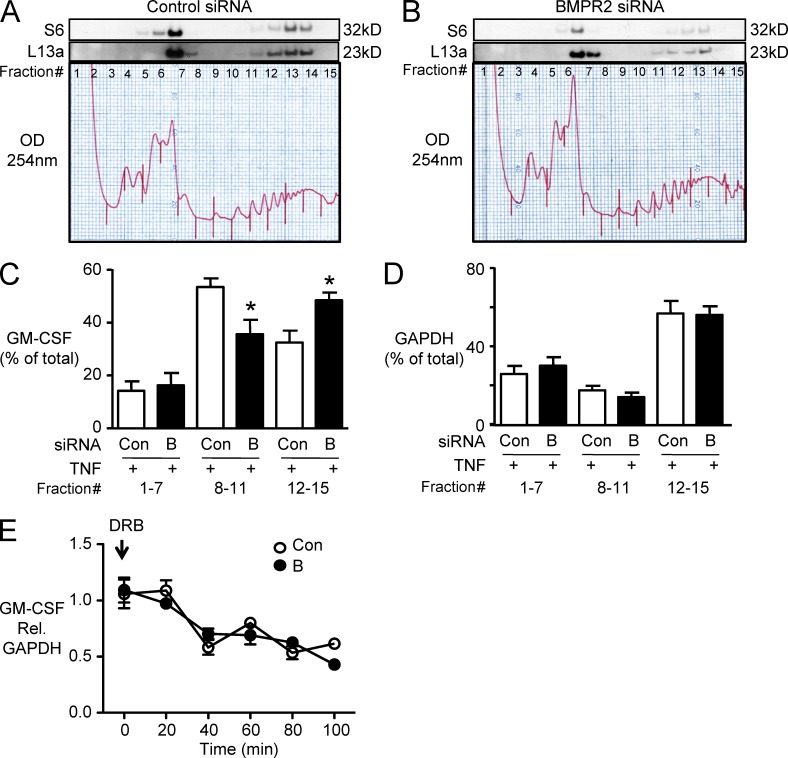
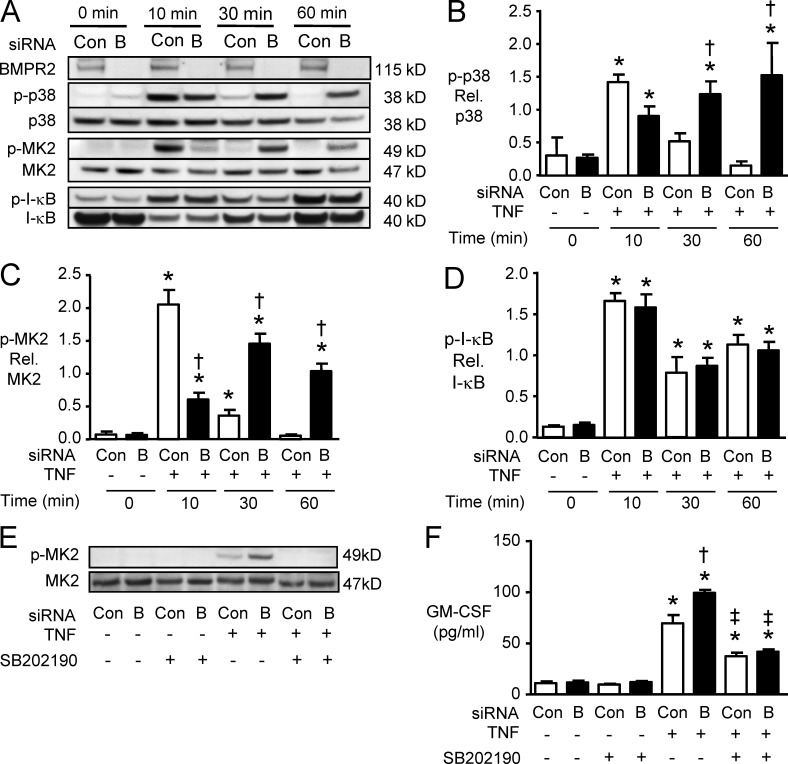
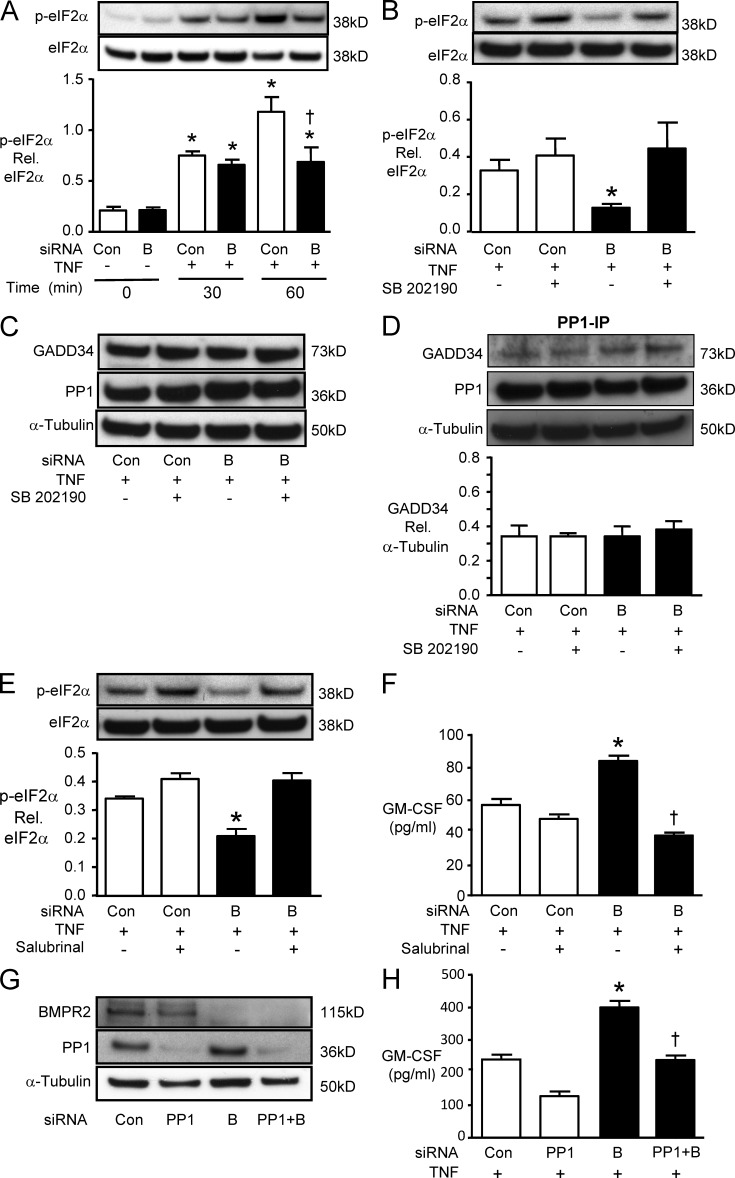
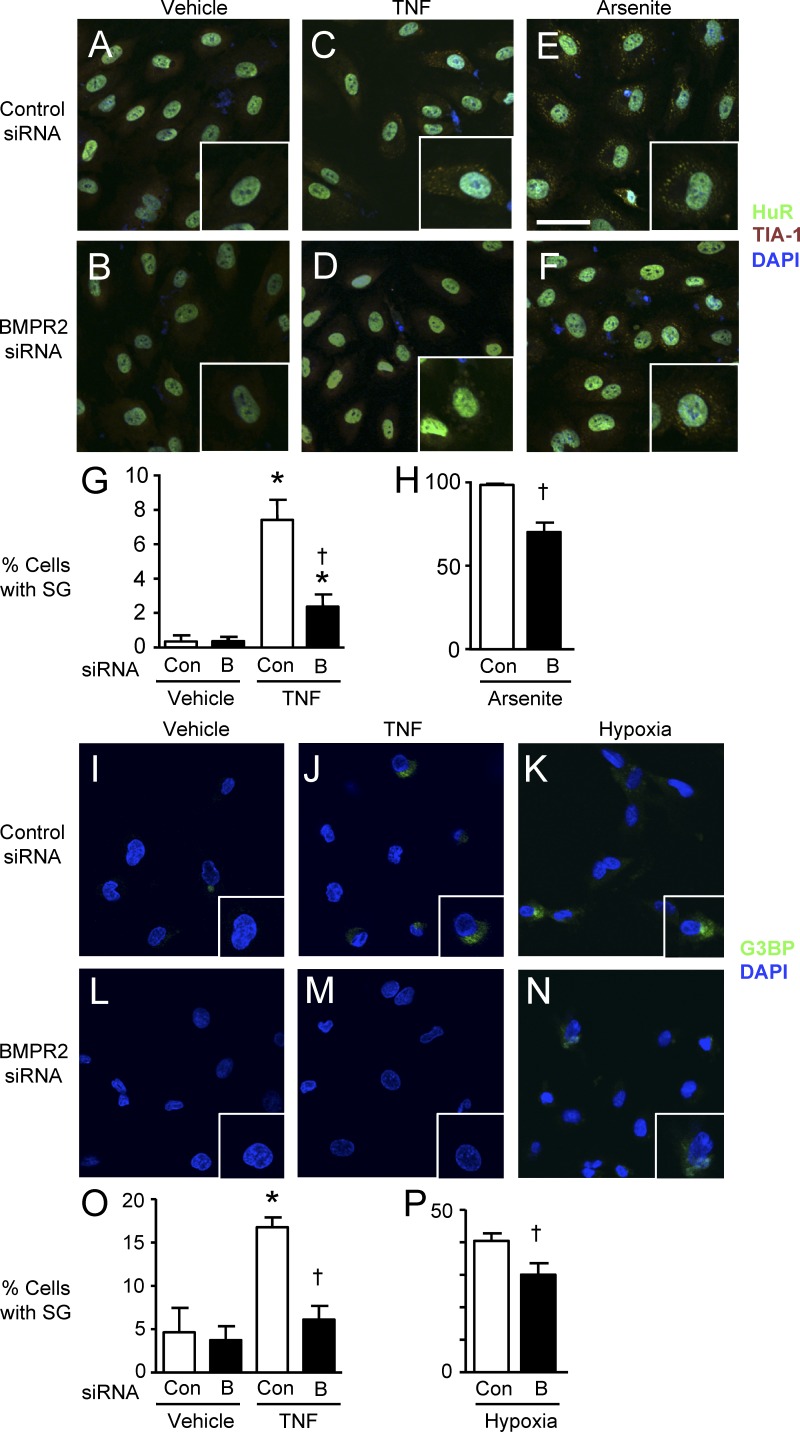
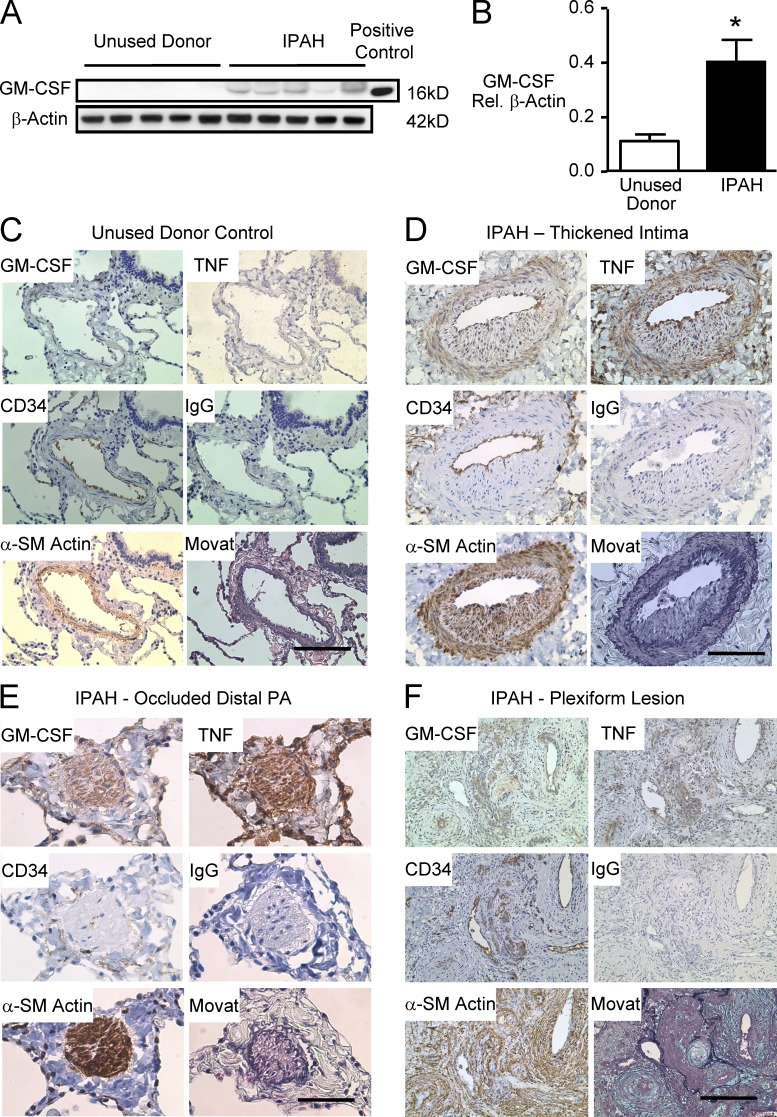
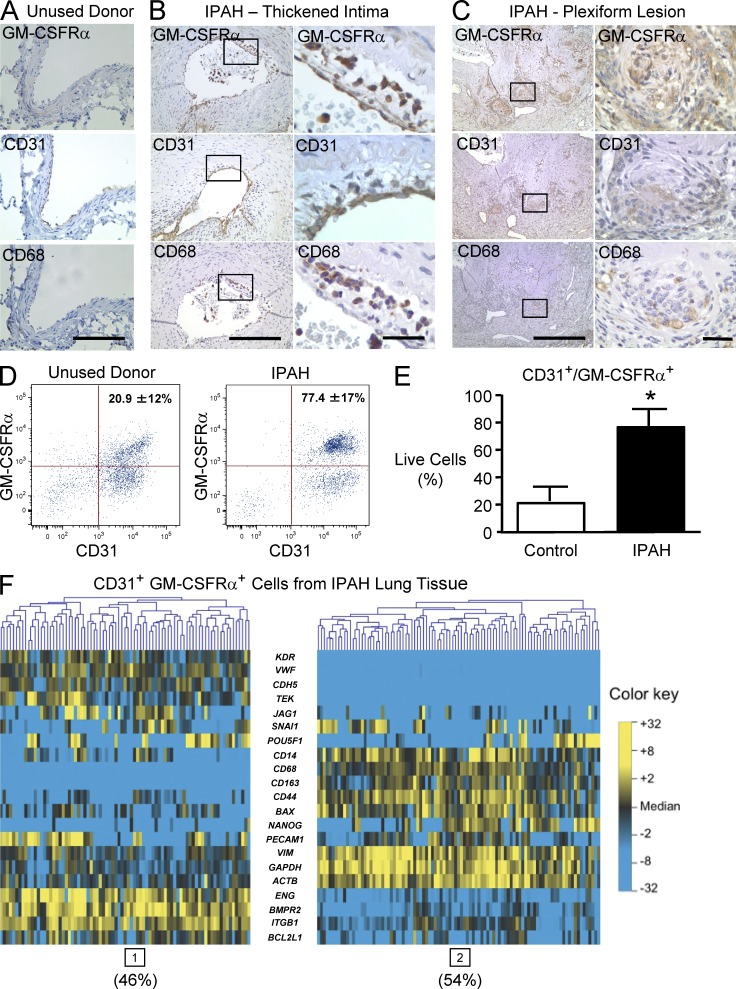
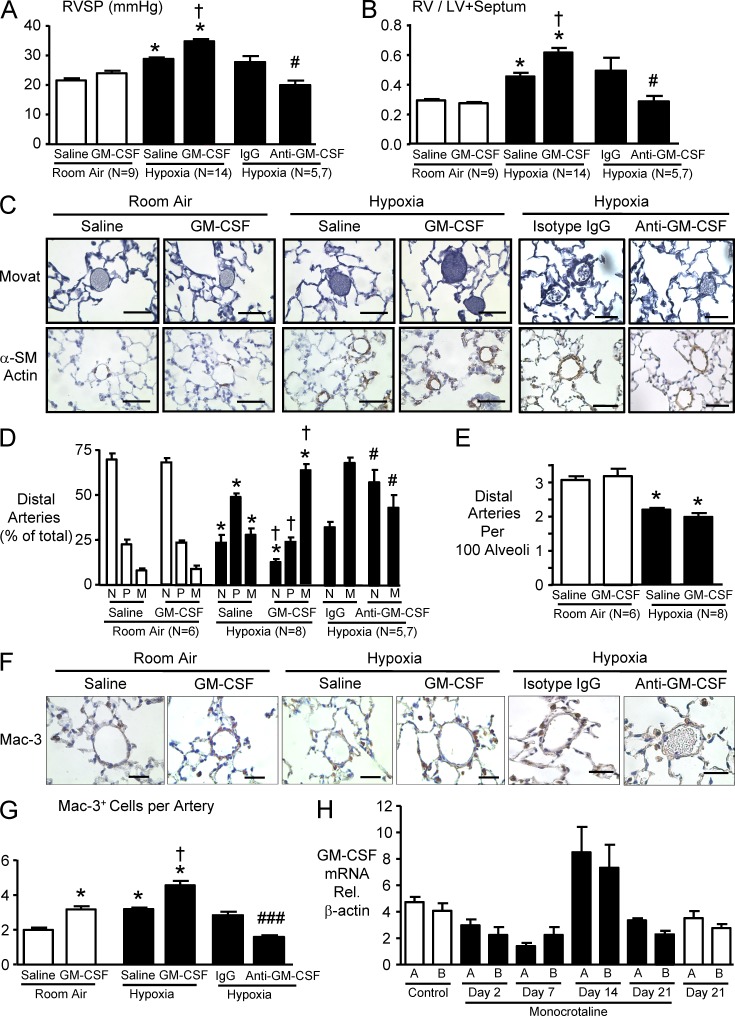
Idiopathic pulmonary arterial hypertension (PAH [IPAH]) is an insidious and potentially fatal disease linked to a mutation or reduced expression of bone morphogenetic protein receptor 2 (BMPR2). Because intravascular inflammatory cells are recruited in IPAH pathogenesis, we hypothesized that reduced BMPR2 enhances production of the potent chemokine granulocyte macrophage colony-stimulating factor (GM-CSF) in response to an inflammatory perturbation. When human pulmonary artery (PA) endothelial cells deficient in BMPR2 were stimulated with tumor necrosis factor (TNF), a twofold increase in GM-CSF was observed and related to enhanced messenger RNA (mRNA) translation. The mechanism was associated with disruption of stress granule formation. Specifically, loss of BMPR2 induced prolonged phospho-p38 mitogen-activated protein kinase (MAPK) in response to TNF, and this increased GADD34-PP1 phosphatase activity, dephosphorylating eukaryotic translation initiation factor (eIF2α), and derepressing GM-CSF mRNA translation. Lungs from IPAH patients versus unused donor controls revealed heightened PA expression of GM-CSF co-distributing with increased TNF and expanded populations of hematopoietic and endothelial GM-CSF receptor α (GM-CSFRα)-positive cells. Moreover, a 3-wk infusion of GM-CSF in mice increased hypoxia-induced PAH, in association with increased perivascular macrophages and muscularized distal arteries, whereas blockade of GM-CSF repressed these features. Thus, reduced BMPR2 can subvert a stress granule response, heighten GM-CSF mRNA translation, increase inflammatory cell recruitment, and exacerbate PAH.


Figures

Figure 1.
Figure 1.
GM-CSF production in PAECs. (A and B) PAECs were transfected with BMPR2 siRNA (“B”) or nontargeting siRNA as a control (Con): 48 h later, BMPR2 mRNA was measured by qRT-PCR (A) and BMPR2 protein by immunoblot (B). 24 h after transfection with B or Con siRNA, PAECs were pretreated for 30 min with 100 ng/ml BMP-2 or vehicle before adding 10 ng/ml TNF. (C and D) 6 h later, GM-CSF mRNA normalized to GAPDH was determined by qRT-PCR (C) and GM-CSF–secreted protein was measured by ELISA (D). (E–J) Similar analyses were performed for IL-6 mRNA (E) and secreted protein (F), MCP-1 mRNA (G) and secreted protein (H), and IL-8 mRNA (I) and secreted protein (J). Bars are mean ± SEM for n = 3 (A–D) or n = 4 (E–J) experiments; *, P < 0.05 versus Con by unpaired Student’s t test in A and B; *, P < 0.05 versus unstimulated control, matched siRNA; †, P < 0.05 versus Con siRNA under the same stimulation; and ‡, P < 0.05 versus TNF without BMP-2 by ANOVA and Bonferroni’s test of multiple comparisons in C–J.
Figure 2.
Figure 2.
Reduced BMPR2 appears to enhance GM-CSF mRNA translation. (A and B) To assess GM-CSF mRNA translation, polysome profiles were analyzed by sucrose gradient fractionation. Similar profiles were shown for cells stimulated with TNF and transfected with Con (A) or BMPR2 siRNA (B). Western immunoblot for 40S and 60S ribosomal subunit proteins (S6 and L13a, respectively) was performed for each fraction of the sucrose gradient. GM-CSF and GAPDH mRNA were measured by qRT-PCR and expressed as the percentage of mRNA in all fractions. Fractions 1–7 lack ribosomes or contain ribosome subunits only (termed untranslated in the text). Fractions 8–11 contain light-weight polysomes (moderately translated). Fractions 12–15 contain heavy polysomes (actively translated). The experiment in A and B was repeated four times. (C and D) Bars represent mean ± SEM for n = 3 experiments. *, P < 0.05 versus TNF-stimulated and transfected with Con siRNA, all using one-way ANOVA with Bonferroni’s multiple comparison test. (E) GM-CSF relative to GAPDH mRNA levels was assessed in BMPR2 siRNA (B)– and control siRNA (Con)–treated cells after TNF stimulation as described in the Materials and methods at the indicated time points after DRB to assess changes in mRNA stability. Symbols represent mean ± SEM of n = 4 assessed by ANOVA.
Figure 3.
Figure 3.
Reduced BMPR2 induces sustained activation of p38 and MK-2. (A) Representative Western immunoblots for BMPR2, p-p38, total p38, p-MK2, total MK2, p–I-κB, and total I-κB in PAECs transfected with BMPR2 siRNA (“B”) or control siRNA (Con), 10, 30, and 60 min after stimulation with 10 ng/ml TNF. (B–D) Densitometric analysis of the immunoreactive bands for p38 (B), MK-2 (C), and I-κB (D). Bars are means ± SEM for n = 3 experiments. *, P < 0.05 versus unstimulated control; †, P < 0.05 versus cells transfected with Con siRNA, using ANOVA with Bonferroni’s multiple comparison test. (E and F) 24 h after transfection, PAECs were pretreated for 30 min with 3 µM SB202190 or DMSO and then stimulated with 10 ng/ml TNF or vehicle (saline). (E) Representative immunoblot for p-MK2 levels 30 min after TNF. (F) GM-CSF by ELISA, 6 h after treatment with TNF or vehicle. Bars are mean ± SEM for n = 4 experiments. *, P < 0.05 versus unstimulated control; †, P < 0.05 versus stimulated Con siRNA (Con); ‡, P < 0.05 SB202190 versus DMSO pretreated, all by ANOVA with Bonferroni’s multiple comparison test.
Figure 4.
Figure 4.
Reduced BMPR2 inhibits eIF2α phosphorylation in a p-p38– and PP1-dependent manner. (A) PAECs were transfected with BMPR2 (“B”) or control siRNA (Con) and harvested either before (0) or 30 and 60 min after TNF stimulation. Phosphorylation of the α subunit of eIF2α analyzed by Western immunoblot is shown above with densitometry below. Bars are mean ± SEM for n = 3 experiments. *, P < 0.05 versus unstimulated control; †, P < 0.05 versus cells transfected with Con siRNA under the same condition by ANOVA with Bonferroni’s multiple comparison test. (B) 24 h after transfection with B or Con siRNA, PAECs were pretreated with 3 µM SB202190 or DMSO (vehicle) for 30 min before stimulation with 10 ng/ml TNF. 60 min later, phosphorylation of eIF2α was analyzed by Western immunoblot and densitometric analysis. (C) Representative immunoblots of GADD34 and PP1 60 min after TNF treatment in the presence or absence of the p-p38 inhibitor SB202190. (D) PP1 was immunoprecipitated, and GADD34 was measured by Western immunoblot and normalized for tubulin in the initial sample. (E) 24 h after B or Con siRNA, PAECs were pretreated with 75 µM Salubrinal or DMSO (vehicle) for 30 min before adding 10 ng/ml TNF; 60 min later, p-eIF2α was assessed. (F) Secreted GM-CSF by ELISA 6 h after TNF in the presence or absence of Salubrinal. For B, D, and E, bars are mean ± SEM for n = 3 experiments; for F, n = 4 experiments. *, P < 0.05 versus Con siRNA untreated; †, P < 0.05 versus DMSO (vehicle)-treated cells transfected with BMPR2 siRNA by ANOVA with Bonferroni’s multiple comparison test. (G) Representative Western immunoblot for BMPR2 and PPI after control, PPI, BMPR2 (B), and PPI + BMPR2 (PPI + B) siRNA. (H) Secreted GM-CSF levels by ELISA 6 h after TNF stimulation. Bars are mean ± SEM for n = 4. *, P < 0.05 versus Con siRNA; †, P < 0.05 versus BMPR2 siRNA.
Figure 5.
Figure 5.
Stress granule formation was inhibited by reduced BMPR2. (A–F) 24 h after transfection with control siRNA (Con; A, C, and E) or siRNA for BMPR2 (“B”; B, D, and F) PAECs were stimulated with 10 ng/ml TNF or vehicle for 3 h or with 0.5 mM arsenite for 45 min. Cells were fixed in 4% paraformaldehyde and incubated with mouse monoclonal anti-HuR and goat polyclonal anti–TIA-1 antibodies (1:200) labeled with Alexa Fluor 488 (for HuR)–conjugated anti–mouse and Alexa Fluor 594 (for TIA-1)–conjugated anti–goat secondary antibodies. DAPI was used to label cell nuclei. (A–F) Representative confocal images of vehicle-treated cells (A and B), TNF-treated cells (C and D), and arsenite-treated cells (E and F) with high-magnification insets showing double immunofluorescent stress granules in the cytoplasm. Bar, 20 µm. (G and H) Quantification of stress granule (SG) formation. Cells with stress granules were counted in three randomly chosen microscopic fields (×200). Bars are the mean ± SEM of four different experiments. *, P < 0.05 versus unstimulated control; †, P < 0.05 versus cells transfected with control siRNA under the same condition by ANOVA with Bonferroni’s multiple comparison test (G) or unpaired Student’s t test (H). (I–N) A similar experiment with G3BP as the readout for stress granule formation with vehicle (I and L), TNF (J and M), and 1% hypoxia for 3 h (K and N). High-magnification insets are shown. Same scale as in A–F. (O and P) Percentage of cells with stress granules was calculated as described for G and H. Bars are the mean ± SEM for n = 4. *, P < 0.05 versus control siRNA; and †, P < 0.05 versus control siRNA under the same condition, by ANOVA and Bonferroni’s multiple comparison test (O) or unpaired Student’s t test (P).
Figure 6.
Figure 6.
Increased GM-CSF protein in lungs of IPAH patients versus unused donor control lungs. (A) Representative immunoblots for GM-CSF using lung tissue from five IPAH patients and five unused donor control lungs. (B) Densitometric analysis of Western immunoblots for GM-CSF from lung tissue of 10 IPAH patients and 8 controls. Bars are mean ± SEM. *, P < 0.05 versus unused donor control lungs by unpaired Student’s t test. (C–F) Representative immunohistochemistry for GM-CSF, CD34, α-SM–actin, and TNF in a PA from a control (C) and IPAH lung (D–F): PA intima thickness (D), a distal small PA (E), and plexiform (F). Bars: (C and D) 100 µm; (E) 50 µm; (F) 250 µm. Co-distribution of intense immunoreactivity for GM-CSF and TNF is seen in the endothelium, intima, and media of the IPAH vessel wall.
Figure 7.
Figure 7.
GM-CSFR–positive cells are expanded in IPAH lungs. (A–C) Immunohistochemistry for GM-CSFRα, CD31, and CD68. (A) PA from control. (B) PA intima thickness. (C) Plexiform. Boxed areas are shown at higher magnification in the panels on the right. Bars (A) 100 µm; (B, left) 200 µm; (C, left) 500 µm; (B and C, right) 25 µm. Co-distribution of GM-CSFRα immunoreactivity and CD31-positive cells lining the vessel lumen and that are CD68 positive in the neointima. (D) Representative FACS analysis of freshly isolated cells from the lung tissues of an unused donor (left) and an IPAH patient (right) and sorted for immunofluorescence using CD31 and GM-CSFRα antibodies as described in the Materials and methods. (E) Percentage of CD31+GM-CSFRα+ cells in IPAH versus unused donor control lungs. Bars indicate mean ± SEM. n = 3; *, P < 0.05 determined by unpaired Student’s t test. (F) Microfluidic-based single cell transcriptional analysis of CD31+GM-CSFRα+ cells pooled from three IPAH patients. Gene expression is represented on a color scale from yellow (high) to blue (low). Gene expression data for individual cells are oriented in vertical columns. Two subpopulations are evident: endothelial (high expression of endothelial/vascular genes; cluster 1, 46% of cells) and hematopoietic (high expression of monocyte/macrophage markers; cluster 2, 54% of cells).
Figure 8.
Figure 8.
GM-CSF exacerbates pulmonary hypertension induced by hypoxia in mice, and anti–GM-CSF reverses it. C57BL/6 mice were exposed to hypoxia (10% oxygen) or kept in room air for 3 wk. Mice were injected with 0.4 µg/µl murine GM-CSF or saline, 5 d per week for 3 wk. In the second experiment, mice were exposed to hypoxia and treated with continuous s.c. anti–GM-CSF or 7 µg/ml isotype control as described in the Materials and methods. (A) RVSP. (B) Ratio of the RV to the LV plus septum. (C) Representative photomicrographs of barium-filled 15–50-µm alveolar wall and duct (distal) PAs. Muscularity of the distal PA was assessed by Movat pentachrome method (top) and immunostaining with α-SM–actin (bottom). Arteries are nonmuscular (N), partially muscular (P), or fully muscular (M), as described in Materials and methods. Room air distal arteries are mostly nonmuscular, whereas hypoxia vessels are mostly partially muscular and with GM-CSF treatment mostly fully muscular. (D) Percentage of N, P, and M arteries described in C was calculated for each group. In the anti–GM-CSF versus isotype control experiment M + P were pooled (M). (E) Distal PAs per 100 alveoli were counted in six randomly chosen lung fields per mouse, and the ratio was calculated comparing GM-CSF– and saline vehicle–injected control. (F) Representative immunostaining of lung tissue with the mouse macrophage marker Mac-3. Bars: (C) 50 µm; (F) 25 µm. (G) Mac-3+ cells associated with the distal PAs were counted, and the means were calculated per mouse. For A, B, D, E, and G, bars represent mean ± SEM for n indicated in the panels (in the anti–GM-CSF experiment; n = 5 for isotype control and n = 7 for anti–GM-CSF). *, P < 0.05 versus room air control; †, P < 0.05 versus hypoxic mice injected with saline by one-way ANOVA with Bonferroni’s multiple comparison test; and ###, P < 0.001 versus isotype IgG control by Student’s t test. (H) Rats were injected with saline or 60 mg/kg of the toxin monocrotaline as described in Materials and methods, and GM-CSF mRNA relative to β-actin was assessed on days 0 and 21 in the saline controls and on days 2, 7, 14, and 21 in the monocrotaline group. A and B represent triplicate measurements in two different rats. Note values increase on day 14 by more than twofold relative to all other time points. Bars shown mean ± SEM.

References

    1. Alastalo T.P., Li M., Perez V.J., Pham D., Sawada H., Wang J.K., Koskenvuo M., Wang L., Freeman B.A., Chang H.Y., Rabinovitch M. 2011. Disruption of PPARγ/β-catenin-mediated regulation of apelin impairs BMP-induced mouse and human pulmonary arterial EC survival. J. Clin. Invest. 121:3735–3746 10.1172/JCI43382 - DOI - PMC - PubMed
    1. Anderson P., Kedersha N. 2008. Stress granules: the Tao of RNA triage. Trends Biochem. Sci. 33:141–150 10.1016/j.tibs.2007.12.003 - DOI - PubMed
    1. Anderson P., Kedersha N. 2009. RNA granules: post-transcriptional and epigenetic modulators of gene expression. Nat. Rev. Mol. Cell Biol. 10:430–436 10.1038/nrm2694 - DOI - PubMed
    1. Asosingh K., Aldred M.A., Vasanji A., Drazba J., Sharp J., Farver C., Comhair S.A., Xu W., Licina L., Huang L., et al. 2008. Circulating angiogenic precursors in idiopathic pulmonary arterial hypertension. Am. J. Pathol. 172:615–627 10.2353/ajpath.2008.070705 - DOI - PMC - PubMed
    1. Atkinson C., Stewart S., Upton P.D., Machado R., Thomson J.R., Trembath R.C., Morrell N.W. 2002. Primary pulmonary hypertension is associated with reduced pulmonary vascular expression of type II bone morphogenetic protein receptor. Circulation. 105:1672–1678 10.1161/01.CIR.0000012754.72951.3D - DOI - PubMed

Publication types

MeSH terms

Substances