

Review
doi: 10.1021/cr4005988.
Epub 2014 Jan 21.
Collective variable approaches for single molecule flexible fitting and enhanced sampling
Affiliations
- PMID: 24446720
- PMCID: PMC3983124
- DOI: 10.1021/cr4005988
Item in Clipboard
Review
Collective variable approaches for single molecule flexible fitting and enhanced sampling
Chem Rev.
.
No abstract available
Figures
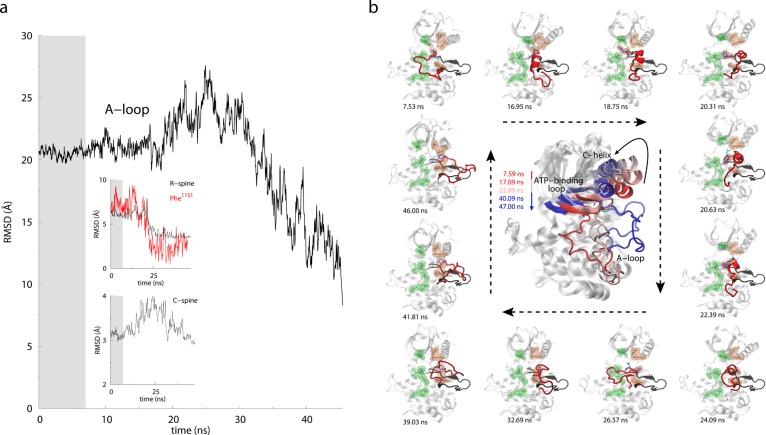
TAMD-generated conformational
change in the activation loop of
the insulin receptor kinase domain. (a) RMSD versus simulation time
(ns) for the activation-loop (the A-loop), R-spine, C-spine, and Phe1151 with respect to the active crystal structure. Gray background
in the plots indicates first ∼7 ns of MD equilibration, which
is followed by ∼40 ns of TAMD. (b) Representative snapshots
of IRKD from TAMD simulation are shown at various time-points with
the A-loop in red, side-chains of Asp1150 and Phe1151 in cyan and blue, respectively. The conformation of the A-loop in
the active crystal structure is shown as a black cartoon. The large
panel in the center shows the conformations of IRKD with highlighted
structural motifs: αC-helix, nucleotide-binding loop, and the
activation loop from TAMD simulation at t = 7.59
(red), 17.09, 22.89, 40.09, and 47.00 ns (blue). Arrow directions
guide along the increasing simulation time. Adapted with permission
from ref (167). Copyright
2012 Elsevier.
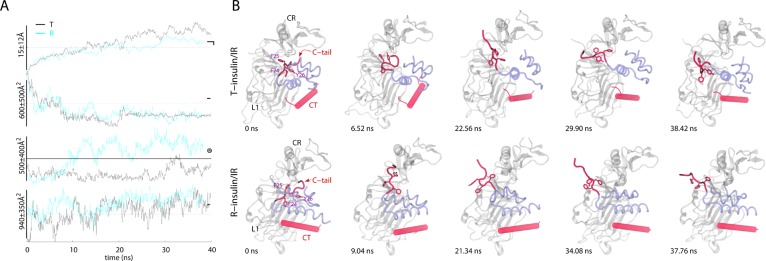
TAMD-generated conformational
change in the C-terminus of the B-chain
of each insulin. (A) Traces (T-insulin, black; R-insulin, cyan) of
the root-mean-squared deviation (RMSD) and buried surface area (BSA)
versus simulation time (ns) are shown for each insulin/IRΔβ
complex. Circled digits indicate the following: (①) RMSD of
the C-terminus (residue B21–B30) of the B-chain of each insulin.
For RMSD computation, the insulin molecules were aligned based upon
the residues of each A- and B-chain (A1–A21 and B1–B20;
Cα); (②) BSA between the C-terminus of the
B-chain (residues B21–B30) of each insulin and rest of the
insulin molecules; (③) BSA between each insulin molecule (except
the B-chain residues B21–B30) and the L1 domain; and (④)
BSA between CT and the L1 domain. Horizontal lines indicate the values
measured in the IRΔβ crystal structure (PDB code 3LOH) except the dotted
horizontal lines that are arbitrarily drawn for guidance. (B) Conformational
change in the C-terminus of the B-chain of each insulin is highlighted.
Representative snapshots of each insulin (transparent blue), CT (transparent
red), and the L1 and CR domains of IRΔβ (transparent white)
are shown at various time-points of respective TAMD simulations. The
residues FB24, FB25, and YB26 are
shown in sticks and labeled in the first snapshot for each insulin/IRΔβ
complex. Initial positions of CT are different (from the crystal structure)
for each insulin/IRΔβ complex because TAMD trajectories
were started based upon the Monte Carlo (MC) docked and MD-equilibrated
structural models of each insulin/IRΔβ complex. Some of
the terminal residues of CT spontaneously fold/unfold during TAMD
trajectories. Adapted with permission from ref (169). Copyright 2013 John
Wiley & Sons, Inc.
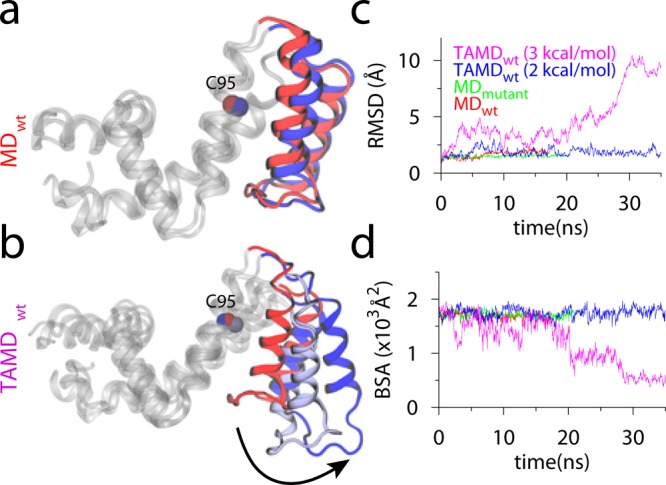
MD and TAMD simulation data for RGS4 runs with initial coordinates
from PDB code 1AGR. (a and b) Overlay of cartoon representations of apo-RGS4 (red,
beginning; blue, end of simulations). All helices of RGS4, except
the α5–α6 pair, are shown
in white cartoons. (c) The Cα-RMSD traces with reference
to starting conformations. (d) Buried surface area (BSA) between the
α5–α6 helix pair and the
rest of RGS4. Adapted with permission from ref (170). Copyright 2013 American
Chemical Society.
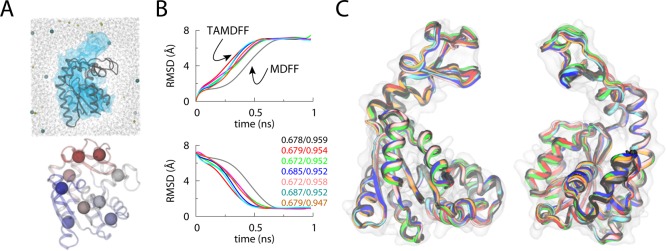
MDFF versus TAMD-assisted MDFF (TAMDFF) fitting
of adenylate kinase
in explicit solvent. (A; top panel) Schematic representation of the
simulation domain (29416 atoms) of the adenylate kinase (ADK) as viewed
along the z-axis: starting docked closed-conformation
of ADK (black cartoon), 5 Å resolution target map (blue surface),
water molecules (wireframe), and ions (spheres). (A; bottom panel)
Subdomain partitions of ADK are shown for the TAMD simulation. Each
sphere represents the center-of-mass (COM) of a mutually exclusive
subdomain. Entire ADK structure was divided into 9 subdomains. (B)
Top and bottom panels, respectively, show the Cα-RMSD
traces from the known initial and final crystal conformations of ADK.
The black trace is from an MDFF simulation, while the traces of other
color are from six independent TAMD-assisted MDFF (TAMDFF) simulations.
Initial/final correlation coefficients for all seven simulations are
shown in the bottom panel. (C) Cartoon representations of two different
views of the overlay of final conformations generated via MDFF and
TAMDFF simulations are shown. Cartoon colors are the same as the RMSD
traces in panel B. Adapted with permission from ref (111). Copyright 2012 Elsevier.
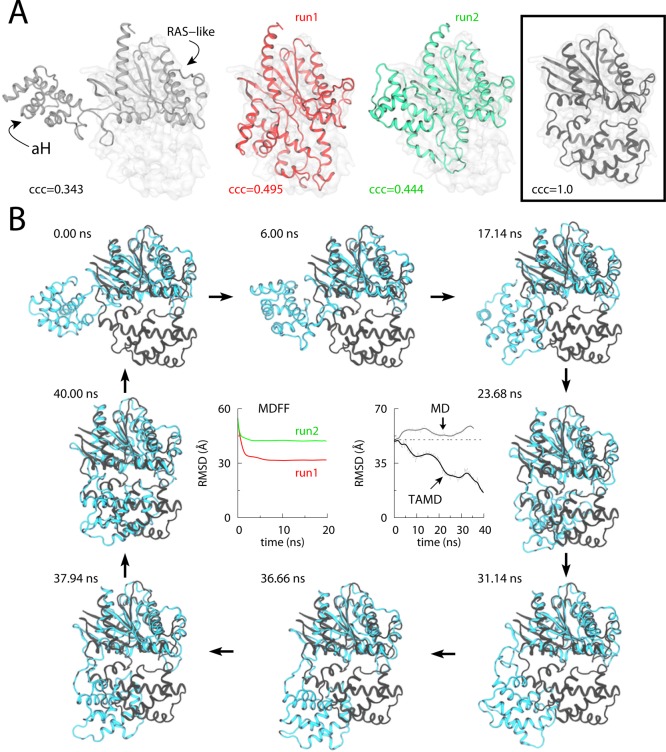
Conformational change in the Gα-subunit of a GTP-binding
protein (G-protein) studied via MDFF and TAMD simulations. (A) Cartoon
representations for MDFF fitting of Gα at 5 Å
target-map resolution: initial docked open-state crystal conformation
(white cartoon; left panel), final conformations generated via two
independent 20-ns MDFF simulations (red and green cartoons; middle
panels), and the known target closed-state crystal conformation with
perfect correlation coefficient of 1.0 (black cartoon; boxed right-most
panel). The Cα-RMSD (with respect to the final crystal
structure) traces for each 20-ns MDFF run are shown in panel B. (B)
Representative snapshots from a 40-ns TAMD simulation of Gα are shown at various time-points during the simulation. TAMD-generated
conformation is shown in cyan, and the known closed-state crystal
structure conformation is in black. The Cα-RMSD (with
respect to the final crystal structure) trace from the ∼40-ns
TAMD simulation is shown in the central right-panel along with the
RMSD trace from an unbiased ∼36-ns explicit-solvent MD simulation
of Gα. Adapted with permission from ref (111). Copyright 2012 Elsevier.
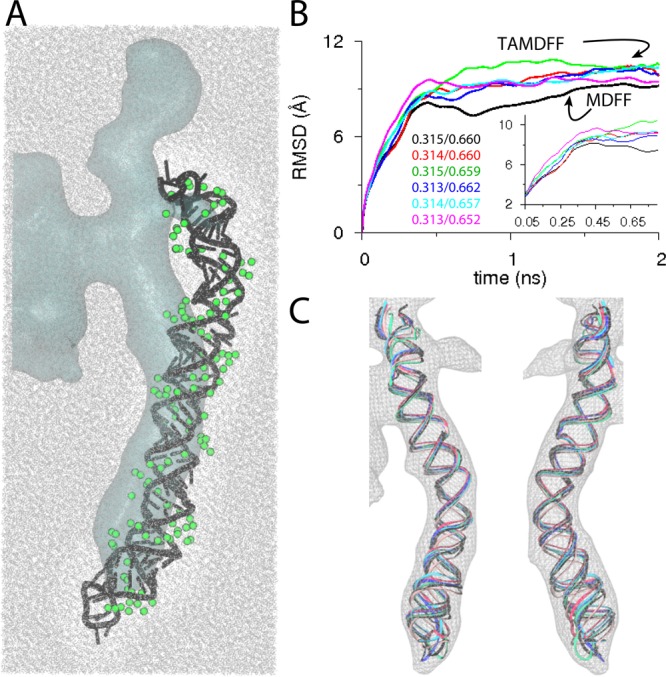
Explicit-solvent MDFF versus TAMDFF fitting
of helix-44 (H44) from
the mature small (40S) eukaryotic ribosomal subunit into an experimental map of a pre-40S maturation intermediate. (A) Schematic representation of the simulation
domain (208390 atoms) of solvated H44 as viewed along the z-axis: starting docked conformation of H44 (black cartoon),
∼18 Å resolution target map (cyan surface), water molecules
(wireframe), and Mg2+ ions (green spheres). The additional
globular blobs of density near H44 are from some accessory factor
proteins (not modeled here). (B) The backbone (P-atoms) RMSD traces
from the known initial crystal conformation of H44 (PDB code 3U5F). The black trace
is from an MDFF simulation, while the traces of other color are from
five independent TAMDFF simulations. Initial/final correlation-coefficients
for all six simulations are also shown. Inset highlights the RMSD
traces in early parts of MDFF and TAMDFF simulations. (C) Map-docked
cartoon representations are shown for two different views of the overlay
of final conformations generated via MDFF and TAMDFF simulations.
Adapted with permission from ref (112). Copyright 2013 American Chemical Society.
Similar articles
-
A quantitative model of thermal stabilization and destabilization of proteins by ligands.Biophys J. 2008 Oct;95(7):3222-31. doi: 10.1529/biophysj.108.134973. Epub 2008 Jul 3. Biophys J. 2008. PMID: 18599640 Free PMC article.
-
A novel two-site binding equation presented in terms of the total ligand concentration.FEBS Lett. 1996 Sep 2;392(3):245-9. doi: 10.1016/0014-5793(96)00818-6. FEBS Lett. 1996. PMID: 8774854
-
Rational design of affinity peptide ligand by flexible docking simulation.J Chromatogr A. 2007 Mar 30;1146(1):41-50. doi: 10.1016/j.chroma.2007.01.130. Epub 2007 Feb 4. J Chromatogr A. 2007. PMID: 17298835
-
Computational approaches to molecular recognition.Curr Opin Chem Biol. 1997 Dec;1(4):449-57. doi: 10.1016/s1367-5931(97)80038-5. Curr Opin Chem Biol. 1997. PMID: 9667895 Review.
-
New approaches for computing ligand-receptor binding kinetics.Curr Opin Struct Biol. 2018 Apr;49:1-10. doi: 10.1016/j.sbi.2017.10.001. Epub 2017 Nov 11. Curr Opin Struct Biol. 2018. PMID: 29132080 Review.
Cited by
-
All-Atom Structural Models of the Transmembrane Domains of Insulin and Type 1 Insulin-Like Growth Factor Receptors.Front Endocrinol (Lausanne). 2016 Jun 20;7:68. doi: 10.3389/fendo.2016.00068. eCollection 2016. Front Endocrinol (Lausanne). 2016. PMID: 27379020 Free PMC article.
-
Internal force corrections with machine learning for quantum mechanics/molecular mechanics simulations.J Chem Phys. 2017 Oct 28;147(16):161732. doi: 10.1063/1.5006882. J Chem Phys. 2017. PMID: 29096448 Free PMC article.
-
Theoretical and computational studies of peptides and receptors of the insulin family.Membranes (Basel). 2015 Feb 11;5(1):48-83. doi: 10.3390/membranes5010048. Membranes (Basel). 2015. PMID: 25680077 Free PMC article. Review.
-
Structural and computational studies of HIV-1 RNA.RNA Biol. 2024 Jan;21(1):1-32. doi: 10.1080/15476286.2023.2289709. Epub 2023 Dec 15. RNA Biol. 2024. PMID: 38100535 Free PMC article. Review.
References
Publication types
MeSH terms
Substances
Grants and funding
LinkOut - more resources
Full Text Sources
Other Literature Sources
