

Assembling a geospatial database of tsetse-transmitted animal trypanosomosis for Africa
- PMID: 24447638
- PMCID: PMC4015763
- DOI: 10.1186/1756-3305-7-39
Assembling a geospatial database of tsetse-transmitted animal trypanosomosis for Africa
Abstract
Background: African animal trypanosomosis (AAT), or nagana, is widespread within the tsetse-infested belt of sub-Saharan Africa. Although a wealth of information on its occurrence and prevalence is available in the literature, synthesized and harmonized data at the regional and continental scales are lacking. To fill this gap the Food and Agriculture Organization of the United Nations (FAO) launched the Atlas of tsetse and AAT, jointly implemented with the International Atomic Energy Agency (IAEA) in the framework of the Programme Against African Trypanosomosis (PAAT).
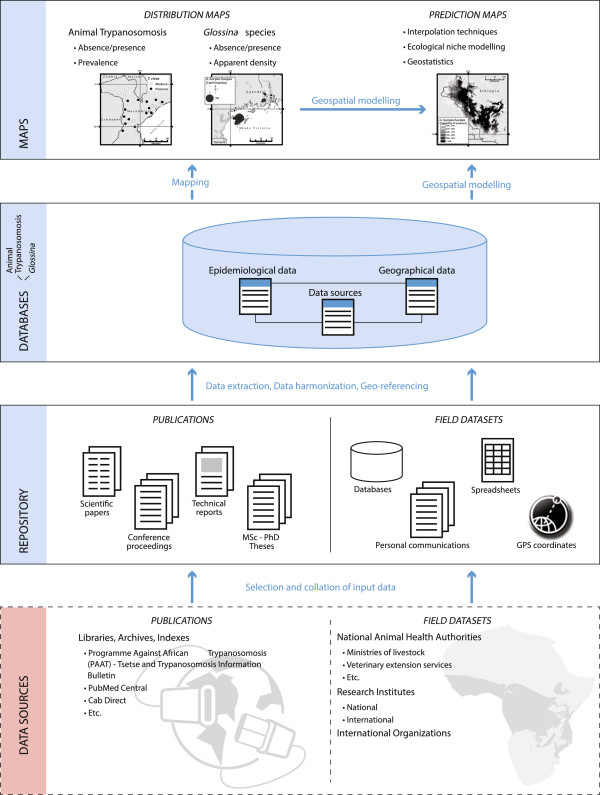
Methods: The Atlas aims to build and regularly update a geospatial database of tsetse species occurrence and AAT at the continental level. The present paper focuses on the methodology to assemble a dynamic database of AAT, which hinges on herd-level prevalence data as estimated using various diagnostic techniques. A range of ancillary information items is also included (e.g. trypanosome species, survey period, species and breed of animals, husbandry system, etc.). Input data were initially identified through a literature review.
Results: Preliminary results are presented for Ethiopia, Kenya and Uganda in East Africa: 122 papers were identified and analyzed, which contained field data collected from January 1990 to December 2013. Information on AAT was extracted and recorded for 348 distinct geographic locations. The presented distribution maps exemplify the range of outputs that can be directly generated from the AAT database.
Conclusions: Activities are ongoing to map the distribution of AAT in all affected countries and to develop the tsetse component of the Atlas. The presented methodology is also being transferred to partners in affected countries, with a view to developing capacity and strengthening data management, harmonization and sharing. In the future, geospatial modelling will enable predictions to be made within and beyond the range of AAT field observations. This variety of information layers will inform decisions on the most appropriate, site-specific strategies for intervention against AAT. Data on the occurrence of human-infective trypanosomes in non-human hosts will also provide valuable information for sleeping sickness control and elimination.
Introduction: La trypanosomose animale africaine (TAA), aussi appelée nagana, est largement répandue dans les zones d’Afrique sub-saharienne infestées par les glossines. Malgré la grande quantité d’informations disponibles dans la littérature sur sa répartition et prévalence, les données synthétisées et harmonisées aux niveaux régional et continental sont inexistantes. Pour faire face à ce problème, l’Organisation des Nations Unies pour l’alimentation et l’agriculture (FAO) a ouvert un chantier sur l’Atlas des glossines et de la TAA, exécuté conjointement avecl’Agence Internationale de l’Energie Atomique (AIEA) dans le cadre du Programme de Lutte contre la Trypanosomose Africaine (PLTA).
Méthodes: L’Atlas vise à créer et mettre à jour régulièrement une base de données spatialisée au niveau continental sur l’infection trypanosomienne animale et sur les différentes espèces de glossine. Cet article se concentre sur la méthodologie pour développer une base de données dynamique de la TAA, qui repose sur des données de prévalence au niveau du troupeau estimée par différentes techniques de diagnostic. Plusieurs informations supplémentaires sont incluses (ex. espèce de trypanosomes, date de collecte des données, espèce et race des animaux et système d’élevage, etc.). Dans une première phase de développement, les données à utiliser ont étés identifiées à travers un examen systématique de la littérature publiée.
Résultats: Cet article présente les résultats préliminaires pour l’Ethiopie, le Kenya et l’Ouganda en Afrique de l’Est : 124 articles ont été identifiés et analysés, qui contiennent des données de terrain collectées entre Janvier 1990 et Décembre 2013. Les informations sur la TAA ont été extraites et enregistrées pour 348 localités différentes. Les cartes de répartition ici présentées donnent un exemple des couches d’information pouvant être générées directement à travers l’Atlas.
Conclusions: Les activités sont en cours pour cartographier la TAA dans tous les pays affectés, et pour développer la composante ‘glossines’ de l’Atlas. La méthodologie ici présentée est en train d’être transférée aux partenaires dans les pays affectés, dans le but de développer les capacités et de renforcer la gestion, l’harmonisation et le partage des données. Dans le futur, la modélisation géospatiale permettra de faire des prédictions soit à l'intérieur soit au-delà des observations de terrain. Cet éventail de couches d’information doit éclairer les décisions sur les stratégies d’intervention contre la TAA les plus appropriées pour chaque site. Les données sur l’infection des animaux avec des trypanosomes zoonotiques seront également de grande valeur pour la lutte et l’élimination de la maladie du sommeil.
Figures


References
-
- Taylor K, Authié EM-L. In: The Trypanosomiases. Maudlin I, Holmes P, Miles M, editor. Wallingford, UK: CABI Publishing; 2004. Pathogenesis of Animal Trypanosomiasis; pp. 331–353.
-
- Cecchi G, Mattioli RC. In: Geospatial datasets and analyses for an environmental approach to African trypanosomiasis. Cecchi G, Mattioli RC, editor. Rome: Food and Agriculture Organization of the United Nations; 2009. Global geospatial datasets for African trypanosomiasis management: a review; pp. 1–39.
-
- WHO. Technical Report Series. Geneva: World Health Organization; 2013. Control and surveillance of human African trypanosomiasis. - PubMed
Publication types
MeSH terms
LinkOut - more resources
Full Text Sources
Other Literature Sources
Research Materials
Miscellaneous
