

The genome-wide landscape of DNA methylation and hydroxymethylation in response to sleep deprivation impacts on synaptic plasticity genes
- PMID: 24448209
- PMCID: PMC3905230
- DOI: 10.1038/tp.2013.120
The genome-wide landscape of DNA methylation and hydroxymethylation in response to sleep deprivation impacts on synaptic plasticity genes
Abstract
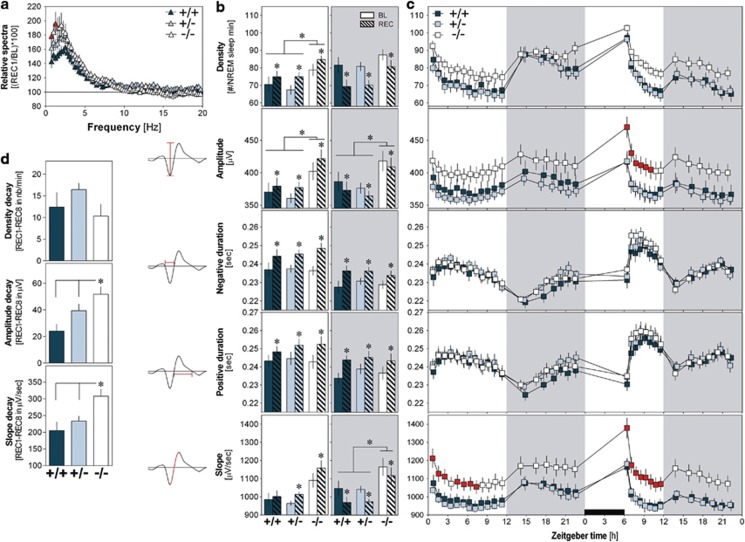
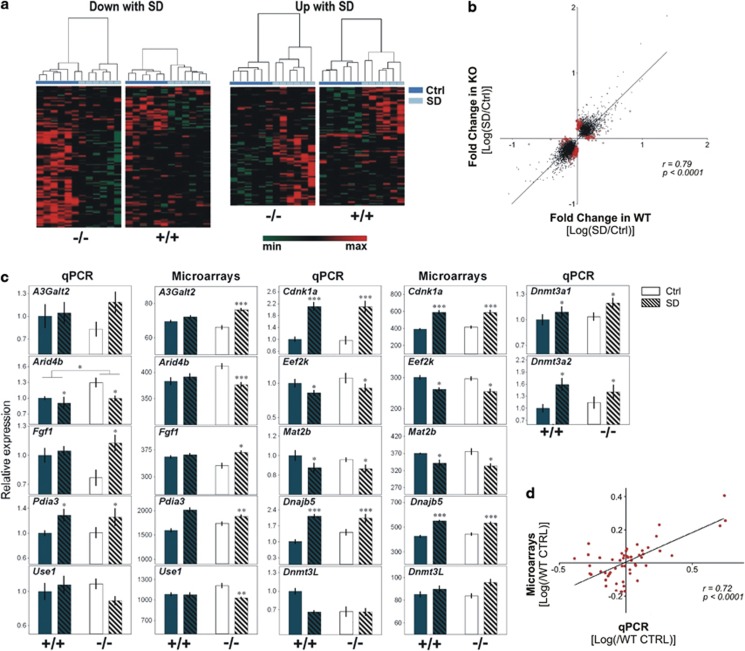
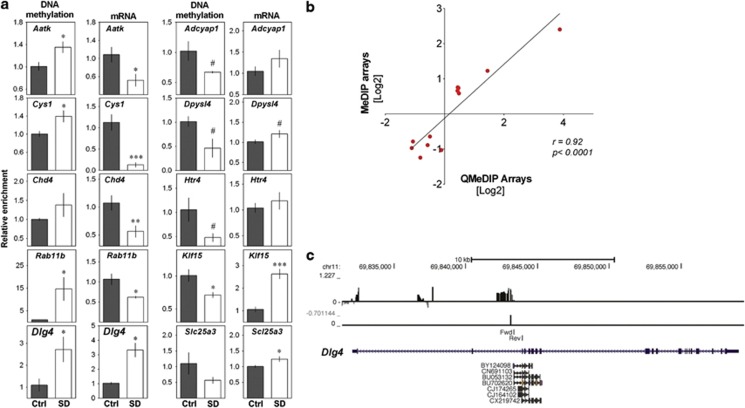
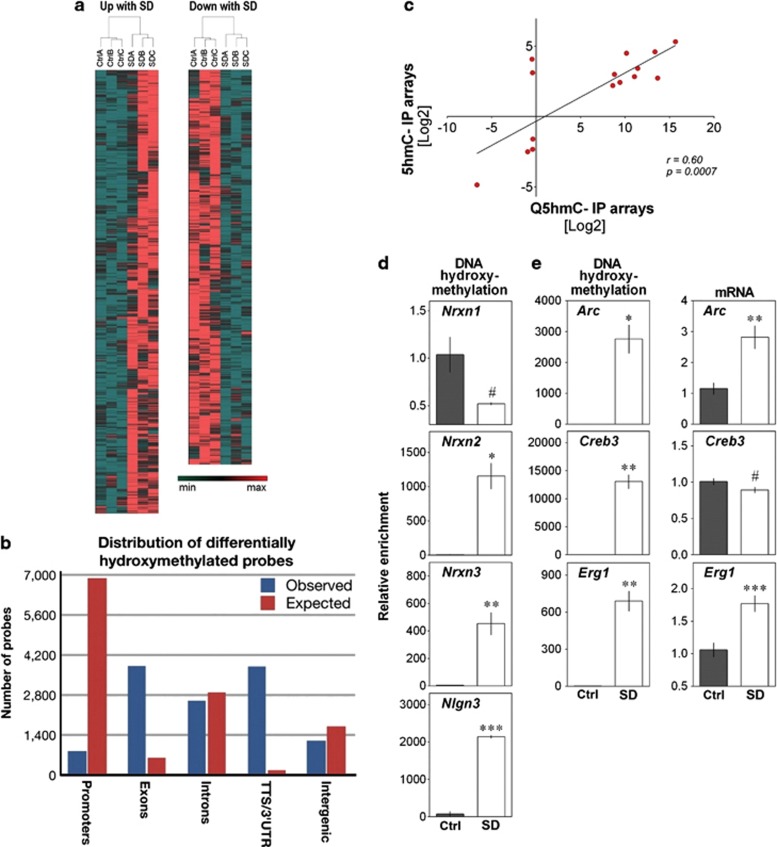
Sleep is critical for normal brain function and mental health. However, the molecular mechanisms mediating the impact of sleep loss on both cognition and the sleep electroencephalogram remain mostly unknown. Acute sleep loss impacts brain gene expression broadly. These data contributed to current hypotheses regarding the role for sleep in metabolism, synaptic plasticity and neuroprotection. These changes in gene expression likely underlie increased sleep intensity following sleep deprivation (SD). Here we tested the hypothesis that epigenetic mechanisms coordinate the gene expression response driven by SD. We found that SD altered the cortical genome-wide distribution of two major epigenetic marks: DNA methylation and hydroxymethylation. DNA methylation differences were enriched in gene pathways involved in neuritogenesis and synaptic plasticity, whereas large changes (>4000 sites) in hydroxymethylation where observed in genes linked to cytoskeleton, signaling and neurotransmission, which closely matches SD-dependent changes in the transcriptome. Moreover, this epigenetic remodeling applied to elements previously linked to sleep need (for example, Arc and Egr1) and synaptic partners of Neuroligin-1 (Nlgn1; for example, Dlg4, Nrxn1 and Nlgn3), which we recently identified as a regulator of sleep intensity following SD. We show here that Nlgn1 mutant mice display an enhanced slow-wave slope during non-rapid eye movement sleep following SD but this mutation does not affect SD-dependent changes in gene expression, suggesting that the Nlgn pathway acts downstream to mechanisms triggering gene expression changes in SD. These data reveal that acute SD reprograms the epigenetic landscape, providing a unique molecular route by which sleep can impact brain function and health.
Figures
Similar articles
-
Impact of traumatic brain injury on sleep structure, electrocorticographic activity and transcriptome in mice.Brain Behav Immun. 2015 Jul;47:118-30. doi: 10.1016/j.bbi.2014.12.023. Epub 2015 Jan 8. Brain Behav Immun. 2015. PMID: 25576803
-
Sleep loss disrupts Arc expression in dentate gyrus neurons.Neurobiol Learn Mem. 2019 Apr;160:73-82. doi: 10.1016/j.nlm.2018.04.006. Epub 2018 Apr 7. Neurobiol Learn Mem. 2019. PMID: 29635031 Free PMC article.
-
Neuroligin-2 shapes individual slow waves during slow-wave sleep and the response to sleep deprivation in mice.Mol Autism. 2024 Apr 3;15(1):13. doi: 10.1186/s13229-024-00594-5. Mol Autism. 2024. PMID: 38570872 Free PMC article.
-
Synaptic plasticity model of therapeutic sleep deprivation in major depression.Sleep Med Rev. 2016 Dec;30:53-62. doi: 10.1016/j.smrv.2015.11.003. Epub 2015 Nov 30. Sleep Med Rev. 2016. PMID: 26803484 Review.
-
Sleep Deprivation and the Epigenome.Front Neural Circuits. 2018 Feb 27;12:14. doi: 10.3389/fncir.2018.00014. eCollection 2018. Front Neural Circuits. 2018. PMID: 29535611 Free PMC article. Review.
Cited by
-
Prospects for the development of epigenetic drugs for CNS conditions.Nat Rev Drug Discov. 2015 Jul;14(7):461-74. doi: 10.1038/nrd4580. Epub 2015 May 22. Nat Rev Drug Discov. 2015. PMID: 26000723 Review.
-
Genetics and epigenetics of circadian rhythms and their potential roles in neuropsychiatric disorders.Neurosci Bull. 2015 Feb;31(1):141-59. doi: 10.1007/s12264-014-1495-3. Epub 2015 Feb 6. Neurosci Bull. 2015. PMID: 25652815 Free PMC article. Review.
-
Sleep-wake-driven and circadian contributions to daily rhythms in gene expression and chromatin accessibility in the murine cortex.Proc Natl Acad Sci U S A. 2019 Dec 17;116(51):25773-25783. doi: 10.1073/pnas.1910590116. Epub 2019 Nov 27. Proc Natl Acad Sci U S A. 2019. PMID: 31776259 Free PMC article.
-
Epigenetics in Neurodevelopment: Emerging Role of Circular RNA.Front Cell Neurosci. 2019 Jul 19;13:327. doi: 10.3389/fncel.2019.00327. eCollection 2019. Front Cell Neurosci. 2019. PMID: 31379511 Free PMC article. Review.
-
From Physiology to Pathology of Cortico-Thalamo-Cortical Oscillations: Astroglia as a Target for Further Research.Front Neurol. 2021 Jun 9;12:661408. doi: 10.3389/fneur.2021.661408. eCollection 2021. Front Neurol. 2021. PMID: 34177766 Free PMC article. Review.
References
-
- Kotagal S, Broomall E. Sleep in children with autism spectrum disorder. Pediatr Neurol. 2012;47:242–251. - PubMed
-
- Hatfield CF, Herbert J, van Someren EJ, Hodges JR, Hastings MH. Disrupted daily activity/rest cycles in relation to daily cortisol rhythms of home-dwelling patients with early Alzheimer's dementia. Brain. 2004;127 ((Pt 5:1061–1074. - PubMed
Publication types
MeSH terms
Substances
Grants and funding
LinkOut - more resources
Full Text Sources
Other Literature Sources
