. 2014 Mar 1;74(5):1338-48.
doi: 10.1158/0008-5472.CAN-13-2357-T. Epub 2014 Jan 21.

Genetic and phenotypic diversity in breast tumor metastases

Affiliations

Genetic and phenotypic diversity in breast tumor metastases

Vanessa Almendro et al. Cancer Res. .

Abstract

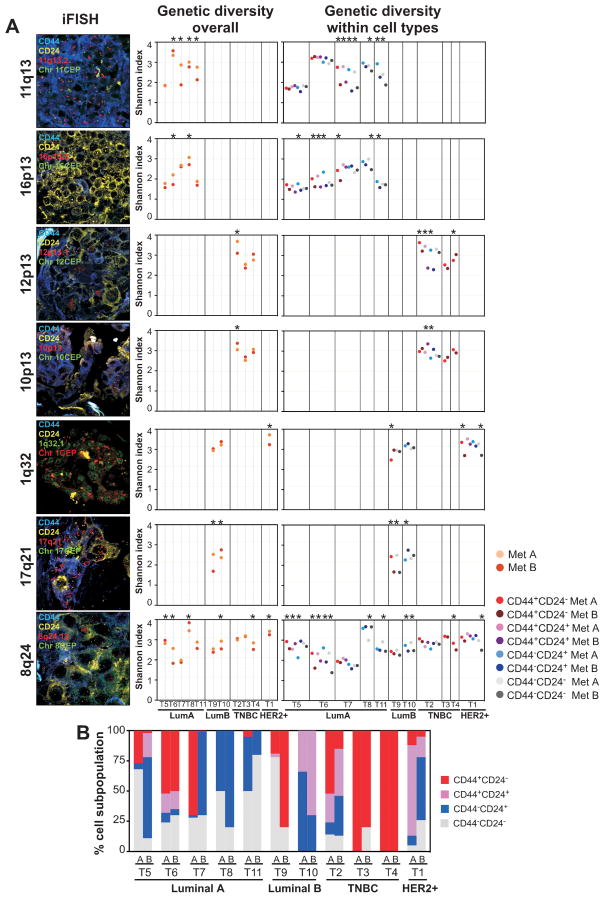
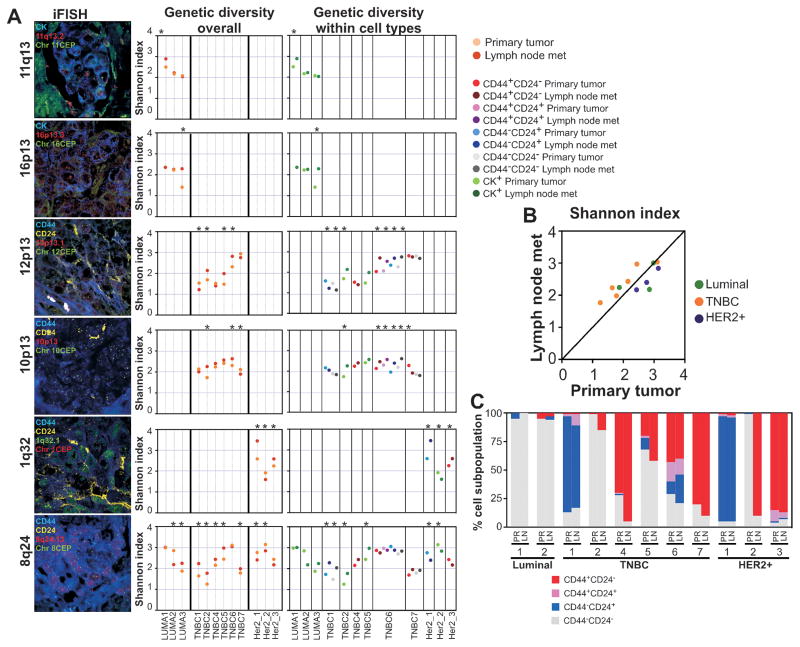
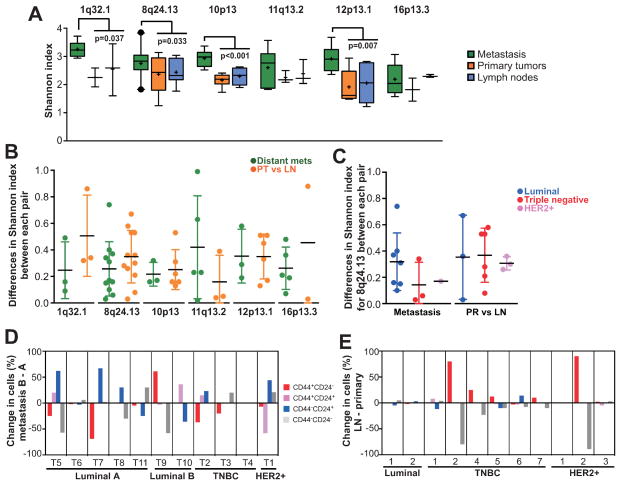
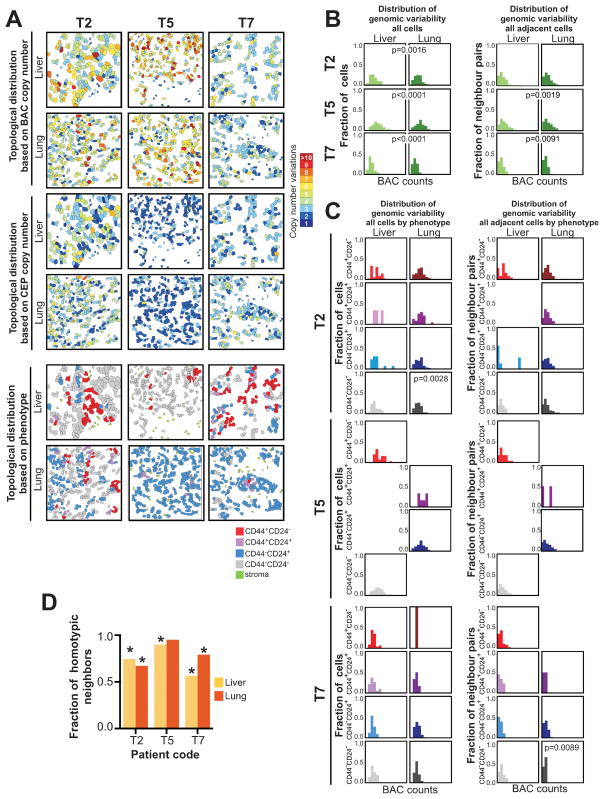
Metastatic disease is the main cause of cancer-related mortality due to almost universal therapeutic resistance. Despite its high clinical relevance, our knowledge of how cancer cell populations change during metastatic progression is limited. Here, we investigated intratumor genetic and phenotypic heterogeneity during metastatic progression of breast cancer. We analyzed cellular genotypes and phenotypes at the single cell level by performing immunoFISH in intact tissue sections of distant metastatic tumors from rapid autopsy cases and from primary tumors and matched lymph node metastases collected before systemic therapy. We calculated the Shannon index of intratumor diversity in all cancer cells and within phenotypically distinct cell populations. We found that the extent of intratumor genetic diversity was similar regardless of the chromosomal region analyzed, implying that it may reflect an inherent property of the tumors. We observed that genetic diversity was highest in distant metastases and was generally concordant across lesions within the same patient, whereas treatment-naïve primary tumors and matched lymph node metastases were frequently genetically more divergent. In contrast, cellular phenotypes were more discordant between distant metastases than primary tumors and matched lymph node metastases. Diversity for 8q24 was consistently higher in HER2(+) tumors compared with other subtypes and in metastases of triple-negative tumors relative to primary sites. We conclude that our integrative method that couples ecologic models with experimental data in human tissue samples could be used for the improved prognostication of patients with cancer and for the design of more effective therapies for progressive disease.


Conflict of interest statement

Potential conflicts of interest: No potential conflicts of interest were disclosed.

Figures

Figure 1
Figure 1. Genetic diversity in distant metastases in the same patient
A, representative images of iFISH for the indicated probes and markers. Dot plots depict Shannon diversity indices calculated based on unique BAC and CEP counts in all cancer cells combined (overall) and in phenotypically distinct tumor cell subpopulations. Dots represent distinct metastatic lesions or phenotypically distinct tumor cell subpopulations within lesions. Asterisks indicate significant (p<0.05, statistical methodology described in Supplementary methods online) differences. Details of tissue samples and Shannon index of diversity calculations are listed in Supplementary Tables S1 and S3–S4, respectively. B, bar graphs depict the relative frequencies of CD44+CD24, CD44+CD24+, CD44CD24+, and CD44CD24 cells in different metastases (A and B) for a given (T1–T11) patient. TNBC - Triple Negative Breast Cancer.
Figure 2
Figure 2. Genetic diversity of matched primary tumors and lymph node metastases
A, representative images of iFISH for the indicated probes and markers. Dot plots depict Shannon diversity indices calculated based on unique BAC and CEP counts in all cancer cells combined (overall) and in phenotypically distinct tumor cell subpopulations. Dots represent primary tumors and lymph node metastases or phenotypically distinct tumor cell subpopulations within these lesions. Asterisks indicate significant (p<0.05, statistical methodology described in Supplementary methods online) differences. Details of tissue samples and Shannon index of diversity calculations are listed in Supplementary Tables S5–S6. B, Differences in Shannon diversity index between primary tumors and matched lymph node metastases according to breast tumor subtype. C, Bar graphs depict the relative frequencies of CD44+CD24, CD44+CD24+, CD44CD24+, and CD44CD24 cells in matched primary tumors and lymph node metastases. TNBC - Triple Negative Breast Cancer.
Figure 3
Figure 3. Differences in diversity between distant and lymph node metastases
A, box plots depict Shannon diversity indices of primary tumors, and lymph node and distant metastases. Boxes show 25th to 75th percentile whereas whiskers extend to 5th and 95th percentiles. Outliers outside of 5th and 95th percentile are shown as black dots. Significant differences by Mann-Whitney test between two distant metastases within the same patient and primary and lymph node metastasis are shown. B, dot plots showing the differences in Shannon index between each pair of distant metastasis or between each pair of primary and lymph node metastasis for the indicated chromosomal regions. C, differences in Shannon index for 8q24.13 in each tumor subtype. Relative changes in the frequency of each of the indicated cell population is shown in metastases (D) and in matched primary tumors and lymph node metastases (E). Details of tissue samples are listed in Supplementary Table S1. PR - primary tumor, LN - lymph node metastasis, TNBC - Triple Negative Breast Cancer.
Figure 4
Figure 4. Analysis of tumor topology
A, maps show topologic differences in the distribution of genetically distinct tumor cells based on copy number for 8q24 BAC, chromosome 8 CEP, and cellular phenotype in liver and lung metastases of three breast cancer patients. B, histograms depicting absolute differences in copy numbers for BAC probe counts regardless of cellular phenotype in all cells or in adjacent cells in liver and lung metastases. C, histograms depicting absolute differences in copy numbers for BAC probe counts in all cells of the same phenotype or in adjacent cells of the same phenotype in liver and lung metastases. D, fraction of adjacent cells with the same phenotype in liver and lung metastases. Significance of the differences was determined by calculating the homotypic fraction for 100,000 iterations of permutation testing over randomized cellular phenotypes; asterisks indicate significant (p<0.05) differences.

Comment in

Similar articles

Cited by

References

    1. Sorlie T, Perou CM, Tibshirani R, Aas T, Geisler S, Johnsen H, et al. Gene expression patterns of breast carcinomas distinguish tumor subclasses with clinical implications. Proc Natl Acad Sci U S A. 2001;98:10869–74. - PMC - PubMed
    1. Fearon ER, Vogelstein B. A genetic model for colorectal tumorigenesis. Cell. 1990;61:759–67. - PubMed
    1. Weng D, Penzner JH, Song B, Koido S, Calderwood SK, Gong J. Metastasis is an early event in mouse mammary carcinomas and is associated with cells bearing stem cell markers. Breast Cancer Res. 2012;14:R18. - PMC - PubMed
    1. Sanger N, Effenberger KE, Riethdorf S, Van Haasteren V, Gauwerky J, Wiegratz I, et al. Disseminated tumor cells in the bone marrow of patients with ductal carcinoma in situ. Int J Cancer. 2011;129:2522–6. - PubMed
    1. Klein CA. Parallel progression of primary tumours and metastases. Nat Rev Cancer. 2009;9:302–12. - PubMed

Publication types