. 2013 Dec;10(12):1853-67.
doi: 10.4161/rna.27361. Epub 2013 Dec 9.

Diversity of human tRNA genes from the 1000-genomes project

Affiliations

Diversity of human tRNA genes from the 1000-genomes project

Marc Parisien et al. RNA Biol. 2013 Dec.

Abstract

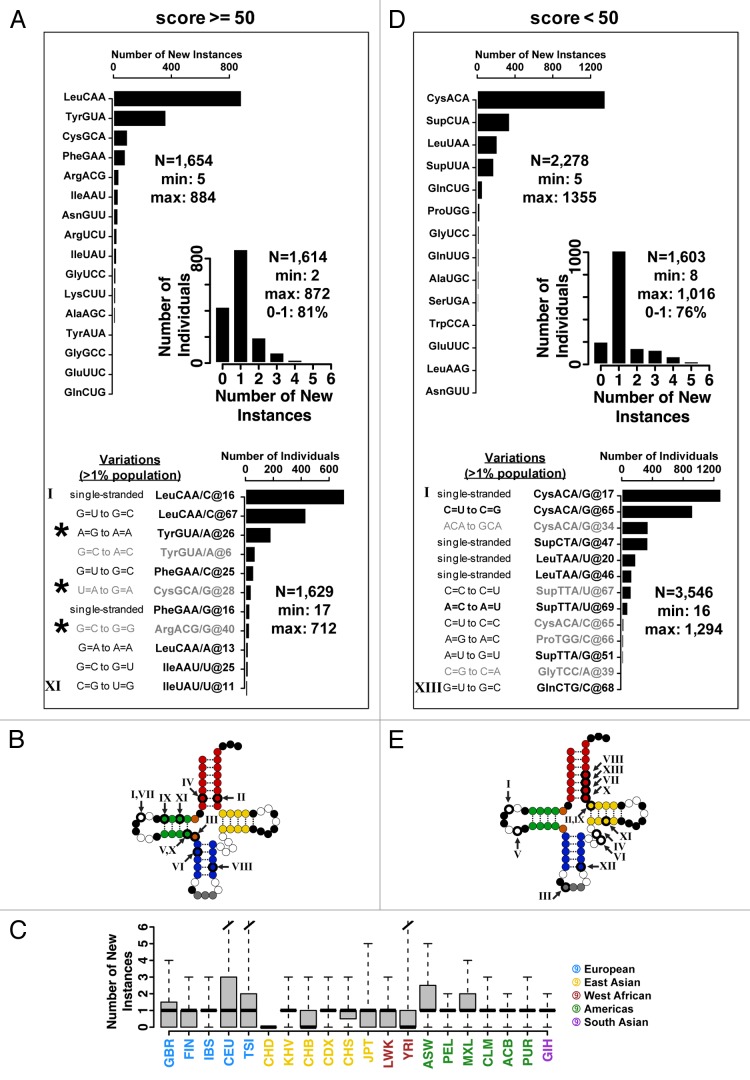
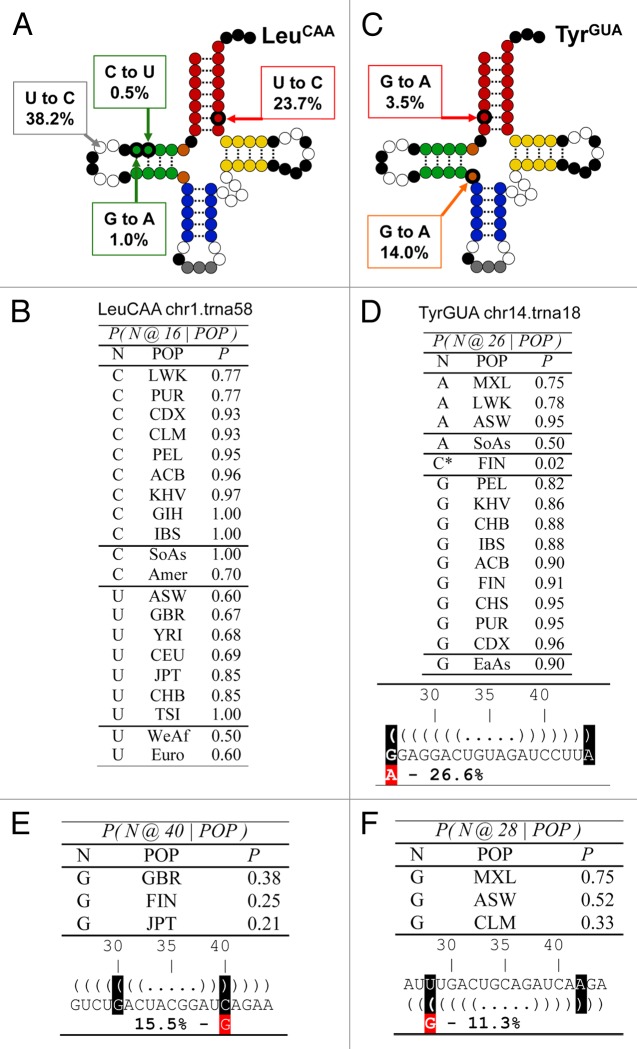
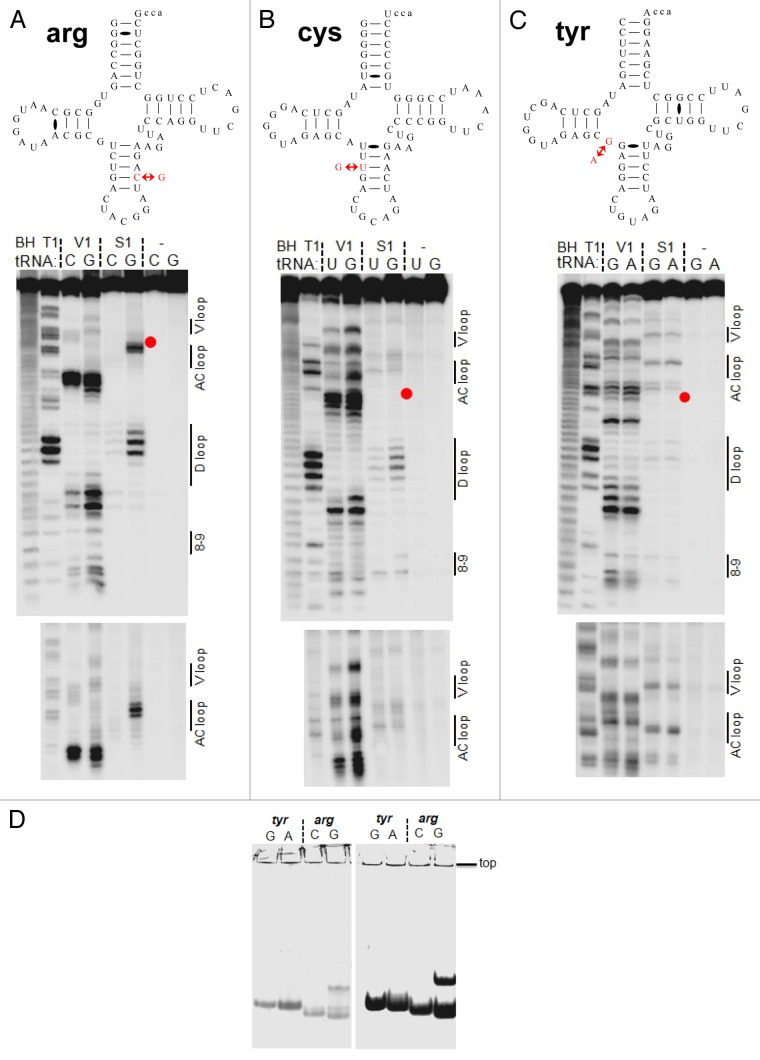
The sequence diversity of individual human genomes has been extensively analyzed for variations and phenotypic implications for mRNA, miRNA, and long non-coding RNA genes. TRNA (tRNA) also exhibits large sequence diversity in the human genome, but tRNA gene sequence variation and potential functional implications in individual human genomes have not been investigated. Here we capitalize on the sequencing data from the 1000-genomes project to examine the diversity of tRNA genes in the human population. Previous analysis of the reference human genome indicated an unexpected large number of diverse tRNA genes beyond the necessity of translation, suggesting that some tRNA transcripts may perform non-canonical functions. We found 24 new tRNA sequences in>1% and 76 new tRNA sequences in>0.2% of all individuals, indicating that tRNA genes are also subject to evolutionary changes in the human population. Unexpectedly, two abundant new tRNA genes contain base-pair mismatches in the anticodon stem. We experimentally determined that these two new tRNAs have altered structures in vitro; however, one new tRNA is not aminoacylated but extremely stable in HeLa cells, suggesting that this new tRNA can be used for non-canonical function. Our results show that at the scale of human population, tRNA genes are more diverse than conventionally understood, and some new tRNAs may perform non-canonical, extra-translational functions that may be linked to human health and disease.

Keywords: 1000 genomes project; SNP; isodecoder; tRNA.


Figures

None
Figure 1. Coverage and sequence mismatch frequencies on selected tRNA genes. Deep sequencing data of DNA of individuals participating in the 1000-genomes project mapped on tRNA genes shows coverage along the gene and highlights sequence mismatches for each gene’s positions. All baseline sequences are from the corresponding tRNA gene sequences in the hg19 reference genome. The coverage is determined by piling up all deep sequencing reads that map to the gene, and shown as vertical black bars. Sequence mismatch frequencies per position are marked by red triangles set at heights proportional to the frequencies: higher red bars indicate higher mismatch frequencies. Five highest mismatched columns are highlighted in green. Selected tRNAs are: (A) tRNALeu(CAA). The well-shaped coverage is due to the fact that only a few tRNALeu genes have introns at positions corresponding to the bottom of the well. (B) tRNATyr(GUA). Greater coverage at the 5′ region of the tRNA gene gives an indication of the degeneracy of that region among the isodecoders. (C) tRNAArg(ACG). (D) tRNACys(GCA).
None
Figure 2. Distribution of new tRNA genes. All reference genome tRNA genes are separated into two groups according to their tRNAscan-SE scores to facilitate analysis. (A–C) Scores ≥50 listed in Table 1; (D–E) Scores <50 listed in Table 2. (A) High-scoring tRNA group. Distribution of new isodecoder instances per isoacceptor family. The most frequently occurring new isodecoder codes for leucine (53%), followed by tyrosine (22%). Only those tRNAs with more than five new instances are shown. Unique new isodecoder instances found in >1% of the population is also shown. Each instance is tagged with a Roman number. The nucleotide positions are adjusted according to the standard tRNA nomenclature. The new genes indicated by a star were tested experimentally for their folding and in vivo charging and stability. (Inset) Distribution of new isodecoder instances among individuals. Over half (54%) of all individuals carry at least one new isodecoder. Most individuals (81%) carry only one or none new isodecoder, while few individuals have as many as 11 new tRNA isodecoders. (B) Sequence change for the 11 new genes that are present in > 1% population mapped onto the canonical tRNA structure. Roman numerals correspond to those of the previous panel. (C) Box-and-whisker plot showing the distribution of new isodecoder instances per ancestry codes. Thick horizontal bars indicate the median, while the bottom and top of the boxes the first and third quartiles of the distributions, respectively. (D) Low-scoring tRNA group. Distribution of new isodecoder instances per isoacceptor family. The most frequently occurring new isodecoder codes for cysteine (57%), followed by a suppressor tRNA (17%). Only those tRNAs with more than five new instances are shown. Unique new isodecoder instances found in > 1% of the population is also shown. Each instance is tagged with a Roman number. The nucleotide positions are adjusted according to the standard tRNA nomenclature. (E) Sequence change for the 13 new genes that are present in >1% population mapped onto the canonical tRNA structure.
None
Figure 3. Population analysis of the most frequent new tRNA sequences among the high scoring tRNA group. (A) Sequence change mapped onto the canonical tRNA secondary structure for tRNALeu(CAA), the tRNA gene with the most abundant new instances. Square bubbles indicate the nucleotide substitution frequencies. Conserved nucleotides are shown in black, while the anticodon nucleotides in gray. Dotted lines show base paired positions. (B) Probability table conditioned on ancestry for position 16 of tRNALeu(CAA). The SoAs label stands for South Asian, Amer for Americas, WeAf for West Africa and Euro for European. (C) Sequence change mapped onto the canonical tRNA secondary structure for tRNATyr(GUA), the tRNA gene with the second most abundant new instances. (D) Probability table conditioned on ancestry for position 26 of tRNATyr(GUA). The SoAs label stands for South Asian, EaAs for East Asian. (E and F) Sequence changes in the anticodon stem in two other abundant new isodecoders. The sequence changes introduce a purine mismatch in the anticodon stem. (E) Position 40 of tRNAArg(ACG) occurring in 15.5% population. (F) Position 27 of tRNACys(GCA) occurring in 11.3% population.
None
Figure 4. Structural mapping of pairs of tRNA isodecoder transcripts in vitro. Structural mapping of selected tRNA isodecoder pairs was performed by limited nuclease V1 and S1 digestion. Sequences in the context of standard tRNA secondary structure and mapping of tRNAArg(ACG) (A), tRNACys(GCA) (B), and tRNATyr(GUA) (C). Positions of RNA cuts were identified through alkaline hydrolysis (BH lane) and T1 ladder (T1 lane). The sequence change in the new tRNA isodecoder is indicated by red arrows and corresponds to the position of the red dot in gel. tRNA structural regions are indicated on the right side of the gel. (D) tRNA folding analysis by native gel electrophoresis. tRNA transcripts from T7 RNA polymerase reaction was directly loaded on 8% native gel containing 25 mM trisOAc, pH 7.5, 5 mM Mg(OAc)2. The amount of transcription reaction loaded in the left and right panels were 1 and 10 µl, respectively. Consistent with the structural mapping results, tRNATyr(GUA) variants fold in the same manner, whereas tRNAArg(ACG) variants fold very differently.
None
Figure 5. Stability and charging level of tRNAArg(ACG) isodecoder pair in vivo. (A) tRNA transcripts 32P-labeled at the terminal A76 were transfected into HeLa cells. Total RNA was isolated at designated time points, and equal amount of total RNA was loaded in each lane. tRNAArg(ACG) from the reference genome has C40 and is indicated as C lanes; the new isodecoder has G40 and is indicated as G lanes. (B) Quantitative analysis of the 32P-labeled tRNA bands in panel A. Data are normalized to the 36 h time point where it has the highest level of radioactivity. (C) tRNA transcripts 32P-labeled at the terminal A76 were transfected into HeLa cells. Total RNA under acidic conditions was isolated at designated time points. Equal amount of total RNA was digested with nuclease P1 and run on TLC. Different charging level of tRNA isodecoders at different time points analyzed by TLC. Free and acylated tRNA are indicated on the right side. (D) Quantitative analysis of the p*A and p*A-arg spots in panel A. The y-axis corresponds to the % of p*A-arg spot over p*A+p*A-arg signals.

References

    1. Abecasis GR, Auton A, Brooks LD, DePristo MA, Durbin RM, Handsaker RE, Kang HM, Marth GT, McVean GA, 1000 Genomes Project Consortium An integrated map of genetic variation from 1,092 human genomes. Nature. 2012;491:56–65. doi: 10.1038/nature11632. - DOI - PMC - PubMed
    1. Abecasis GR, Altshuler D, Auton A, Brooks LD, Durbin RM, Gibbs RA, Hurles ME, McVean GA, 1000 Genomes Project Consortium A map of human genome variation from population-scale sequencing. Nature. 2010;467:1061–73. doi: 10.1038/nature09534. - DOI - PMC - PubMed
    1. Manning AK, Hivert MF, Scott RA, Grimsby JL, Bouatia-Naji N, Chen H, Rybin D, Liu CT, Bielak LF, Prokopenko I, et al. DIAbetes Genetics Replication And Meta-analysis (DIAGRAM) Consortium. Multiple Tissue Human Expression Resource (MUTHER) Consortium A genome-wide approach accounting for body mass index identifies genetic variants influencing fasting glycemic traits and insulin resistance. Nat Genet. 2012;44:659–69. doi: 10.1038/ng.2274. - DOI - PMC - PubMed
    1. Marth GT, Yu F, Indap AR, Garimella K, Gravel S, Leong WF, Tyler-Smith C, Bainbridge M, Blackwell T, Zheng-Bradley X, et al. 1000 Genomes Project The functional spectrum of low-frequency coding variation. Genome Biol. 2011;12:R84. doi: 10.1186/gb-2011-12-9-r84. - DOI - PMC - PubMed
    1. Gravel S, Henn BM, Gutenkunst RN, Indap AR, Marth GT, Clark AG, Yu F, Gibbs RA, Bustamante CD, 1000 Genomes Project Demographic history and rare allele sharing among human populations. Proc Natl Acad Sci U S A. 2011;108:11983–8. doi: 10.1073/pnas.1019276108. - DOI - PMC - PubMed

Publication types

LinkOut - more resources