. 2014:3:e00590.
doi: 10.7554/eLife.00590. Epub 2014 Jan 21.

Extinction risk and conservation of the world's sharks and rays

Affiliations

Extinction risk and conservation of the world's sharks and rays

Nicholas K Dulvy et al. Elife. 2014.

Abstract

The rapid expansion of human activities threatens ocean-wide biodiversity. Numerous marine animal populations have declined, yet it remains unclear whether these trends are symptomatic of a chronic accumulation of global marine extinction risk. We present the first systematic analysis of threat for a globally distributed lineage of 1,041 chondrichthyan fishes-sharks, rays, and chimaeras. We estimate that one-quarter are threatened according to IUCN Red List criteria due to overfishing (targeted and incidental). Large-bodied, shallow-water species are at greatest risk and five out of the seven most threatened families are rays. Overall chondrichthyan extinction risk is substantially higher than for most other vertebrates, and only one-third of species are considered safe. Population depletion has occurred throughout the world's ice-free waters, but is particularly prevalent in the Indo-Pacific Biodiversity Triangle and Mediterranean Sea. Improved management of fisheries and trade is urgently needed to avoid extinctions and promote population recovery. DOI: http://dx.doi.org/10.7554/eLife.00590.001.

Keywords: biodiversity change; extinction risk; fishes; life histories; population biology; sharks and rays.


Conflict of interest statement

The authors declare that no competing interests exist.

Figures

Figure 1.
Figure 1.. The trajectory and spatial pattern of chondrichthyan fisheries catch landings and fin exports.
(A) The landed catch of chondrichthyans reported to the Food and Agriculture Organization of the United Nations from 1950 to 2009 up to the peak in 2003 (black) and subsequent decline (red). (B) The rising contribution of rays to the taxonomically-differentiated global reported landed catch: shark landings (light gray), ray landings (black), log ratio [rays/sharks], (red). Log ratios >0 occur when more rays are landed than sharks. The peak catch of taxonomically-differentiated rays peaks at 289,353 tonnes in 2003. (C) The main shark and ray fishing nations are gray-shaded according to their percent share of the total average annual chondrichthyan landings reported to FAO from 1999 to 2009. The relative share of shark and ray fin trade exports to Hong Kong in 2010 are represented by fin size. The taxonomically-differentiated proportion excludes the ‘nei’ (not elsewhere included) and generic ‘sharks, rays, and chimaeras’ category. DOI: http://dx.doi.org/10.7554/eLife.00590.003
Figure 2.
Figure 2.. IUCN Red List Threat status and the depth distribution of chondrichthyans in the FAO Fishing Areas of the Atlantic, Indian and Pacific Oceans, and Polar Seas.
Each vertical line represents the depth range (surface-ward minimum to the maximum reported depth) of each species and is colored according to threat status: CR (red), EN (orange), VU (yellow), NT (pale green), LC (green), and DD (gray). Species are ordered left to right by increasing median depth. The depth limit of the continental shelf is indicated by the horizontal gray line at 200 m. The Polar Seas include the following FAO Fishing Areas: Antarctic–Atlantic (Area 48), Indian (Area 58), Pacific (Area 88), and the Arctic Sea (Area 18). DOI: http://dx.doi.org/10.7554/eLife.00590.007
Figure 2—figure supplement 1.
Figure 2—figure supplement 1.. Map of Food and Agriculture Organization of the United Nations Fishing Areas and their codes: 18, Arctic Sea; 21, Atlantic, Northwest; 27, Atlantic, Northeast; 31, Atlantic, Western Central; 34, Atlantic, Eastern Central; 37, Mediterranean and Black Sea; 41, Atlantic, Southwest; 47, Atlantic, Southeast; 48, Atlantic, Antarctic; 51, Indian Ocean, Western; 57, Indian Ocean, Eastern; 58, Indian Ocean, Antarctic and Southern; 61, Pacific, Northwest; 67, Pacific, Northeast; 71, Pacific, Western Central; 77, Pacific, Eastern Central; 81, Pacific, Southwest; 87, Pacific, Southeast; and, 88, Pacific, Antarctic.
DOI: http://dx.doi.org/10.7554/eLife.00590.008
Figure 3.
Figure 3.. Standardized effect sizes with 95% confidence intervals from the two best explanatory models of life histories, geographic range and extinction risk in chondrichthyans.
The data were standardized by subtracting the mean and dividing by one standard deviation to allow for comparison among parameters. The relative importance is calculated as the sum of the Akaike weights of the models containing each variable. Chondrichthyans were scored as threatened (CR, EN, VU) = 1 or Least Concern (LC) = 0 for n = 367 marine species. Threat status was modeled using General Linear Mixed-effects Models, with size, depth and geography treated as fixed effects and taxonomy hierarchy as a random effect to account for phylogenetic non-independence. DOI: http://dx.doi.org/10.7554/eLife.00590.009
Figure 4.
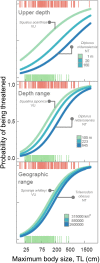
Figure 4.. Life history sensitivity, accessibility to fisheries and extinction risk.
Probability that a species is threatened due to the combination of intrinsic life history sensitivity (maximum body size, cm total length, TL) and accessibility to fisheries which is represented as minimum depth limit, depth range, and geographic range size (Extent of Occurrence). The lines represent the variation in body size-dependent risk for the upper quartile, median, and lower quartile of each range metric. The examplar species are all of similar maximum body length and the difference in risk is largely due to differences in geographic distribution. Chondrichthyans were scored as threatened (CR, EN, VU) = 1 or Least Concern (LC) = 0 for n = 366 marine species. The lines are the best fits from General Linear Mixed-effects Models, with maximum body size and geographic distribution traits treated as fixed effects and taxonomy hierarchy as a random effect to account for phylogenetic non-independence. Each vertical line in each of the ‘rugs’ represents the maximum body size and Red List status of each species: threatened (red) and LC (green). DOI: http://dx.doi.org/10.7554/eLife.00590.010
Figure 5.
Figure 5.. Life history, habitat, and extinction risk in chondrichthyans.
IUCN Red List status as a function of maximum body size (total length, TL cm) and accessibility to fisheries in marine chondrichthyans in three main habitats: coastal and continental shelf <200 m (‘Continental shelf’); neritic and oceanic pelagic <200 m (‘Pelagic’); and, deepwater >200 m (‘Deepwater’), n = 367 (threatened n = 148; Least Concern n = 219). The upper and lower ‘rug’ represents the maximum body size and Red List status of each species: threatened (upper rugs) and Least Concern (lower rugs). The lines are best fit using Generalized Linear Mixed-effects Models with 95% confidence intervals (Table 9). DOI: http://dx.doi.org/10.7554/eLife.00590.011
Figure 6.
Figure 6.. Evolutionary uniqueness and taxonomic conservation priorities.
Threat among marine chondrichthyan families varies with life history sensitivity (maximum length) and exposure to fisheries (depth distribution). (A) Proportion of threatened data sufficient species and the richness of each taxonomic family. Colored bands indicate the significance levels of a one-tailed binomial test at p=0.05, 0.01, and 0.001. Those families with significantly greater (or lower) than expected threat levels at p<0.05 against a null expectation that extinction risk is equal across families (35.6%). (B) The most and least threatened taxonomic families. (C) Average life history sensitivity and accessibility to fisheries of 56 chondrichthyan families. Significantly greater (or lower) risk than expected is shown in red (green). DOI: http://dx.doi.org/10.7554/eLife.00590.012
Figure 7.
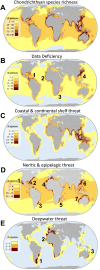
Figure 7.. Global patterns of marine chondrichthyan diversity, threat and knowledge.
(A) Total chondrichthyan richness, (B) the number of Data Deficient and threat by major habitat: (C) coastal and continental shelf (<200 m depth), (D) neritic and epipelagic (<200 m depth), and (E) deepwater slope and abyssal plain (>200 m) habitats. Numbers expressed as the total number of species in each 23,322 km2 cell. The numbers are hotspots refereed to in the text. DOI: http://dx.doi.org/10.7554/eLife.00590.015
Figure 8.
Figure 8.. Irreplaceability hotspots of the endemic threatened marine chondrichthyans.
Endemics were defined as species with an Extent of Occurrence of <500,000 km2 (n = 66). Irreplaceable cells with the greatest number of small range species are shown in red, with blue cells showing areas of lower, but still significant irreplaceability. Irreplaceability is the sum of the inverse of the geographic range sizes of all threatened endemic species in the cell. A value of 0.1 means that on average a single cell represents one tenth of the global range of all the species present in the cell. The numbers are hotspots referred to in the text. DOI: http://dx.doi.org/10.7554/eLife.00590.016
Figure 9.
Figure 9.. Spatial variation in the relative extinction risk of marine chondrichthyans.
Residuals of the relationship between total number of data sufficient chondrichthyans and total number of threatened species per cell, where positive values (orange to red) represent cells with higher threat than expected for their richness alone. DOI: http://dx.doi.org/10.7554/eLife.00590.017
Figure 10.
Figure 10.. Elevated threat in chondrichthyans with the largest geographic ranges, spanning the greatest number of national jurisdictions.
Frequency distribution of number of jurisdictions spanned by all chondrichthyans (black, n = 1,041) and threatened species only (red, n = 174), for (A) country EEZs, and (B) the overrepresentation of threatened species spanning a large number of country EEZs, shown by the log ratio of proportion of threatened species over the proportion of all species. The proportion of threatened species is greater than the proportion of all species where the log ratio = 0, which corresponds to range spans of 16 and more countries. DOI: http://dx.doi.org/10.7554/eLife.00590.019

Comment in

References

    1. Akcakaya HR, Ferson S, Burgman MA, Keith DA, Mace GM, Todd CR. Making consistent IUCN classifications under uncertainty. Conservation Biology. 2000;14:1001–1013. doi: 10.1046/j.1523-1739.2000.99125.x. - DOI
    1. Anderson SC, Farmer RG, Ferretti F, Houde ALS, Hutchings JA. Correlates of vertebrate extinction risk in Canada. Bioscience. 2011a;61:538–549. doi: 10.1525/bio.2011.61.7.8. - DOI
    1. Anderson SC, Flemming JM, Watson R, Lotze HK. Serial exploitation of global sea cucumber fisheries. Fish and Fisheries. 2011b;12:317–339. doi: 10.1111/j.1467-2979.2010.00397.x. - DOI
    1. Barker MJ, Schluessel V. Managing global shark fisheries: suggestions for prioritizing management strategies. Aquatic Conservation: Marine and Freshwater Ecosystems. 2005;15:325–347. doi: 10.1002/aqc.660. - DOI
    1. Barnett LAK, Winton MV, Ainsley SM, Cailliet GM, Ebert DA. Comparative demography of skates: life-history correlates of productivity and implications for management. PLOS ONE. 2013;8:e65000. doi: 10.1371/journal.pone.0065000. - DOI - PMC - PubMed

Publication types