Comment
. 2013 Nov-Dec;4(6):450-9.
doi: 10.4161/nucl.27413. Epub 2013 Dec 6.

Label-free mass spectrometry exploits dozens of detected peptides to quantify lamins in wildtype and knockdown cells

Affiliations
Comment

Label-free mass spectrometry exploits dozens of detected peptides to quantify lamins in wildtype and knockdown cells

Joe Swift et al. Nucleus. 2013 Nov-Dec.

Abstract

Label-free quantitation and characterization of proteins by mass spectrometry (MS) is now feasible, especially for moderately expressed structural proteins such as lamins that typically yield dozens of tryptic peptides from tissue cells. Using standard cell culture samples, we describe general algorithms for quantitative analysis of peptides identified in liquid chromatography tandem mass spectrometry (LC-MS/MS). The algorithms were foundational to the discovery that the absolute stoichiometry of A-type to B-type lamins scales with tissue stiffness (Swift et al., Science 2013). Isoform dominance helps make sense of why mutations and changes with age of mechanosensitive lamin-A,C only affect "stiff" tissues such as heart, muscle, bone, or even fat, but not brain. A Peak Ratio Fingerprinting (PRF) algorithm is elaborated here through its application to lamin-A,C knockdown. After demonstrating the large dynamic range of PRF using calibrated mixtures of human and mouse lysates, we validate measurements of partial knockdown with standard cell biology analyses using quantitative immunofluorescence and immunoblotting. Optimal sets of MS-detected peptides as determined by PRF demonstrate that the strongest peptide signals are not necessarily the most reliable for quantitation. After lamin-A,C knockdown, PRF computes an invariant set of "housekeeping" proteins as part of a broader proteomic analysis that also shows the proteome of mesenchymal stem cells (MSCs) is more broadly perturbed than that of a human epithelial cancer line (A549s), with particular variation in nuclear and cytoskeletal proteins. These methods offer exciting prospects for basic and clinical studies of lamin-A,C as well as other MS-detectable proteins.

Keywords: isoform; label-free; lamin; mass spectrometry; normalization; proteomics; spliceoform.


Figures

None
Figure 1. (A) Peak Ratio Fingerprinting (PRF) for protein quantitation by label-free LC-MS/MS (B) Peptide selection assumes the products of digestion of a given protein should be present at equal concentrations. Ratios between ion current signals for peptides from that protein will therefore remain constant. The plot compares peptide ratios between wildtype and knockdown. Peptide-pair ratios from the target protein, lamin-A,C, should lie on the diagonal. (C) An invariant set of proteins should have peptide-pair ratios that do not vary between conditions. By searching for such sets, we establish housekeeping basis sets relative to which knockdown can be quantified. (D) A ratio-of-ratios cross-term plot with the percentage of wildtype expression inferred from the displacement from the diagonal. The inset shows the near Gaussian distribution of projected intercepts on the y-axis for the optimized target peptide set (black) and the broadened and skewed distribution from the un-optimized set (gray). (E) To determine the number of peptides required for quantitation, knockdown percentage was calculated from smaller, random samples of the lamin peptide set, comparing the results with and without PRF optimization. Error decreased with increasing sample size, and knockdown percentage converged to a different value as anomalous peptides were excluded. Optimization decreased the number of peptides required to halve the standard deviation. (F) A basis set of invariant peptides was selected for relative protein quantitation. The plot shows the distribution of ion current magnitudes in complete and invariant peptide sets. The two distributions are similar, suggesting no bias toward signal extremes. The ratio-of-ratios approach treats all included peptides with equal weighting, independent of ion current. In contrast, a minority of high signal peptides heavily skews methods based on signal summation.
None
Figure 2. Label-free quantification proof of concept. (A) Lysates from mouse (C2C12 muscle progenitors) and human (A549) cell lines were mixed at ratios of 10:90, 25:75, 50:50, 75:25 and 90:10 prior to gel electrophoresis. Peptides unique to mouse or human were then used to quantify relative to a standardizing set selected from peptides unique to the other species. Label-free MS was compared with dilution for 143 proteins quantified with more than three optimized, species-specific peptides per protein over a dynamic range of almost 100-fold (between 11% and 900% of the 50:50 sample). A subset of structural proteins is shown for illustration. Error bars are based on taking all possible column pair combinations of each sample and establish consistency of analysis. (B) A repeat analysis of an A549 lysate was also considered: in this case, we expect all proteins to remain at 100% and again show a subset of structural proteins. (C) Histograms showing width of distributions of ratios compared with the ratio expected based on mixing of mouse and human material. Larger changes (i.e., to 11% or 900%) result in the greatest extent of inaccuracy.
None
Figure 3. Comparison of different methods for measuring a lamin-A knockdown in MSCs. (A) Sample images of untreated and knockdown MSC cells, stained with phalloidin, Hoechst and anti-lamin-A,C (B) Imaging methods allow cell-by-cell correlation of lamin intensity with properties such as nuclear area. In this case we see a clusters of wild-type (blue) and lamin KD (red) cells, with a slightly reduced area. In addition, there is a scattering of both cells types at higher integrated lamin intensity and nuclear area, possibly due to cells that in the process of mitosis. (C) Quantification of the extent of knockdown by fluorescence microscopy. (D) The same sample was examined by western blotting. (E) Summary of methods for determining the extent of lamin knockdown (comparing the same MSC sample): mass spectrometry, western blotting and mRNA microarray are in general agreement, but immunofluorescence imaging here underestimates the extent of knockdown.
None
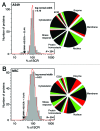
Figure 4. Proteomic-scale effect of lamin KD in A549 cells and MSCs. (A) Distributions of differences in protein levels during lamin KD, relative to a scrambled control, averaged over two experiments in A549 cells. The pie chart indicates the fraction of proteins changing up (red) or down (green) by more than 25% in each of the indicated classes. (B) Protein distribution averaged over three KD experiments in MSC cells, relative to scrambled controls. Consistent with a more plastic identity, MSCs generally showed a broader response to perturbation than A549 cells.
None
Figure 5. Schematic of method used to determine the absolute stoichiometric ratio (ɸ) between proteins. Proteins α (e.g., lamin-A,C) and β (e.g., lamin B1/B2) must share a common overlap region (e.g., the tryptic peptide LLEGEEER). There must also be a perturbation between two conditions, A and B, for example between untreated and KD samples. The three f values represent the fold changes in detection of each of the regions (proteins α, β and overlap) between the two conditions. Note that ɸ A can be determined from ɸ B without further detection of the overlap region.

Comment on

References

    1. Pelham RJ, Jr., Wang Yl. Cell locomotion and focal adhesions are regulated by substrate flexibility. Proc Natl Acad Sci U S A. 1997;94:13661–5. doi: 10.1073/pnas.94.25.13661. - DOI - PMC - PubMed
    1. Discher DE, Janmey P, Wang YL. Tissue cells feel and respond to the stiffness of their substrate. Science. 2005;310:1139–43. doi: 10.1126/science.1116995. - DOI - PubMed
    1. Engler AJ, Sen S, Sweeney HL, Discher DE. Matrix elasticity directs stem cell lineage specification. Cell. 2006;126:677–89. doi: 10.1016/j.cell.2006.06.044. - DOI - PubMed
    1. Swift J, Ivanovska IL, Buxboim A, Harada T, Dingal PCDP, Pinter J, Pajerowski JD, Spinler KR, Shin J-W, Tewari M, et al. Nuclear lamin-A scales with tissue stiffness and enhances matrix-directed differentiation. Science. 2013;341:1240104. doi: 10.1126/science.1240104. - DOI - PMC - PubMed
    1. Kim Y, Tewari M, Pajerowski JD, Cai S, Sen S, Williams JH, Sirsi SR, Lutz GJ, Discher DE. Polymersome delivery of siRNA and antisense oligonucleotides. J Control Release. 2009;134:132–40. doi: 10.1016/j.jconrel.2008.10.020. - DOI - PMC - PubMed

Publication types

LinkOut - more resources