

Pharmacological reversion of sphingomyelin-induced dendritic spine anomalies in a Niemann Pick disease type A mouse model
- PMID: 24448491
- PMCID: PMC3958313
- DOI: 10.1002/emmm.201302649
Pharmacological reversion of sphingomyelin-induced dendritic spine anomalies in a Niemann Pick disease type A mouse model
Abstract
Understanding the role of lipids in synapses and the aberrant molecular mechanisms causing the cognitive deficits that characterize most lipidosis is necessary to develop therapies for these diseases. Here we describe sphingomyelin (SM) as a key modulator of the dendritic spine actin cytoskeleton. We show that increased SM levels in neurons of acid sphingomyelinase knock out mice (ASMko), which mimic Niemann Pick disease type A (NPA), result in reduced spine number and size and low levels of filamentous actin. Mechanistically, SM accumulation decreases the levels of metabotropic glutamate receptors type I (mGluR1/5) at the synaptic membrane impairing membrane attachment and activity of RhoA and its effectors ROCK and ProfilinIIa. Pharmacological enhancement of the neutral sphingomyelinase rescues the aberrant molecular and morphological phenotypes in vitro and in vivo and improves motor and memory deficits in ASMko mice. Altogether, these data demonstrate the influence of SM and its catabolic enzymes in dendritic spine physiology and contribute to our understanding of the cognitive deficits of NPA patients, opening new perspectives for therapeutic interventions.
Figures
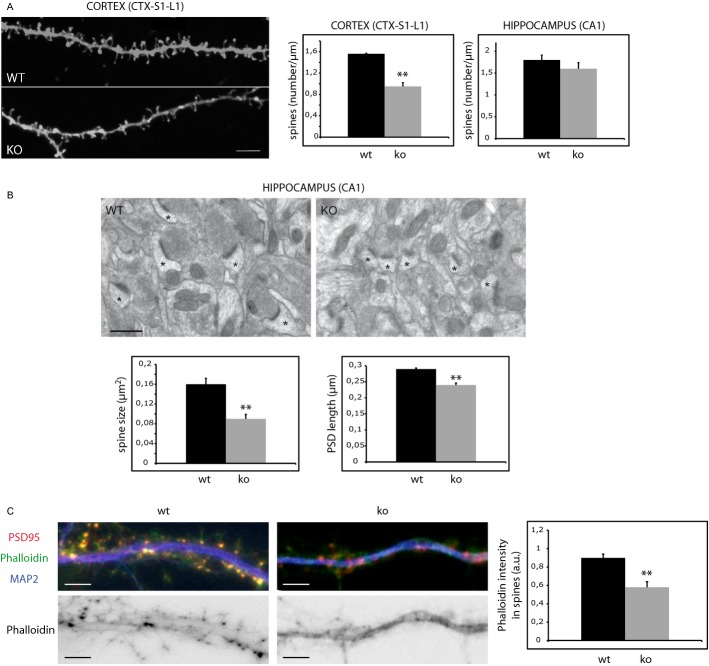
Dendritic spines in dendrites of neurons from the S1-L1 cortex of wt and ASMko mice visualized by diOlistics and confocal microscopy. Graphs show dendritic spine density per μm of dendritic segments in the S1-L1 cortex (P = 0.01) or the CA1 region of the hippocampus (n = 4). Bar 5 μm.
Electron micrographs of synapses in the hippocampal CA1 stratum radiatum of wt and ASMko mice. Spines are indicated by asterisks. Graphs show mean and standard deviation (mean ± s.d.) of spine size in μm2 (P = 0.016) and PSD length in μm (P = 0.006) in wt and ASMko mice (n = 70 synapses in each of 3 mice per genotype).
Top: Dendrites from wt or ASMko cultured hippocampal neurons stained for MAP2 (blue), PSD95 (red), and phalloidin (green); bottom: phalloidin staining only. The graph shows mean ± s.d. of phalloidin fluorescence intensity per spine area (n = 250 dendritic spines from 3 independent cultures, P = 0,011). Bars: 5 μm.
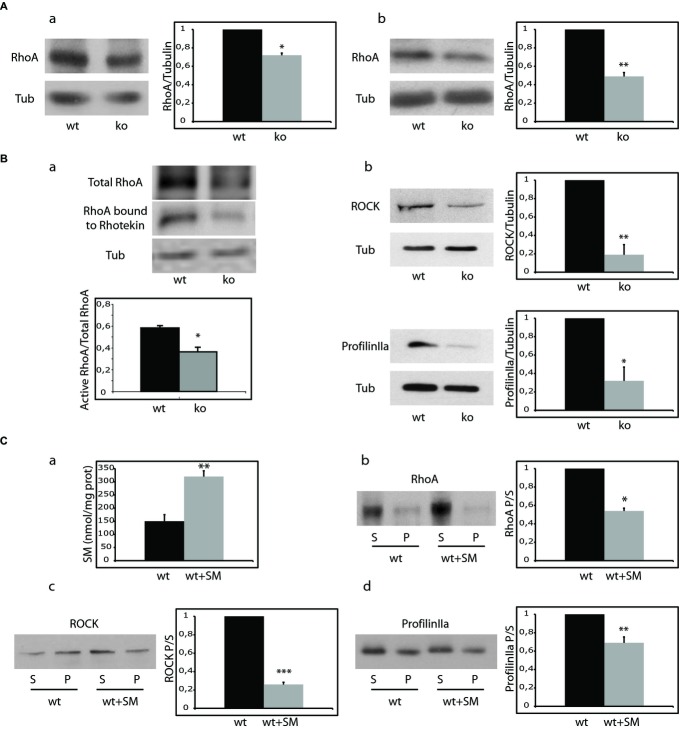
Western blot of RhoA and tubulin levels in total (a) and membrane extracts (b) from wt and ASMko synaptosomes. Graphs show mean ± s.d. of RhoA levels in ASMko conditions normalized to tubulin and referred to wt levels that were considered as 1 (n = 3, *Ptotal RhoA = 0.04, *Pmembrane RhoA = 0.008).
(a) Activity of RhoA in wt and ASMko synaptosomes determined by the Rhotekin binding assay. Tubulin is shown as loading control. Graph shows mean ± s.d. of the ratio of Rhotekin-bound (active) RhoA to total RhoA (n = 3, *P = 0.025). (b) Western blots of ROCK, ProfilinIIa and tubulin levels in membrane extracts from wt and ASMko synaptosomes. Graphs show mean ± s.d. of ROCK (*P = 0.017) or ProfilinIIa (*P = 0.033) levels in ASMko conditions normalized to tubulin and referred to wt levels that were considered as 1 (n = 3).
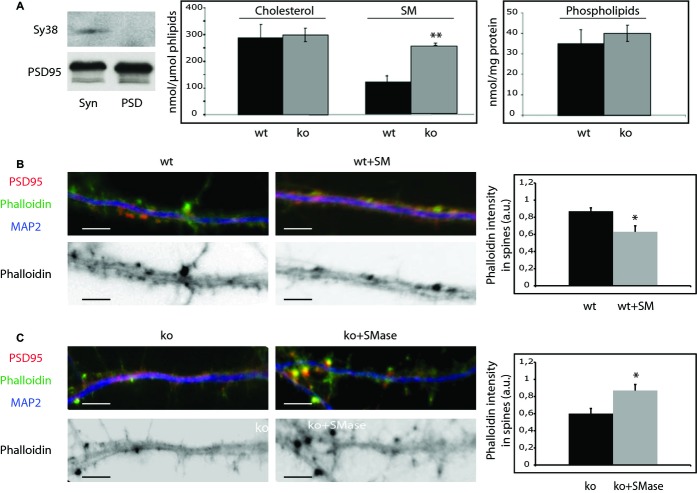
(a) SM levels (nmol/mg protein) in wt synaptosomes treated or not with SM. Graph shows mean ± s.d. in treated synaptosomes referred to non treated that were considered as 1 (n = 3, **P = 0.019). (b, c, d) Western blots of RhoA (b), ROCK (c) and ProfilinIIa (d) levels in supernatants (S) and pellets (P) after 100,000 g centrifugation of wt synaptosomes treated or not with SM. Graphs show mean ± s.d. of each protein ratio pellet/supernatant in treated samples referred to non-treated that were considered as 1 (n = 3; *PRhoASM = 0.029, ***PROCKSM = 0.0009, **PprofilinIIaSM= 0.008).
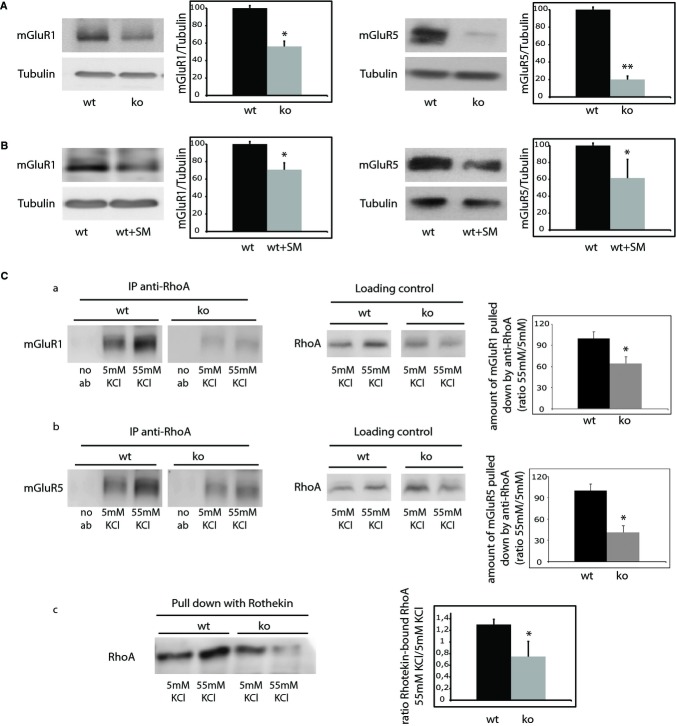
Western blot of mGluR1/5 and tubulin levels in membrane extracts of wt and ASMko synaptosomes. Graphs show mean ± s.d. in ASMko conditions normalized to tubulin and referred to wt levels that were considered as 100% (n = 3; *PmGluR1 = 0.031, **PmGluR5 = 0.02).
Western blot of mGluR1/5 levels in wt synaptosomes treated or not with SM. Graphs show mean ± s.d. of mGluR1/5 levels normalized to tubulin in SM treated samples referred to those non treated that were considered as 100% (n = 3; *PmGluR1 = 0.034, *PmGluR5 = 0.041).
Levels of interaction of mGluR1 (a) or mGluR5 (b) with RhoA as determined by immunoprecipitation of mGluR1/5 using the antibody against RhoA in wt and ASMko synaptosomes in control conditions (5 mM KCl) or upon stimulus (55 mM KCl). Specificity of the immunoprecipitation was monitored in extracts not incubated with anti-RhoA (no ab). Loading controls show the total amount of RhoA in the samples used for the immunoprecipitation assays. Graphs show mean ± s.d. in arbitrary units of the amount of mGluR1/5 pulled down by the anti-RhoA antibody (n = 3; *PmGluR1 = 0.04, *PmGluR5 = 0.023). (c) Changes in the activity of RhoA determined by the Rhotekin binding assay in synaptosomes from wt and ASMko mice brains stimulated (55 mM KCl) or not (5 mM KCl) with KCl. Graph shows mean ± s.d. of stimulus-induced RhoA activation as the ratio of Rhotekin-bound RhoA in 55/5 mM in wt or ASMko samples (n = 3, *P = 0.035).
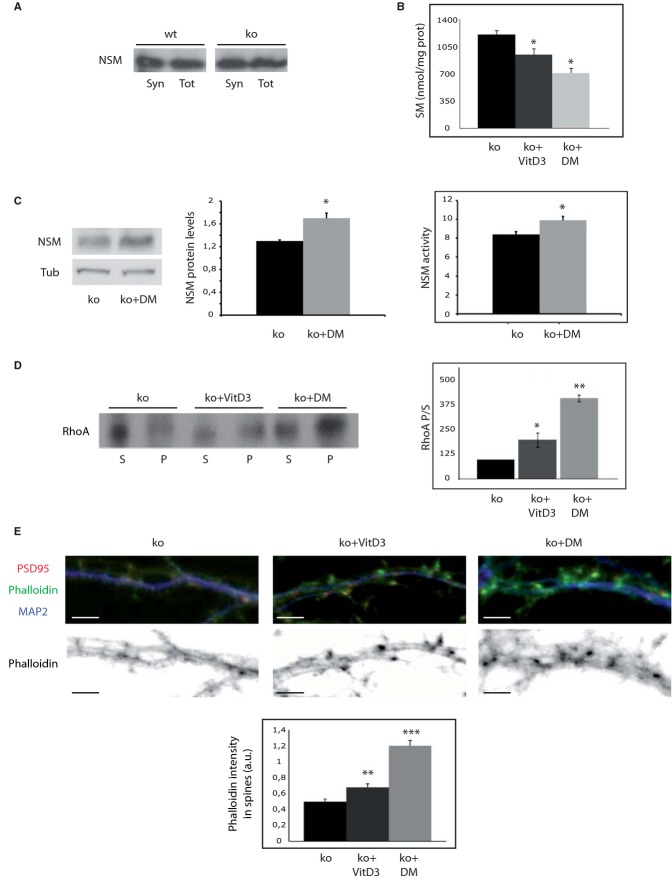
Western blot of NSM protein levels in total (Tot) and synaptosomal (Syn) fractions from wt and ASMko mice brains containing the same amount of protein.
Mean ± s.d. of SM levels (nmol/mg protein) in ASMko synaptosomes treated or not with 1α, 25-dihydroxivitamin D3 (VitD3) or dexamethasone (DM) (n = 3, *PvitD3 = 0.04; *PDM=0.033).
Western blot of NSM and tubulin levels in ASMko synaptosomes treated or not with VitD3 and dexamethasone. Graph shows mean ± s.d. of NSM protein levels normalized to tubulin (n = 3, P = 0.025). Graphs to the right show mean ± s.d. of NSM activity in ASMko synaptosomes treated or not with dexamethasone (n = 3, *P = 0.032).
Western blots of RhoA levels in supernatants (S) and pellets (P) after 100,000 g centrifugation of ASMko synaptosomes treated or not with VitD3 or DM. Graph shows mean ± s.d. of the RhoA ratio pellet/supernatant in the treated samples as percentage of ASMko non treated samples that were considered 100% (n = 3; *PvitD3 = 0.042; **PDM = 0.001).
Top: Dendrites from ASMko neurons non treated or treated with vitaminD3 or dexamethasone stained for MAP2 (blue), PSD95 (red), and phalloidin (green); bottom: phalloidin staining only. The graph shows mean ± s.d. of phalloidin fluorescence intensity per spine area (n = 250 dendritic spines from 3 independent cultures, **PvitD3 = 0.001; ***PDM = 0.0008). Bars: 5 μm.
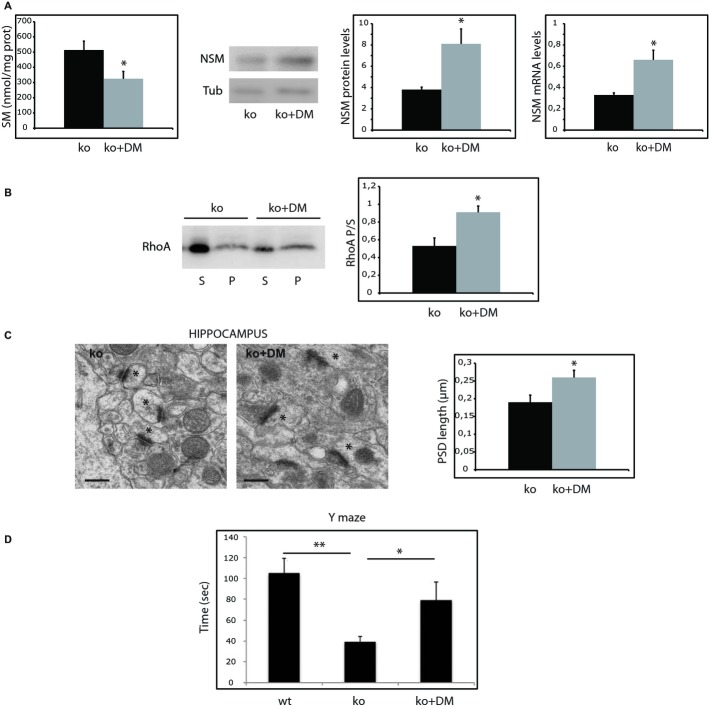
Mean ± s.d. of SM levels (nmol/mg protein) in synaptosomes from ASMko females treated or not with dexamethasone (n = 10; *P = 0.03). Western blot of NSM and tubulin levels in synaptosomes derived from ASMko females treated or not with dexamethasone. Graphs show mean ± s.d. of NSM protein (normalized to tubulin) and mRNA levels (n = 10, *PNSM prot = 0.024; *PNSM mRNA = 0.03).
Western blots shows RhoA levels in supernatants (S) and pellets (P) after 100 000 g centrifugation of synaptosomes from ASMko females treated or not with dexamethasone. Graph shows mean ± s.d. of the RhoA ratio pellet/supernatant in synaptosomes from ASMko females treated or not with dexamethasone (n = 10, *P = 0.01).
Electron micrographs of synapses in the hippocampal CA1 stratum radiatum of ASMko females treated or not with dexamethasone. Spines are indicated by asterisks. Graph shows mean ± s.d. of PSD length in μm (n = 70 synapses in each of 3 mice per condition, *P = 0.031).
Results of the Y-maze test in wt, ASMko and dexamethasone ASMko treated females. Graph shows mean ± s.d. of the time (in seconds) spent by the mice in the novel arm (n = 7; **Pko vs wt = 0.009, *PDMko vs ko = 0.021).
References
-
- van de Beek D, Brouwer MC, Thwaites GE, Tunkel AR. Advances in treatment of bacterial meningitis. Lancet. 2012;380:1693–1702. - PubMed
-
- Bonthius DJ, Karacay B. Meningitis and encephalitis in children. An update. Neurol Clin. 2002;20:1013–1038. - PubMed
-
- Bourguignon LY, Singleton PA, Diedrich F, Stern R, Gilad E. CD44 interaction with Na+-H+ exchanger (NHE1) creates acidic microenvironments leading to hyaluronidase-2 and cathepsin B activation and breast tumor cell invasion. J Biol Chem. 2004;279:26991–27007. - PubMed
-
- Bruccoleri A, Pennypacker KR, Harry GJ. Effect of dexamethasone on elevated cytokine mRNA levels in chemical-induced hippocampal injury. J Neurosci Res. 1999;57:916–926. - PubMed
Publication types
MeSH terms
Substances
Grants and funding
LinkOut - more resources
Full Text Sources
Other Literature Sources
Molecular Biology Databases
