Review
. 2014 Feb;15(2):128-35.
doi: 10.1038/ni.2796.

Single-cell technologies for monitoring immune systems

Affiliations
Review

Single-cell technologies for monitoring immune systems

Pratip K Chattopadhyay et al. Nat Immunol. 2014 Feb.

Abstract

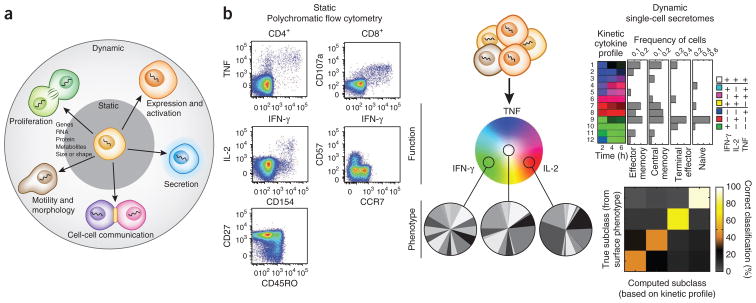
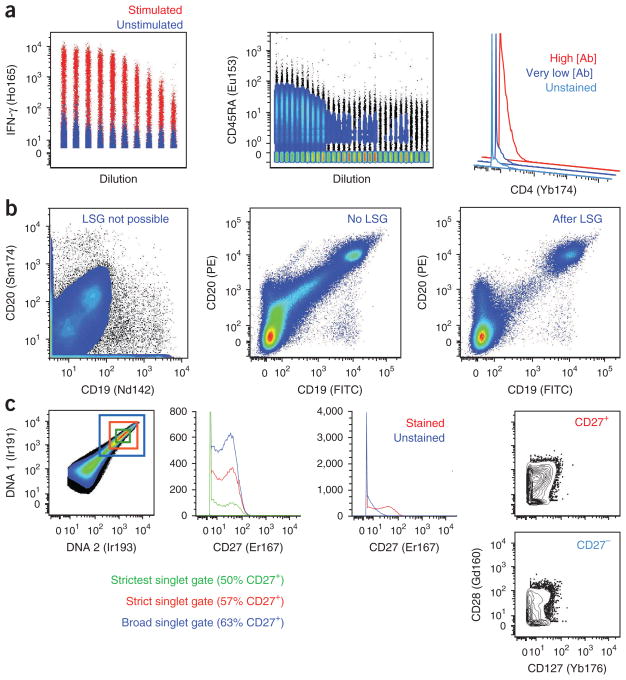
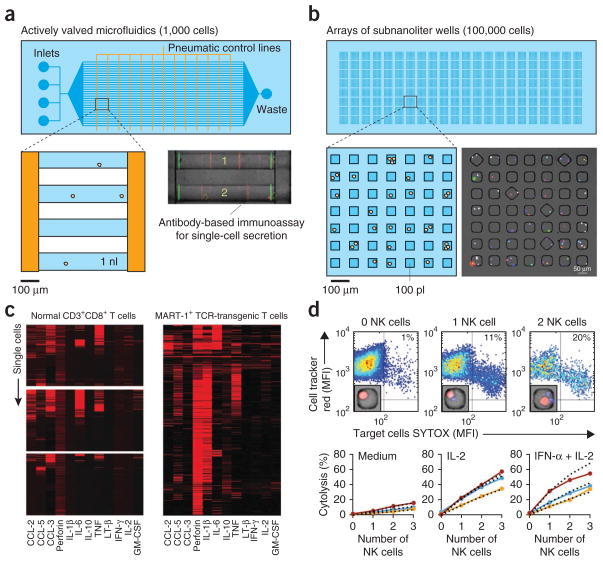
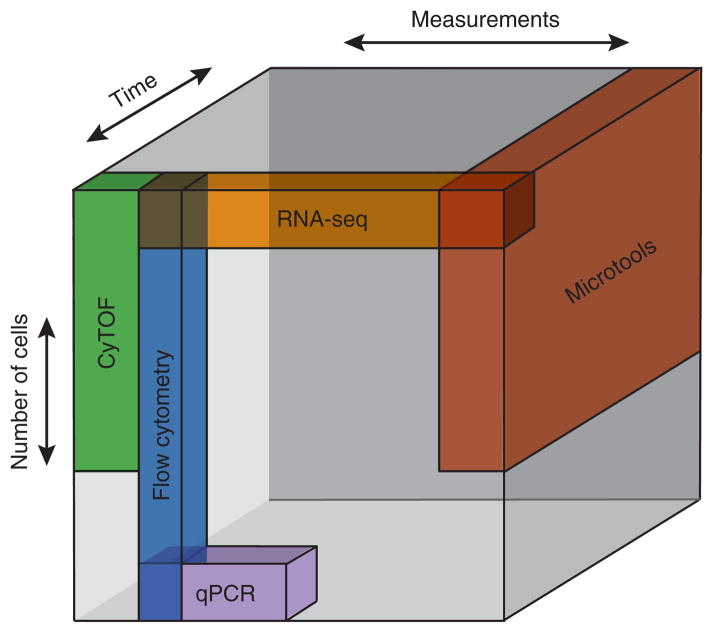
The complex heterogeneity of cells, and their interconnectedness with each other, are major challenges to identifying clinically relevant measurements that reflect the state and capability of the immune system. Highly multiplexed, single-cell technologies may be critical for identifying correlates of disease or immunological interventions as well as for elucidating the underlying mechanisms of immunity. Here we review limitations of bulk measurements and explore advances in single-cell technologies that overcome these problems by expanding the depth and breadth of functional and phenotypic analysis in space and time. The geometric increases in complexity of data make formidable hurdles for exploring, analyzing and presenting results. We summarize recent approaches to making such computations tractable and discuss challenges for integrating heterogeneous data obtained using these single-cell technologies.


Conflict of interest statement

COMPETING FINANCIAL INTERESTS

The authors declare no competing financial interests.

Figures

Figure 1
Figure 1
Evolving landscape of cellular traits. (a) Schematic of cellular traits that can be measured in a static fashion (at a fixed point in time) and processes that imply dynamic movement of the system. (b) Combined view of activated T cells resolved by static measurements of state (left) by polychromatic flow cytometry and dynamic measurements of cytokine release (right) by serial microengraving with arrays of subnanoliter wells. T cells exhibiting different polyfunctional states (e.g., IFN-γ+, IL-2+, IFN-γ+IL-2+TNF+; color wheel) can have a range of surface-expressed markers indicating various states of maturity and differentiation based on flow cytometry (pie charts, in which each slice represents cells with a unique combination of the RA isoform of CD45 (CD45RA), CCR7, CD27 and CD57). TNF, tumor necrosis factor. Kinetic measurements of these functional states that temporally resolve dominant patterns of cytokine release show that a subset of trajectories represent the major kinetic profiles associated with T cells of varying maturity (e.g., naive, effector memory and central memory; top right). The confusion matrix shows the percentage of T cells in each differentiated state that are assigned to the correct state based only on the measured trajectories. Random assignment of state in this example is 25% (temporal trajectories and confusion matrix adapted from ref. 8).
Figure 2
Figure 2
Antibody staining in mass cytometry. (a) Results of mass cytometry analyses, demonstrating variable staining quality among reagents. Some isotope-tagged antibodies (about 60% of those we have tested) yield very high staining indices, a measure of detection sensitivity (e.g., anti-human IFN-γ Ho165; left). This antibody does show some binding to unstimulated cells (’unstimulated’). Other isotope-tagged antibodies (about 20%) have much lower staining indices (e.g., anti-human CD45RA-Eu153; center), and nonspecific signal is seen even at low concentrations of antibody. The remaining antibodies poorly resolve from background at any concentration (e.g., anti-human CD4-Yb174; right). (b) CD19 and CD20 staining patterns by mass (left) and flow cytometry (middle and right) demonstrate the importance of light-scatter gating (LSG) to eliminate myeloid cells, which often display considerable background when analyzing lymphocytes. This morphologically related signal is not available yet in mass cytometry. (c) Discrimination of singlet signals from multiple cells by mass cytometry typically relies on DNA-intercalator staining (far left); the stringency of this gate, however, greatly influences the percentage of cells classified as positive for a given marker (middle left) but also eliminates progressively greater fractions of collected data. Staining for some markers (e.g., anti-human CD27-Er167; middle right) poorly separates from background, resulting in impure populations. These lead to an inability to discern if the presence of CD127+CD28+ cells in both CD27+ and CD27 cells (far right) reflects true biology, impure gating or poor doublet discrimination.
Figure 3
Figure 3
Classes of microtools for single-cell analysis. (a) Schematic of a microfluidic system (design is based on ref. 30) with integrated pneumatically actuated valves (orange lines). Cells, reagents and medium flow from left to right in the blue channels. Pressurization of the pneumatic lines seals regions of the blue channels to trap cells. The expanded view shows one region of trapped cells where the nominal volumes are ~1 nl. A representative region of the system is shown in the micrograph (adapted from ref. 30); numbers of cells per trap are indicated, and the overlaid fluorescence indicates regions for antibody-based immunoassays to capture cytokines (red) and reference marks (green). (b) Schematic of an array of subnanoliter wells, with the magnified region showing one block of wells with nominal volumes of ~100 pl each. The composite fluorescence micrograph shows a set of wells containing human lymphocytes with barcoded labels to identify samples. (c) Heatmaps (adapted from ref. 30) showing amounts of 12 secreted factors captured from single activated T cells (each line shows data associated with one cell) in a microfluidic system. Data are for CD8+ T cells from three healthy subjects (‘normal’; left) and MART-1+ T cell antigen receptor (TCR) transgenic T cells from a melanoma patient (right). (d) Independent cytolytic behavior of NK cells engaging human leukocyte antigen (HLA)-deficient tumor cells. Scatter plots show nuclear staining of target tumor cells measured by SYTOX staining and the intracellular staining of the target cells after 4 h in coculture with 0, 1 or 2 NK cells. MFI, mean fluorescence intensity. Insets, representative micrographs of the configurations of cells in wells scored for each condition. Graphs show measured rates of cytolytic activity (solid points and lines) compared to the predicted values based on an independence probability model (dashed lines) as a function of the number of NK cells per well. Each color represents a unique donor; the NK cells from each subject were used with no stimulation (medium) ex vivo or upon activation as indicated (reprinted from ref. 36).
Figure 4
Figure 4
Relative structure of data from single-cell analyses. Each major class of technology for single-cell analysis is plotted schematically in the three-dimensional data cube represented by the numbers of cells measured, the numbers of parameters scored and breadth of temporal resolution afforded. The specific axes of cells and measurements are not drawn to scale but emphasize relative differences in each measurement. Overlapping regions indicate opportunities to integrate complementary technologies and highlight orthogonality in associated data structures that may arise from each.
Figure 5
Figure 5
Comparative analysis of different single-cell technologies.

References

    1. Mahony J, et al. Development of a respiratory virus panel test for detection of twenty human respiratory viruses by use of multiplex PCR and a fluid microbead-based assay. J Clin Microbiol. 2007;45:2965–2970. - PMC - PubMed
    1. Ambrosino E, et al. A multiplex assay for the simultaneous detection of antibodies against 15 Plasmodium falciparum and Anopheles gambiae saliva antigens. Malar J. 2010;9:317. - PMC - PubMed
    1. Gaucher D, et al. Yellow fever vaccine induces integrated multilineage and polyfunctional immune responses. J Exp Med. 2008;205:3119–3131. - PMC - PubMed
    1. Perfetto SP, Chattopadhyay PK, Roederer M. Seventeen-colour flow cytometry: unravelling the immune system. Nat Rev Immunol. 2004;4:648–655. - PubMed
    1. Chattopadhyay PK, et al. Quantum dot semiconductor nanocrystals for immunophenotyping by polychromatic flow cytometry. Nat Med. 2006;12:972–977. - PubMed

Publication types